Pollution Science X
(Pollution Science 101)
The Arctic & Antarctic Poles
Editor: Michael Ross
Emergency release
Drafted: June 17th, 2023
Published: June 20th, 2025 12:00 PM
Updated: January 12th, 2026
___________________________________
___________________________
The following research and documents will detail the ongoing pollution in the Arctic and Antarctica. This book will explain the solutions to better our environment.
The following article is a new report written by Michael James Ross from Pollution Science. This book will explain the ongoing pollution and environmental concerns in the Polar regions. The present blog was written for the audience to better understand the climate in the Polar regions of our world. We often see that some predictions about the ice caps are sometimes incorrect. Recently published science papers have confirmed new must see evidence with the climate in the Arctic and Antarctica that can be seen in our following publication.
___________________________
Section 1: Pollution
Section 2: Environment (The Arctic)
Section 3: Biology
Section 4: The Polar Ice Caps
___________________________
___________________________
___________________________
Section 1: Pollution
___________________________
___________________________
___________________________
Pollution Science X (Pollution Science 101) - The Arctic
June 25th, 2025
Editor: Michael James Ross
PollutionScience101Arctic.blogspot.com
___________________________
Pollution Science X (Pollution Science 101) - The Antarctic
June 25th, 2025
Editor: Michael James Ross
PollutionScience101Antarctic.blogspot.com
___________________________
Pollution Science 101 - Russia
December 2nd, 2015
Editor: Michael James Ross
Pollutionscience101Russia.blogspot.com
___________________________
Record Amount of Plastic Pollution Found Trapped in Arctic Sea Ice
April 25, 2018
Scientists have found a record amount of microplastic particles trapped in Arctic sea ice — as much as 12,000 pieces per liter of ice. The level of plastic pollution, measured in core samples taken at five different regions in the Arctic in 2014 and 2015, measured three times higher than previous studies.
Among the plastic pollution were particles of packaging, paints, nylon, polyester, and cellulose acetate, commonly used to make cigarette filters, The Guardian reported. The scientists said much of the pollution traveled to the Arctic from the Pacific Ocean’s massive garbage patch. But particles of paints and nylon likely originated from ships and fishing nets, they said, demonstrating the increase in shipping and fishing activity in the Arctic as sea ice disappears in response to climate change. The research, led by scientists at the Alfred Wegener Institute (AWI) in Germany, was published this week in the journal Nature Communications.
More than half of the plastic particles found in the ice measured less than a twentieth of a millimeter wide, small enough to be easily ingested by Arctic microorganisms and crustaceans and accumulate as they move up the food chain.
“No one can say for certain how harmful these tiny plastic particles are for marine life,” Ilka Peeken, a biologist at AWI and lead author of the study, said in a statement, “or ultimately also for human beings.”

Scientists took sea ice cores to study plastic pollution levels in five regions of the Arctic.
https://e360.yale.edu/digest/record-amount-of-plastic-pollution-found-trapped-in-arctic-sea-ice
___________________________
Plastic waste 'building up' in Arctic
8 February 2018
https://www.bbc.com/news/science-environment-42947155
Plastic waste is building up in the supposedly pristine wilderness of the Norwegian Arctic, scientists say.
Researchers are particularly concerned about huge concentrations of microplastic fragments in sea ice.
They say they've found plastic litter almost everywhere in the Arctic they have looked.
Norwegian fishermen are worried that their fish stocks may lose their reputation for being untouched by pollution.
Most of the large plastic waste there comes from discarded fishing gear.
And boat owners admit it will take hundreds of years to overcome a few reckless decades of using the sea as a dump.
Norway's environment minister says politicians in the past haven't fully registered the extent of the problem.
A synthesis report from the Norwegian Polar Institute to the recent Arctic Frontiers conference in Tromsø says there's a great need for more research into the extent of possible harm from plastic.
It says effects have been monitored so far on zooplankton, invertebrates, fish, seabirds, and mammals.
Research shows that up to 234 particles have been found concentrated into just one litre of melted Arctic sea ice. That's much higher than in the open ocean.
Researchers explain that sea ice forms from the top. By unfortunate coincidence, plastic particles also float at the surface, so they get bonded into the ice as it freezes.
They are not yet sure how much of a threat this presents.
But they are worried about the impact on Arctic wildlife if the particles are released as sea ice continues to shrink.
Geir Wing Gabrielsen, one of the paper's authors, told BBC News: "We are finding more and more plastic waste in Svalbard, where I work. "The northern fulmar breeds in Svalbard.
"At the end of the 1970s we found very few plastic in their stomachs. In 2013 when we last investigated, some had more than 200 pieces of plastic in their stomachs.
"Other creatures are getting entangled in nets washed up on beaches - like reindeer. Some die because they can't release their antlers - we find them every year."
He said in southern Norway pollution was dominated by plastics from the home - but in Svalbard 80% of it comes from fishing activities, local and distant.
Surveys suggest that fishing crews are increasingly aware of their responsibilities now.
Jan Roger Lerbukt, manager of Hermes Fishing in Tromsø told me: "In the past 20 years I've seen a change in awareness in everyone towards protecting the environment.
"Fishing has been in our soul for thousands of years. If there's any environmental threat to the fish it's also a threat to our livelihood and that's a big concern.
"We have a reputation for a pure product and we don't want that damaged."
He agreed that trawler crews used to throw tangled nets overboard, but says they now they return them to harbour.
He says they also salvage plastic litter they catch, under a scheme called Fishing for Litter.
More and more crews are using paper packaging and moving away from plastic tape, he said.
But on a short walk along a plastic-strewn beach in Skulsfjord near Tromsø, I found clear evidence of fishing ropes still being deliberately cut.
And in the open water, "ghost nets" are easy to find.
Bo Eide, an environment consultant for Tromsø Council, conducts litter-picking on the beaches.
"People see the pictures in brochures of the pristine Arctic and they book their holidays to come here," he tells me.
"They're sometimes rather shocked to find that the Arctic in close-up is no longer how it looks in the brochures."
Norway's environment Minister Ola Elvestuen told BBC News: "It's disturbing - there's nowhere on Earth that's so far away that its not affected by plastics.
"This should be a call for action. It's been known about for years, but the magnitude of it hasn't been taken in as it should have been. We must stop the plastic pollution."
Researchers say there's been no systematic microplastics survey of all parts of the Arctic. They hope to compile an inventory, potentially with the help of "citizen scientists".

Plastic waste has been found everywhere that researchers have looked for it

Some of the fragments are very small

Scientists are worried about the impact all this waste is having on wildlife
___________________________
Plastic waste ‘building up’ in Arctic
February 10, 2018

Plastic waste is building up in the supposedly pristine wilderness of the Norwegian Arctic, scientists say…
https://coastalcare.org/2018/02/plastic-waste-building-up-in-arctic/
___________________________
Waste sorting to help release Arctic of plastic
June 09, 2021
Residents of Norilsk and Dudinka spoke about how they can help the environment.

https://thisistaimyr.org/news/waste-sorting-to-help-release-arctic-of-plastic/
___________________________
Even In The Remote Arctic, Plastic Pollution Is Building Up
February 9, 2018
Compiled by the Norwegian Polar Institute and presented at the Arctic Frontiers conference held this week, the scientists hope their finds will finally push politicians to do something and spur more research into the impact that plastics have on the Arctic ecosystem. Now, it seems the Norwegian government might be waking up to the problems we are facing.
“It's disturbing – there's nowhere on Earth that's so far away that its not affected by plastics,” Ola Elvestuen, Norway's environment Minister, told BBC News. “This should be a call for action. It's been known about for years, but the magnitude of it hasn't been taken in as it should have been. We must stop the plastic pollution.”

In some communities, the polar bears go through rubbish bags
The main source of plastics in the Arctic is actually from the fishing industry. It is estimated that around 80 percent of the plastics found in the icy waters has been thrown over the sides of boats or cut loose when nets have become entangled.
In many cases, this pollution becomes “ghost gear”, drifting through the sea and entangling marine creatures before being washed ashore. Even then, it can get caught in the antlers of reindeer and kill them. This is not to mention all the smaller pieces that are eaten by fish and birds that mistake the plastics for food...
https://www.iflscience.com/even-in-the-remote-arctic-plastic-pollution-is-building-up-46045
___________________________
Plastic Falls As Snow In The Arctic & Pollutes Deep Under Ice, Even With No Humans Around

For years we’ve dumped plastic into our oceans. Now we’re finding it in our fish, our salt, the rocks on our coast, the deepest parts of the ocean, even the North Pole. But based on a new study, it seems things might somehow be worse than we thought.
American researchers were studying the Arctic recently, investigating ice floes to look for plastic pollution. They went to what's probably the most remote place on Earth, hoping not to find any evidence of microplastics because there weren't any human around for hundreds of miles.
They were wrong.
The researchers were using helicopters to land on ice floes that were otherwise inaccessible. What they hoped to see then was pristine ice. Instead, what they found was worse than what they could have imagined. They came across so much microplastic that they could see the deposits in the ice with their naked eye...
___________________________
Report: the Baltic Sea binds five reports on plastics into one compilation, linked by location
16 Mar, 2020
Plasticus Mare Balticum is a compilation of five different reports with a common base: The Baltic Sea, the countries which border it, the plastics flowing into it, and the lives which are affected by it.
1. The marine plastic footprint.
2. Microplastic effect on frozen seas.
3. How microplastics may harm a range of important species, from bottom-of-the-food-chain invertebrates to apex predators.
4. An analysis of existing laws and the resulting suggestions for legislation and regulation to curb the effects of plastics in the Baltic.
5. An analysis inside businesses of levels of awareness, activism, responses, and incentives to the growing problems of plastics.
___________________________
This is how hundreds of tons of plastic trash end up in Arctic Ocean
May 2, 2017
___________________________
Quantification of plankton-sized microplastics in a productive coastal Arctic marine ecosystem
2020
https://www.sciencedirect.com/science/article/abs/pii/S0269749120338902
___________________________
Addressing Arctic pollution
https://arctic-council.org/explore/topics/pollutants/
___________________________
Toxic Nanoplastics Found at North and South Poles
Jan 21, 2022
There is increasing alarm about the extent of microplastic pollution, which has been found everywhere from Everest to the Arctic.
However, it turns out there’s an even smaller and more toxic form of plastic pollution infiltrating remote reaches of the globe. A new study published in Environmental Research found significant quantities of nanoplastics in ice samples from both the North and South Poles.
“Now we know that nanoplastics are transported to these corners of the Earth in these quantities. This indicates that nanoplastics is really a bigger pollution problem than we thought,” study lead author Dušan Materić of the Institute for Marine and Atmospheric research Utrecht (IMAU) said in a press release.
Nanoplastics are plastics that are smaller than a micrometer in size. Their small size means they are more difficult to study than microplastics, or plastics between five millimeters and a micrometer. But they may be even more dangerous.
“Nanoplastics are very toxicologically active compared to, for instance, microplastics, and that’s why this is very important,” Materić told The Guardian.
Materić and his team from Utrecht University, the University of Copenhagen and the Université Libre de Bruxelles used new methods to measure nanoplastic pollution in ice samples from Greenland and Antarctica, the press release explained. They sampled a 14-meter (approximately 46 foot) deep ice core from the Greenland ice cap and sea ice from Antarctica’s McMurdo Sound, according to The Guardian. They found that there were an average of 13.2 nanograms per milliliter of nanoplastics in the Greenland ice and an average of 52.3 nanograms per milliliter in the Antarctic ice, the study authors wrote.
But what was even more surprising than the amount of nanoplastics in the remote ice was just how long it had sat there.
“In the Greenland core, we see nanoplastics pollution happening all the way from 1960s. So organisms in that region, and likely all over the world, have been exposed to it for quite some time now,” Materić said in the press release.
The study also looked at the types of plastic present in the samples. Half of the Greenland nanoplastics were polyethylene (PE), the kind of plastic used for plastic bags and packaging, according to The Guardian. A quarter came from tires and a fifth were polyethylene terephthalate (PET), which is used for clothing and bottles. In Antarctica, there were no tire particles. Half were PE and polypropylene, which is used for food containers and pipes, was the next most common.
Researchers think the tiny plastics reached Greenland by traveling on the wind and Antarctica through ocean currents.
“Further studies are clearly needed to better constrain the source of theses contaminants to the polar regions,” Materić said in the press release.

Researchers have found nanoplastics in an ice core taken from Greenland’s ice cap.
https://www.ecowatch.com/nanoplastic-pollution-greenland-antarctica.html
___________________________
West Greenland’s plastic litter mostly comes from local sources, study finds
March 16, 2021
Just four out of nearly a thousand pieces of plastic with an identifiable origin turned out to be from outside Greenland.

Plastic and other light material blown from Greenland’s dumps are source of pollution. (Arctic DTU)
The vast majority of plastic that collects on Greenland’s western coast likely stems from local sources, a study of 300 kilograms of litter gathered during a 2019 clean-up has concluded.
Plastic litter is readily found on the Greenland coastline, despite its sparse population. This had led scientists to suspect that much of the litter was being transported on ocean currents from middle latitudes. But the findings that litter in western Greenland is mostly local is in line with the results of other clean-ups.
“Almost all litter was of local origin and consisted of everyday products used in local communities and settlements,” said Wouter Jan Strietman, of Wageningen University in the Netherlands, who led the study.
Litter poses numerous threats to marine life and can be indirectly consumed by people who rely on animals that ingest plastic. When it washes up on the shore, it’s a turnoff for would-be tourists.
[Scientist calls for international cooperation to reduce marine plastics]
Identifying the source of marine plastic is notoriously difficult. The sample of plastic studied after the four-day clean-up, which gathered a total of four tons of litter from Amerloq Fjord, near the town of Sisimiut, was able to determine the origin of 939 items. Of these, only four did not come from Greenland.
Most of the litter consisted of products used during outdoor activities such as fishing, hunting and boating, as well as food packaging and other forms of consumer waste.
Greenland-wide studies have suggested that ocean currents may prevent foreign litter from entering Baffin Bay and domestic litter from leaving. Higher rates of foreign litter have been found along Greenland’s eastern coast, as well as the waters around Iceland and Svalbard.
Here, monitoring has identified lost and discarded fishing gear as the most troublesome source of marine litter. Research also suggests that Russian rivers that empty into the Arctic Ocean may release huge amounts of plastic waste that eventually freezes into sea ice. Inadequate municipal sewage systems that dump untreated wastewater into fjords are a third area of concern.
[Tons of tire rubber is making its way to the Arctic each year, study suggests]
WWF, a conservancy that was involved in the 2019 collection, said it hoped the findings could be used to inform residents about the sources of plastic waste and to encourage them to take part in efforts to reduce waste.
“We need to act locally and come up with ways to make it easier for people to dispose of their litter properly that are suited to local conditions. But, at the same time, we also need work directly to change people’s attitudes and their behaviour,” Mette Frost, a WWF advisor on Greenland and the Arctic, said.
Jakob Strand, of Aarhus University, in Denmark, who was affiliated with the 2019 collection, has conducted his own studies in Greenland that have found a preponderance of consumer waste, but his work also indicates that people in Greenland are aware of plastic pollution.
Instead, he identified Greenland’s open dumps as a main source of plastic litter. Making a significant reduction, he said in comments during symposium about the issue last week, would be better waste-management in remote hamlets, where most waste is stored at open dumps until it can be incinerated.
“If local councils were more aware of the problem, it would help to reduce the amount of litter entering the water,” he said.
___________________________
Microplastics deposition in Arctic sediments of Greenland increases significantly after 1950
11 October 2024
Abstract
Marine sediments are archives of environmental change with pollutants potentially acting as chronographic markers of the Anthropocene. Particularly, the vertical transport and burial, as well as slow degradation rate of microplastics, indicate an eventual incorporation into the geological record. A high-resolution reconstruction of microplastics records requires high sedimentation rates, and in Disko Bay (Greenland), this quality coincides with a need for plastic pollution data. Here, a Greenlandic sediment core dated back to 1930 ± 2 was reconstructed for microplastics accumulation via micro-Fourier transform infrared spectroscopy. We show 85 years of fluctuating microplastics accumulation (987 − 16,645 particles Kg−1) down to 20 µm and diversified into eight polymers. Polyethylene (47%) and polypropylene (32%) were more abundantly present through time. Microplastics accumulation increases significantly after 1950 along with major socio-economic development in the area, suggesting an influence from regional stressors. Regional microplastics reconstructions must therefore be considered in the pursuit of an Anthropocene global plastic horizon.
https://www.nature.com/articles/s43247-024-01768-y
___________________________
Core samples from Greenland's seabed provide first historical overview of plastic pollution
21 March 2025
By coring the seabed at 850 m water depth in Disko Bay off Greenland's west coast, researchers from the University of Copenhagen have obtained the first historical record of plastic pollution in Greenland. The new data suggest a link to local socio-economic development and represent a step towards developing a common method for analyzing and mapping global microplastic pollution...
___________________________
Greenland rocks provide evidence of Earth formation process
November 8, 2012
Rocks
dating back 3.4 billion years from south-west Greenland's Isua mountain
range have yielded valuable information about the structure of the
Earth during its earliest stages of development. In these rocks, which
witnessed the first billion years of Earth's history researchers have
highlighted a lack of neodymium-142, an essential chemical element for
the study of the Earth's formation. This deficit supports the hypothesis
that between 100 and 200 million years after its formation, the Earth
was made up of an ocean of molten magma, which gradually cooled.
https://www.sciencedaily.com/releases/2012/11/121108073921.htm
___________________________
Greenland Rejects Huge Rare-Earth Mine in National Elections
April 7, 2021
The
Arctic island is a battleground of the future as companies and nations
vie to extract its massive deposits of the stuff needed to make F-35
fighter jets, electric cars and smartphones. In a crucial election,
Greenlanders voted for a party opposed to the construction of a massive
rare-earth mine.
https://www.courthousenews.com/greenland-rejects-huge-rare-earth-mine-in-national-elections/
___________________________
Geopolitics is making two rare earths mining projects in Greenland more complicated
March 3, 2021
https://www.arctictoday.com/how-geopolitics-is-complicating-two-greenland-rare-earths-mining-projects/
___________________________
Greenland Minerals seeks mine consultation with new government
2021
https://www.kallanish.com/en/news/power-materials/market-reports/article-details/rare-earth-greenland-minerals-seeks-mine-consultation-with-new-government-0421/
___________________________
‘Red-carded’ Australian miner signals intention to play on in Greenland
2021
https://news.mongabay.com/2021/07/red-carded-australian-miner-signals-intention-to-play-on-in-greenland/
___________________________
Boom in Mining Rare Earths Poses Mounting Toxic Risks
January 28, 2013
The mining of rare earth metals, used in everything from smart phones to
wind turbines, has long been dominated by China. But as mining of these
key elements spreads to countries like Malaysia and Brazil, scientists
warn of the dangers of the toxic and radioactive waste generated by the
mines and processing plants.
https://e360.yale.edu/features/boom_in_mining_rare_earths_poses_mounting_toxic_risks
___________________________
ISOTOPIC COMPOSITION AND CONCENTRATION OF PLUTONIUM IN BOTTOM SEDIMENTS OF THE GREENLAND AND NORWEGIAN SEAS
September 1999
https://www.researchgate.net/publication/263370549_ISOTOPIC_COMPOSITION_AND_CONCENTRATION_OF_PLUTONIUM_IN_BOTTOM_SEDIMENTS_OF_THE_GREENLAND_AND_NORWEGIAN_SEAS
___________________________
Natural
radionuclides and plutonium in sediments from the western Arctic Ocean:
Sedimentation rates and pathways of radionuclides
1997
https://www.semanticscholar.org/paper/Natural-radionuclides-and-plutonium-in-sediments-of-Huh-Pisias/717ed8ffb610c06b8886a4a91cc207b4fe38b6f3
___________________________
Radioecological investigations of plutonium in an arctic marine environment
1971
https://pubmed.ncbi.nlm.nih.gov/5559151/
___________________________
Levels and trends of radioactive contaminants in the Greenland environment
2004
https://www.academia.edu/81304402/Levels_and_trends_of_radioactive_contaminants_in_the_Greenland_environment
___________________________
Uranium and plutonium containing particles in a sea sediment sample from Thule, Greenland
2004
https://link.springer.com/article/10.1023/A:1010620123678
___________________________
A uranium exploration plan in Nunavut is drawing some concerns
July 11, 2022
https://www.arctictoday.com/a-uranium-exploration-plan-in-nunavut-is-drawing-some-concerns/
___________________________
Major uranium miner halts Greenland exploration amid ban discussion
May 18, 2021
https://www.arctictoday.com/major-uranium-miner-halts-greenland-exploration-amid-ban-discussion/
___________________________
Expert fears flooded radioactive dump sites could leak to river system that flows into Arctic Ocean
April 15, 2024
https://www.arctictoday.com/expert-fears-flooded-radioactive-dump-sites-could-leak-to-river-system-that-flows-into-arctic-ocean/
___________________________
Greenland offers to store old nuclear weapons
1997
https://nunatsiaq.com/stories/article/65674greenland_offers_to_store_old_nuclear_weapons/
___________________________
The US Army tried portable nuclear power at remote bases 60 years ago – it didn’t go well
August 7, 2021
Those in favor of mobile nuclear power for the battlefield claim it will provide "unlimited, low-carbon energy"
https://www.salon.com/2021/08/07/the-us-army-tried-portable-nuclear-power-at-remote-bases-60-years-ago--it-didnt-go-well_partner/
___________________________
Russia shuts down infamous site of nuclear disaster
Jan 14, 2003
MOSCOW — Russia has shut down a notorious, aging nuclear plant responsible for decades of environmental ruin in the Ural Mountains, a decision heralded Monday as an unexpected shift in how Moscow views dangers posed by nuclear waste.
Since the 1950s, the plant in Mayak, in central Russia, had been dumping radioactive waste into a nearby lake, contaminating drinking water for thousands of people. More than 40,000 Russians living in the villages and hamlets surrounding Mayak have been treated for the effects of radiation exposure in the last 10 years.
https://www.chicagotribune.com/news/ct-xpm-2003-01-14-0301140174-story.html
___________________________
Kyshtym disaster
https://en.wikipedia.org/wiki/Kyshtym_disaster
The
Kyshtym disaster, sometimes referred to as the Mayak disaster or
Ozyorsk disaster in newer sources, was a radioactive contamination
accident that occurred on 29 September 1957 at Mayak, a plutonium
production site for nuclear weapons and nuclear fuel reprocessing plant
located in the closed city of Chelyabinsk-40 (now Ozyorsk) in
Chelyabinsk Oblast, Russian SFSR, Soviet Union.
The disaster is
the third-worst nuclear incident (by radioactivity released) after the
Chernobyl disaster and the Fukushima Daiichi disaster. It measured as a
Level 6 disaster on the International Nuclear Event Scale (INES), making
it the third-highest on the INES (which ranks by population impact),
behind the Chernobyl disaster, which resulted in the evacuation of
335,000 people, and the Fukushima Daiichi disaster, which resulted in
the evacuation of 154,000 people; the Chernobyl disaster and the
Fukushima Daiichi disaster are both Level 7 disasters on the INES. At
least 22 villages were exposed to radiation from the Kyshtym disaster,
with a total population of around 10,000 people evacuated. Some were
evacuated after a week, but it took almost two years for evacuations to
occur at other sites.
The disaster spread hot particles over more
than 52,000 square kilometres (20,000 sq mi), where at least 270,000
people lived.[6] Since Chelyabinsk-40 (later renamed Chelyabinsk-65
until 1994) was not marked on maps, the disaster was named after
Kyshtym, the nearest known town.

Map of the East Urals Radioactive Trace (EURT): area contaminated by the Kyshtym disaster.
___________________________
Nyonoksa radiation accident
https://en.wikipedia.org/wiki/Nyonoksa_radiation_accident
The
Nyonoksa radiation accident, Arkhangelsk explosion or Nyonoksa
explosion occurred on 8 August 2019 near Nyonoksa, a village under the
administrative jurisdiction of Severodvinsk, Arkhangelsk Oblast, Russian
Federation. Five military and civilian specialists were killed and
three (or six, depending on the source) were injured.
Accident
The accident occurred at the State Central Navy Testing Range (Russian: Государственный центральный морской полигон) which is the main rocket launching site of the Russian Navy and is also called Nyonoksa.[12] According to the version presented by Russian officials, it was a result of a failed test of an "isotope power source for a liquid-fuelled rocket engine".[13][14][15] Nonproliferation expert Jeffrey Lewis and Federation of American Scientists fellow Ankit Panda suspect the incident resulted from a Burevestnik cruise missile test.[16][17] However, other arms control experts disputed the assertions: Ian Williams of the Center for Strategic and International Studies and James Acton of the Carnegie Endowment for International Peace expressed skepticism over Moscow's financial and technical capabilities to field the weapon,[18] while Michael Kofman of the Wilson Center concluded that the explosion was probably not related to Burevestnik but instead to the testing of another military platform.[19] According to CNBC, the Russians were trying to recover a missile from the seabed which was lost during a previously failed test.[20] No NOTAMs were filed prior to the explosion to warn pilots of a possible missile test.[9] In the past, the residents of Nyonoksa had been warned and evacuated prior to the missile tests.[9] Also, two Russian special purpose ships were at the Nyonoksa test range when the explosion occurred: the Serebryanka (Rosatom Flot vessel used for handling nuclear waste from nuclear reactors) and the Zvezdochka (used for underwater salvage operations and is equipped with two heavy lift sea cranes and two remotely operated vehicles).[9][10][17]
An event of explosive nature was registered on 8 August at 06:00 UTC (local time 09:00) at the infrasound station in Bardufoss (Troms, Norway). As the event was also registered on seismic data, it must have been coupled to the ground, meaning that it took place either at the ground or in contact with it; for example on water. The timing and location of the event coincides with the reported accident in Archangelsk.[21] Several fishermen stated on sanatatur.ru that they witnessed the accident: one saw a 100-meter column of water rise into the air after the explosion and another saw a large hole in the side of a ship which had been at the site of the explosion.
___________________________
Nuclear lighthouses built by the Soviets in the Arctic [video]
Jan 7, 2021
In the village of Lia, Georgia, on December 2, 2001, Three lumberjacks discovered two 90Sr cores from Soviet radioisotope thermoelectric generators. These were of the Beta-M type, built in the 80s, with an activity of 1295 TBq each. The lumberjacks were scavenging the forest for firewood, when they came across two metal cylinders melting snow within a one meter radius laying in the road. They picked up these objects to use as personal heaters, sleeping with their backs to them. All lumberjacks sought medical attention individually, and were treated for radiation injuries. One patient, DN-1, was seriously injured and required multiple skin grafts. After 893 days in the hospital, he was declared dead after a fever caused by complications and infections of a radiation ulcer on the subject's back. The disposal team consisted of 25 men who were restricted to a maximum of 2 minutes worth of exposure (max. 20mSv) each while transferring the canisters to lead-lined drums
https://news.ycombinator.com/item?id=25677144
___________________________
Russia removed radioactive lighthouses from Arctic coast
November 11, 2008
https://barentsobserver.com/en/node/20900
___________________________
Russian nuclear power plant afloat in Arctic causes anxiety across Bering Strait
August 9, 2019
https://www.ktoo.org/2019/08/09/russian-nuclear-power-plant-afloat-in-arctic-causes-anxiety-across-bering-strait/
___________________________
Developers plan several more floating reactors for Russia’s East Arctic coast
March 1, 2021
https://www.arctictoday.com/developers-plan-several-more-floating-reactors-for-russias-east-arctic-coast/
___________________________
Sellafield plutonium 'lost' over 40 years
22 Apr 1999
More
than a third of the plutonium pumped into the Irish Sea from Sellafield
nuclear plant in Cumbria over the past 40 years is missing, scientists
working for the ministry of agriculture have disclosed.
Since a
tiny speck of plutonium inhaled is enough to trigger cancer, scientists
are anxious to explain the disappearance of more than 60kg, which they
had expected to find in sea sediments.
A research project lasting
years and taking samples all over the Irish Sea and beyond, should have
enabled scientists to plot the distribution of plutonium and americium,
a radioactive particle that plutonium changes into when it decays.
About 40% of the americium was missing too.
https://www.theguardian.com/uk/1999/apr/23/paulbrown
___________________________
Blast at Russian missile testing site: Radiation levels up to 16 times the norm at nearby town, says country's weather service
August 13, 2019
https://www.firstpost.com/world/blast-at-russian-missile-testing-site-radiation-levels-up-to-16-times-the-norm-at-nearby-town-says-countrys-weather-service-7158871.html
___________________________
How The Russian Navy Disposed Of 100 Nuclear Submarines | The End Of Red October | Timeline
Feb 8, 2022
https://www.youtube.com/watch?v=ZZIReklSaL4
___________________________
Russian Nuclear Sub Wreck's Radiation 100K Higher Than Normal, Scientists Say
July 10, 2019
Norwegian
scientists have discovered radiation levels 100,000 times higher than
normal near a Soviet-era nuclear submarine that sank 30 years ago in the
Arctic, Norway’s TV2 broadcaster reported Tuesday.
The
Komsomolets sank in a section of the Barents Sea considered to be one of
the world's largest fishing areas in 1989, killing 42 of its 69 crew.
Concerns about contamination from its nuclear reactor have not yet given
way to an actual environmental crisis, and readings taken as recently
as 2008 have shown no indication of a radiation leak...
https://www.themoscowtimes.com/2019/07/10/russian-nuclear-sub-wrecks-radiation-100k-higher-than-normal-scientists-say-a66341
___________________________
Soviet-era submarine is emitting radiation at levels 800,000 times above normal, Norway says
July 12, 2019
Two nuclear warheads and a nuclear reactor remain on board the defunct 400-foot-long submarine
https://calgaryherald.com/news/world/soviet-era-submarine-is-emitting-radiation-at-levels-800000-times-above-normal-norway-says/wcm/4cfffcf8-b082-4d65-b952-df8e70fa132f/
___________________________
Tackling dumped nuclear waste gets priority in Russia’s Arctic Council leadership
May 26, 2021
https://www.arctictoday.com/tackling-dumped-nuclear-waste-gets-priority-in-russias-arctic-council-leadership/
___________________________
Russia’s Push To Mine Arctic Metals Is Fueled By Nuclear Power
Dec 04, 2021
https://oilprice.com/Energy/Energy-General/Russias-Push-To-Mine-Arctic-Metals-Is-Fueled-By-Nuclear-Power.html
___________________________
Russia Finally Admitted the Radiation Cloud Over Europe Is Real
2017
They acknowledged "extremely high contamination" above the Ural
It's Confirmed
In September 2017, multiple monitoring agencies detected an unusual amount of radiation hovering over much of Europe. Several European nations suggested that the source of the radiation cloud might have been Russia. Meanwhile, Russian authorities denied even detecting the cloud — until now.
On November 21, Russian meteorological services agency Roshydromet corroborated the findings of the French Institute for Radiation Protection and Nuclear Safety (IRNS), one of the monitoring agencies that first spotted the elevated levels of ruthenium-106, the radioactive isotope of the rare heavy metal ruthenium.
On November 9, the IRNS said that it had detected ruthenium-106 over France from September 27 to October 13 at levels of a few milliBecquerels per cubic meter of air. Their measurements pointed to a potential source of the radiation cloud as being somewhere between the Volga and the Urals, a Russian river and mountain range, respectively.

https://futurism.com/russia-finally-admitted-radiation-cloud-over-europe-real
___________________________
ROAMING RADIATION Mysterious ‘nuclear’ radiation spike over Europe detected and Russia could be to blame
29 Jun 2020

A MYSTERIOUS spike in radiation levels has been detected over northern Europe and no one has claimed responsibility.
Several European authorities have revealed readings of an increase in human-made radionuclide particles in the atmosphere...
https://www.thesun.co.uk/tech/11978579/mysterious-nuclear-radiation-spike-europe/
___________________________
Soviet atomic bomb project
https://en.wikipedia.org/wiki/Soviet_atomic_bomb_project
___________________________
Shallow
Permafrost at the Crystal Site of Peaceful Underground Nuclear
Explosion (Yakutia, Russia): Evidence from Electrical Resistivity
Tomography
3 January 2022
https://www.semanticscholar.org/paper/Shallow-Permafrost-at-the-Crystal-Site-of-Peaceful-Artamonova-Shein/b650d686d602b0e80b34152ff4ad9a56ae534468
___________________________
Investigation
of the tritium content in surface water, bottom sediments (zoobenthos),
macrophytes, and fish in the mid-stream region of the Yenisei River
(Siberia, Russia)
2015 Jul 16
https://pubmed.ncbi.nlm.nih.gov/26178837/
___________________________
SPREADING OF TRITIUM IN SURFACE WATER OF THE SITE OF THE PEACEFUL UNDERGROUND NUCLEAR EXPLOSION «CRYSTAL» IN 2018
2019
https://www.semanticscholar.org/paper/SPREADING-OF-TRITIUM-IN-SURFACE-WATER-OF-THE-SITE-Artamonova/c25db9310c15190ced7cb6b6947ebc9bfd501c6b
___________________________
High-altitude nuclear explosion
High-altitude nuclear explosions are the result of nuclear weapons testing within the upper layers of the Earth's atmosphere and in outer space. Several such tests were performed at high altitudes by the United States and the Soviet Union between 1958 and 1962.
The Partial Test Ban Treaty was passed in October 1963, ending atmospheric and exoatmospheric nuclear tests. The Outer Space Treaty of 1967 banned the stationing of nuclear weapons in space, in addition to other weapons of mass destruction. The Comprehensive Nuclear-Test-Ban Treaty of 1996 prohibits all nuclear testing; whether over- or underground, underwater or in the atmosphere, but hasn't entered into force yet as it hasn't been ratified by some of the states party to the Treaty.
https://en.wikipedia.org/wiki/High-altitude_nuclear_explosion
___________________________
Russia is scrapping its ratification of a key nuclear test ban. Here's what that means
October 17, 2023
https://www.npr.org/2023/10/17/1206114320/russia-is-scrapping-its-ratification-of-a-key-nuclear-test-ban-heres-what-that-m
___________________________
Scientists warn missing Russian data causing Arctic climate blind spots
January 22, 2024
https://phys.org/news/2024-01-scientists-russian-arctic-climate.html
___________________________
Distribution of radionuclides in moss-lichen cover and needles on the same grounds of landscape-climatic zones of Siberia
2018 Dec 25
https://pubmed.ncbi.nlm.nih.gov/30592996/
___________________________
New data on the content of tritium in a tributary of the Yenisei River
2002
https://pubmed.ncbi.nlm.nih.gov/12474805/
___________________________
Environmental Damage and Policy Issues in the Uranium & Gold Mining Districts of Chita Oblast in the Russian Far East
November 8, 1996
http://www.sric.org/mining/docs/chitafin.php
___________________________
REE,
Uranium (U) and Thorium (Th) contents in Betula pendula leaf growing
around Komsomolsk gold concentration plant tailing (Kemerovo region,
Western Siberia, Russia)
2016
https://iopscience.iop.org/article/10.1088/1755-1315/43/1/012053/pdf
___________________________
New
data on the level of contamination with tritium aerosol fallout in the
nearest influence zone of the mining–chemical combine of the Rosatom
State Corporation
2014
https://www.deepdyve.com/lp/springer-journals/new-data-on-the-level-of-contamination-with-tritium-aerosol-fallout-in-s2RQF7H61w
___________________________
Uranium, thorium, and potassium in black shales of the Bazhenov Formation of the West Siberian marine basin
05 January 2016
https://link.springer.com/article/10.1134/S0024490216010077
___________________________
Uranium and thorium contents in soils and bottom sediments of lake Bolshoye Yarovoye, western Siberia
2019
https://www.sciencedirect.com/science/article/abs/pii/S0265931X19304680
___________________________
Investigation
of the tritium content in surface water, bottom sediments (zoobenthos),
macrophytes, and fish in the mid-stream region of the Yenisei River
(Siberia, Russia)
16 July 2015
https://link.springer.com/article/10.1007/s11356-015-5042-1
___________________________
Perhaps World’s Largest Methane Leak Traced to Russian Coal Mine
June 18, 2022
https://www.ecowatch.com/methane-leak-russia-coal-mine.html
___________________________
Nornickel: Russia probes new pollution at Arctic mining firm
29 June 2020
https://www.bbc.com/news/world-europe-53218708
___________________________
A Manmade Volcano over Norilsk
July 12, 2017
In
global satellite observations of sulfur dioxide (SO2), several sources
of the polluting gas stand out. Dozens of volcanoes spit out plumes of
it during explosive and effusive eruptions; the gas also seeps more or
less continuously from dozens of other volcanoes that are not actively
erupting in a process scientists call passive degassing. And nearly 300
coal-fired powered plants, dozens of gas and oil sites, and more than 50
smelting facilities emit streams of sulfur dioxide large enough to be
detected from space.
But of all the manmade (anthropogenic)
sources, one location really sticks out: Norilsk. This industrial city
of 175,000 people in northern Siberia has several mines that tap into
one of the largest nickel, copper, platinum, and palladium deposits on
Earth. And all of the smelting—the extraction of usable metal from ore
by grinding it up and melting it—that happens there has made it into one
of the largest sources of sulfur dioxide detectable by satellites.
https://earthobservatory.nasa.gov/images/92246/a-manmade-volcano-over-norilsk
___________________________
Russian metals firm admits spillage turned river blood red
12 Sep 2016
Norilsk
Nickel insists the temporary problem will not affect people or
wildlife, but environmental activists say it is too early to tell
https://www.theguardian.com/world/2016/sep/12/russian-metals-firm-admits-spillage-turned-river-blood-red
___________________________
One of the Most Polluted Places on Earth Is in the Russian Arctic
04/12/2021
https://science.thewire.in/external-affairs/world/one-of-the-most-polluted-places-on-earth-is-in-the-russian-arctic/
___________________________
In Russia, Coal Is Still King. And The Government Wants Even More.
December 02, 2021
https://www.rferl.org/a/russia-coal-mining-environment-safety/31590889.html
___________________________
Russia’s new lithium mine will harm Arctic ecosystems and Indigenous people, Sámi activist warns
June 14, 2022
https://www.arctictoday.com/russias-new-lithium-mine-will-harm-arctic-ecosystems-and-indigenous-people-sami-activist-warns/
___________________________
Russia’s Rosatom Plans to Launch Lithium Mines in Siberia, Arctic
August 5, 2021
https://www.e-mj.com/breaking-news/russias-rosatom-plans-to-launch-lithium-mines-in-siberia-arctic/
___________________________
Climate change: Arctic's unknown viruses' and nuclear waste
30 September 2021
https://www.bbc.com/news/uk-wales-58724710
___________________________
Trace seabed plutonium points to stellar forges of heavy elements
13 May 2021
Ocean sediments suggest both supernovae and merging neutron stars are chemical factories
https://www.science.org/content/article/trace-seabed-plutonium-points-stellar-forges-heavy-elements
___________________________
Moscow Innovates Supercritical CO2 for Uranium, Plutonium Separation
11 August 2003
https://www.innovations-report.com/life-sciences/report-20463/
___________________________
The
decision making criteria on radiation protection of population in the
cases of an accidental plutonium dispersion into environment
https://www.irpa.net/irpa10/cdrom/00839.pdf
___________________________
Plutonium in the atmosphere: A global perspective
2017
https://www.sciencedirect.com/science/article/abs/pii/S0265931X17301200
___________________________
Plutonium Isotopes Research in the Marine Environment: A synthesis
2020
http://www.radiochem.org/en/paper/JN201/jn20101.pdf
___________________________
Plutonium research to aid nuclear cleanup techniques
2017
"What makes this discovery so interesting is that the material -- rather than being really complicated and really exotic -- is really, really simple," said chemist Thomas Albrecht-Schmitt.
https://www.upi.com/Science_News/2017/05/08/Plutonium-research-to-aid-nuclear-cleanup-techniques/7961494266901/
___________________________
Plutonium in the Deep Layers of the Norwegian and Greenland Sea
1998
https://www.deepdyve.com/lp/oxford-university-press/plutonium-in-the-deep-layers-of-the-norwegian-and-greenland-sea-QyTKIF1ItS
___________________________
Hidden in caves: Mineral overgrowths reveal unprecedented modern sea-level rise
https://www.eurekalert.org/news-releases/957554
___________________________
Arctic Climate Change: Local Impacts, Global Consequences, and Policy Implications
15 November 2019
https://link.springer.com/chapter/10.1007/978-3-030-20557-7_31
___________________________
Uranium mining
https://en.wikipedia.org/wiki/Uranium_mining
___________________________
Radioisotope constraints of Arctic deep water export to the North Atlantic
16 June 2021
Abstract
The export of deep water from the Arctic to the Atlantic contributes to the formation of North Atlantic Deep Water, a crucial component of global ocean circulation. Records of protactinium-231 (231Pa) and thorium-230 (230Th) in Arctic sediments can provide a measure of this export, but well-constrained sedimentary budgets of these isotopes have been difficult to achieve in the Arctic Ocean. Previous studies revealed a deficit of 231Pa in central Arctic sediments, implying that some 231Pa is either transported to the margins, where it may be removed in areas of higher particle flux, or exported from the Arctic via deep water advection. Here we investigate this “missing sink” of Arctic 231Pa and find moderately increased 231Pa deposition along Arctic margins. Nonetheless, we determine that most 231Pa missing from the central basin must be lost via advection into the Nordic Seas, requiring deep water advection of 1.1 – 6.4 Sv through Fram Strait.
https://www.nature.com/articles/s41467-021-23877-4
___________________________
The Arctic Ocean might have been filled with freshwater during ice ages
03 February 2021
https://www.nature.com/articles/d41586-021-00208-7
___________________________
Antarctic climate signature in the Greenland ice core record
October 30, 2007
https://www.pnas.org/doi/10.1073/pnas.0708494104
___________________________
Arctic river-runoff: mean residence time on the shelves and in the halocline
1994
Abstract
The mean residence time of river-runoff on the shelves and in the halocline of the Arctic Ocean is estimated from salinity and tracer data (tritium, 3He and the 18O/16O ratio). These estimates are derived from comparison of apparent tracer ages of the halocline waters using a combination of tracers that yield different information: (1) the tritium "vintage" age, which records the time that has passed since the river-runoff entered the shelf; and (2) the tritium/3He age, which reflects the time since the shelf waters left the shelf. The difference between the ages determined by these two methods is about 3-6 years. Correction for the initial tritium/3He age of the shelf waters (about 0.5-1.5 years) yields a mean residence time of the river-runoff on the shelves of the Siberian Seas of about 3.5 ± 2 years.
___________________________
Global Seawater Oxygen-18 Database
https://data.giss.nasa.gov/o18data/ref.html
___________________________
Is there a 230Th deficit in Arctic sediments?
2007
https://www.sciencedirect.com/science/article/abs/pii/S0012821X07002269
___________________________
Sources and variation of isotopic ratio of airborne radionuclides in Western Arctic lichens and mosses
2019
Abstract
This research concerned radioactivity of lichens and mosses from coastal zones of the Canadian Arctic and Alaska. Over 50 samples were collected from 7 positions during two scientific expeditions in 2012 and 2013. The tundra contamination caused by anthropogenic radionuclides was relatively low, reaching mean values with SD's of: 17.4 ± 3.5 Bq/kg for 90Sr, 14.0 ± 2.9 Bq/kg for 134Cs, 38.4 ± 7.5 Bq/kg for 137Cs, 0.86 ± 0.24 Bq/kg for 239+240Pu, 0.065 ± 0.017 Bq/kg for 238Pu and 0.50 ± 0.13 Bq/kg for 241Am. The increase of activity concentration with increasing latitudes was noticed mostly in regard to 90Sr, Pu isotopes and 241Am. The analysis of isotopic ratios exhibited dominant contribution of the global fallout (+SNAP 9A satellite re-entry fallout) for the presence of plutonium isotopes and 241Am. The Fukushima fallout signature was identified in a few lichens from Alaska. However, the influence of additional unknown factor on the occurrence of 90Sr and 137Cs has been detected in western part of Canadian Arctic. Natural radioisotopes of thorium and uranium were found throughout the entire investigated region and the average values of activity concentration with SD's were as follows: 2.92 ± 0.47 Bq/kg for 230Th, 2.61 ± 0.48 Bq/kg for 232Th, 4.32 ± 0.80 Bq/kg for 234U and 3.97 ± 0.71 Bq/kg for 238U. Examined Western Arctic tundra was not affected with any technically enhanced natural radioactivity.
https://pubmed.ncbi.nlm.nih.gov/31726517/
___________________________
Radioisotope constraints of Arctic deep water export to the North Atlantic
2001
The export of deep water from the Arctic to
the Atlantic contributes to the formation of North Atlantic Deep Water,
a crucial component of global ocean circulation. Records of
protactinium-231 (231Pa) and thorium-230 (230Th) in Arctic sediments can
provide a measure of this export, but well-constrained sedimentary
budgets of these isotopes have been difficult to achieve in the Arctic
Ocean. Previous studies revealed a deficit of 231Pa in central Arctic
sediments, implying that some 231Pa is either transported to the
margins, where it may be removed in areas of higher particle flux, or
exported from the Arctic via deep water advection. Here we investigate
this “missing sink” of Arctic 231Pa and find moderately increased 231Pa
deposition along Arctic margins. Nonetheless, we determine that most
231Pa missing from the central basin must be lost via advection into the
Nordic Seas, requiring deep water advection of 1.1 – 6.4 Sv through
Fram Strait.
https://academiccommons.columbia.edu/doi/10.7916/4tkn-j497
___________________________
The Arctic wasteland: a perspective on Arctic pollution
27 October 2009
https://www.cambridge.org/core/journals/polar-record/article/abs/arctic-wasteland-a-perspective-on-arctic-pollution/64EB0BA39BA6CCAF7A86EAB7842DAB56
___________________________
Contamination from Nuclear Wastes in the Arctic and North Pacific
1995
Although popular perceptions of the Arctic might characterize it as a pristine
area, it has become increasingly clear that this important ecosystem has not
avoided the effects of industrialization and development. Evidence of
contamination by persistent organic pollutants, heavy metals, and
radioactivity has been gathered since the 1950sbut has not garnered a great
deal of public attention. However, in the last three years a tremendous
amount of attention has been directed toward assessing the extent of,
and identifying possible remedies to, the environmental contamination
problem in the Arctic from Russian nuclear sources. Although the activities
of several different countries have released radionuclides into the Arctic
environment for decades, news of ocean dumping of submarine reactors
and nuclear wastes by the former Soviet Union has generated particular
interest and concern because it revealed previously secret activities
and enhanced the traditional public fear of radioactivity. This chapter
analyzes available information about the wastes dumped in the Arctic and
North Pacific, what is known of their contribution to contamination of
the marine environment, and the research efforts needed to address unanswered
questions.


https://www.princeton.edu/~ota/disk1/1995/9504/950404.PDF
___________________________
US B-52 nuclear bomber crash in Greenland 51 years ago has ill Danes seeking compensation
June 3, 2019
https://www.foxnews.com/us/us-b-52-nuclear-bomber-crash-in-greenland-51-years-ago-has-ill-danes-seeking-compensation
___________________________
Uranium and Selected Trace Elements in Granites from the Caledonides of East Greenland
1982
https://www.academia.edu/27445443/Uranium_and_Selected_Trace_Elements_in_Granites_from_the_Caledonides_of_East_Greenland
___________________________
Characterization
of uranium and plutonium containing particles originating from the
nuclear weapons accident in Thule, Greenland, 1968
2004
https://www.sciencedirect.com/science/article/abs/pii/S0265931X04003297
___________________________
Hudson’s Greenland REE project unaffected by uranium ban
16th November 2021
https://www.miningweekly.com/article/hudsons-greenland-ree-project-unaffected-by-uranium-ban-2021-11-16
___________________________
After 25 Years, Uranium Mining Is Allowed In Greenland
October 28, 2013
Last
week the parliament passed the measure by one vote, overturning a ban
implemented by the country's former colonial ruler and creating a
potentially radical shift in the rare earths market.
https://bigthink.com/surprising-science/after-25-years-uranium-mining-is-allowed-in-greenland/
___________________________
Too Hot to Handle: The Controversial Hunt for Uranium in Greenland in the Early Cold War
21 June 2013
https://onlinelibrary.wiley.com/doi/abs/10.1111/1600-0498.12020
___________________________
Canadian geologist raises questions about controversial Greenland mining project
January 8, 2021
https://www.rcinet.ca/eye-on-the-arctic/2021/01/08/canadian-geologist-raises-questions-about-controversial-greenland-mining-project/
___________________________
Greenland Minerals begins strategic review post Greenland uranium ban
24 Jan 2022
Greenland
Minerals is moving to expand geographical exposure in its assets and
diversify its revenue-generating opportunities as it seeks to build a
critical metals supply chain.
https://www.proactiveinvestors.com/companies/news/972044/greenland-minerals-begins-strategic-review-post-greenland-uranium-ban-972044.html
___________________________
Greenland and Denmark to agree on uranium in 2014
January 8, 2014
An
agreement between Greenland and Denmark governing uranium extraction in
the Arctic territory will be in place by the end of the year, the
Danish prime minister said on Wednesday.
https://phys.org/news/2014-01-greenland-denmark-uranium.html
___________________________
Greenland, Denmark and the pathway to uranium supplier status
2014
https://www.sciencedirect.com/science/article/abs/pii/S2214790X14000690
___________________________
French nuclear giant Orano obtains uranium exploration permits in Greenland
January 27, 2021
https://www.kitco.com/news/2021-01-27/French-nuclear-giant-Orano-obtains-uranium-exploration-permits-in-Greenland.html
___________________________
Uranium mining ban reinstated in Greenland
November 11, 2021
https://www.greenleft.org.au/content/uranium-mining-ban-reinstated-greenland
___________________________
Greenland Search for Uranium Approved
2021
https://polarjournal.ch/en/2021/02/01/greenland-search-for-uranium-approved/
___________________________
Greenland is divided over uranium mining
27. May 2016
GREENLAND:
The question of mining activities has divided Greenlanders into two
camps, and the desire for a referendum on the subject is increasing, say
researchers.
https://sciencenordic.com/democracy-denmark-greenland-science-special/greenland-is-divided-over-uranium-mining/1433763
___________________________
Greenland says yes to mining but no to uranium
May 7, 2021
Friday
23 April 2021, a new government resumed their seats. The government is
formed by the two parties Inuit Ataqatigiit (IA) and Partii Naleraq. New
minister for the mineral resources area is Naaja Nathanielsen, who has
been a number of Parliament in the years 2009-2016, including being
chair of the Parliament Committee for Mineral Resources and Finances.
Naaja Nathanielsen has been director of the Greenlandic Department of
Prisons and Probation since 2016.
The mineral resources area is
very important for the new government in order to diversify the
Greenlandic economy to the benefit of all. The government is very keen
to see all types of mining projects progress, except uranium. In
relation to uranium, the government has already started the work on
formulating regulation for the future relation to exploitation of
resources containing radioactive elements.
https://govmin.gl/2021/05/greenland-says-yes-to-mining-but-no-to-uranium/
___________________________
Plutonium in lichen communities of the Thule, Greenland region during the summer of 1968
1972
https://pubmed.ncbi.nlm.nih.gov/5012295/
___________________________
Pollution of Russian Northern Seas with Heavy Metals: Comparison of Atmospheric Flux and River Flow
24 December 2019
https://link.springer.com/article/10.1134/S0001433819070119
___________________________
Trace
metals in surface sediments from the Laptev and East Siberian Seas:
Levels, enrichment, contamination assessment, and sources
September 2021
https://www.researchgate.net/publication/354950836_Trace_metals_in_surface_sediments_from_the_Laptev_and_East_Siberian_Seas_Levels_enrichment_contamination_assessment_and_sources
___________________________
Methanogenic
communities in permafrost-affected soils of the Laptev Sea coast,
Siberian Arctic, characterized by 16S rRNA gene fingerprints
01 February 2007
https://academic.oup.com/femsec/article/59/2/476/553776?login=false
___________________________
Threshold in North Atlantic-Arctic Ocean circulation controlled by the subsidence of the Greenland-Scotland Ridge
2017 Jun 5
https://www.ncbi.nlm.nih.gov/pmc/articles/PMC5465373/
___________________________
Evidence for oldest microbes from Arctic Canada
April 21, 2022
https://theorkneynews.scot/2022/05/24/evidence-for-oldest-microbes-from-arctic-canada/
___________________________
Elemental composition and bacterial occurrence in sediment samples on two sides of Brøggerhalvøya, Svalbard
03 February 2015
https://www.cambridge.org/core/journals/polar-record/article/abs/elemental-composition-and-bacterial-occurrence-in-sediment-samples-on-two-sides-of-broggerhalvoya-svalbard/12780E170F4637F8756483A60FE7DFE8
___________________________
Source apportionment of methane escaping the subsea permafrost system in the outer Eurasian Arctic Shelf
March 1, 2021
https://www.pnas.org/doi/10.1073/pnas.2019672118
___________________________
The effect of long-range atmospheric transport of organochlorine compounds by soil studies from Mongolia to the Arctic
February 2016
https://ui.adsabs.harvard.edu/abs/2016DokES.466..169M/abstract
___________________________
Abandoned Greenland: three old settlements that became ghost towns
June 5, 2017
https://www.abandonedspaces.com/uncategorized/abandoned-greenland.html?firefox=1
___________________________
Pervasive distribution of polyester fibres in the Arctic Ocean is driven by Atlantic inputs
12 January 2021
Abstract
Microplastics are increasingly recognized as ubiquitous global contaminants, but questions linger regarding their source, transport and fate. We document the widespread distribution of microplastics in near-surface seawater from 71 stations across the European and North American Arctic - including the North Pole. We also characterize samples to a depth of 1,015 m in the Beaufort Sea. Particle abundance correlated with longitude, with almost three times more particles in the eastern Arctic compared to the west. Polyester comprised 73% of total synthetic fibres, with an east-to-west shift in infra-red signatures pointing to a potential weathering of fibres away from source. Here we suggest that relatively fresh polyester fibres are delivered to the eastern Arctic Ocean, via Atlantic Ocean inputs and/or atmospheric transport from the South. This raises further questions about the global reach of textile fibres in domestic wastewater, with our findings pointing to their widespread distribution in this remote region of the world.
https://www.nature.com/articles/s41467-020-20347-1
___________________________
A Recent Study Illustrates Actual Extent of Damage from Arctic Pollution
Sep 25, 2020
https://www.sciencetimes.com/articles/27462/20200925/recent-study-illustrates-actual-extent-damage-arctic-pollution.htm
___________________________
Arctic pollution's surprising history
March 19, 2008
https://phys.org/news/2008-03-arctic-pollution-history.html
___________________________
Microplastics distribution in the Eurasian Arctic is affected by Atlantic waters and Siberian rivers
03 February 2021
https://www.nature.com/articles/s43247-021-00091-0
___________________________
The global threat from plastic pollution
2 Jul 2021
https://www.science.org/doi/10.1126/science.abg5433
___________________________
The Ocean's Foul, Plastic Garbage Has Finally Reached the Arctic
October 23, 2015
https://www.bloomberg.com/news/articles/2015-10-23/a-sixth-huge-garbage-patch-appears-to-be-forming-in-the-barents-sea
___________________________
Microplastics in the Arctic Environment: A Global Plastic Problem
The ugly truth is that plastics have reached every corner of the Earth — including the Arctic
Feb 3, 2021
https://medium.com/climate-conscious/microplastics-in-the-arctic-environment-a-global-plastic-problem-ad236bbd2101
___________________________
Microplastics found in waters off Svalbard
October 15, 2015
https://barentsobserver.com/en/nature/2015/10/microplastics-found-waters-svalbard-15-10
___________________________
Plastic litter taints the sea surface, even in the Arctic
October 22, 2015
For the first time, researchers survey litter on sea surface at such high latitudes
https://www.sciencedaily.com/releases/2015/10/151022111337.htm
___________________________
Report reveals high levels of microplastics on Norway's Arctic coast
December 11, 2017
https://thebarentsobserver.com/en/node/3311
___________________________
Toxic Effects of Microplastics on Culture Scenedesmus quadricauda: Interactions between Microplastics and Algae
04 March 2022
https://link.springer.com/article/10.3103/S0096392521040076
___________________________
Plastic pollution and potential solutions
2018 Jul 19
https://pubmed.ncbi.nlm.nih.gov/30025551/
___________________________
Arctic birds, seals and reindeer killed by marine plastics; pollution expected to rise
2018
https://www.abc.net.au/news/2018-02-09/marine-plastics-killing-arctic-creatures/9417270
___________________________
Plastic ingestion by four seabird species in the Canadian Arctic: Comparisons across species and time
2020 Jun 18
https://pubmed.ncbi.nlm.nih.gov/32568085/
___________________________
Plastic ingestion by Arctic fauna: A review
2021
https://www.sciencedirect.com/science/article/pii/S004896972102533X
___________________________
Microplastics from laundry are flooding into the Arctic
Jan 12, 2021
https://www.theverge.com/2021/1/12/22226655/microplastics-laundry-wastewater-plastic-pollution-arctic-ocean
___________________________
Microplastics found across the Arctic may be fibres from laundry
12 January 2021
https://www.newscientist.com/article/2264585-microplastics-found-across-the-arctic-may-be-fibres-from-laundry/
___________________________
Plastic ingestion by juvenile polar cod (Boreogadus saida) in the Arctic Ocean
20 February 2018
https://link.springer.com/article/10.1007/s00300-018-2283-8
___________________________
Arctic garbage patch
25 April 2017
Trillions of small pieces of floating plastic are coagulating in remote waters near the frozen north.
https://www.natureasia.com/en/nmiddleeast/article/10.1038/nmiddleeast.2017.75
___________________________
Plastic pollution threatens salmon, whales and people
October 4, 2021
https://www.raincoast.org/2021/10/plastic-pollution-threatens-salmon-whales-and-people/
___________________________
Ocean Plastic Pollution—and Solutions to This Problem—Can Come in Many Forms
May 18, 2020
Innovation, collaboration, and bold policies can stop the flow and help restore marine health
https://www.pewtrusts.org/en/research-and-analysis/articles/2020/05/18/ocean-plastic-pollution-and-solutions-to-this-problem-can-come-in-many-forms
___________________________
Plastic crisis in Arctic: Pollution just as bad as anywhere else on Earth, scientists warn
April 17, 2022
https://www.studyfinds.org/microplastics-plastic-pollution-arctic/
___________________________
The Arctic is filling up with plastic pollution
April 5, 2022
https://plastic.education/the-arctic-is-filling-up-with-plastic-pollution/
___________________________
Plastics in the Arctic
https://www.arctic-council.org/explore/topics/ocean/plastics/
___________________________
Why does the Arctic have more plastic than most places on Earth?
October 30, 2019
Plastics
travel on ocean currents and through the air to the far north and
accumulate—sometimes inside the animals that live there.
https://www.nationalgeographic.com/science/article/remote-arctic-contains-more-plastic-than-most-places-on-earth
___________________________
Plastic polluted Arctic islands are dumping ground for Gulf Stream
2017
Beaches
in the remote Arctic islands were found to be more polluted than
European ones due to plastic carried from much further south
https://www.theguardian.com/environment/2017/jun/16/plastic-polluted-arctic-islands-are-dumping-ground-for-gulf-stream
___________________________
Ocean Currents Are Sweeping Billions of Tiny Plastic Bits to the Arctic
April 21, 2017

Microplastics mixed in with plankton from an Arctic Ocean sample
https://www.smithsonianmag.com/smart-news/part-arctic-ocean-suffering-plastic-pollution-180962985/
___________________________
Plastic Pollution Reaches and Penetrates the High Arctic
April 17, 2022
https://www.deeperblue.com/plastic-pollution-reaches-and-penetrates-the-high-arctic/
___________________________
Arctic temperatures are increasing four times faster than global warming
July 5, 2022
https://phys.org/news/2022-07-arctic-temperatures-faster-global.html
___________________________
Largest-ever Arctic ozone hole that developed this spring is now closed: scientists
April 28, 2020
https://www.ctvnews.ca/sci-tech/largest-ever-arctic-ozone-hole-that-developed-this-spring-is-now-closed-scientists-1.4915015
___________________________
Nearly 100K Fish Die After Tank Leaks 4,000 Gallons of Chlorine in Arctic Norway
8/10/21
https://www.newsweek.com/nearly-100k-fish-die-after-tank-leaks-4000-gallons-chlorine-arctic-norway-1617987
___________________________
Global accounting of PCBs in the continental shelf sediments.
2003
https://europepmc.org/article/MED/12564894
___________________________
Russia, world's worst oil polluter, now drilling in Arctic
2012
https://www.cbc.ca/news/world/russia-world-s-worst-oil-polluter-now-drilling-in-arctic-1.1281291
___________________________
Regional distribution of PCBs and presence of technical PCB mixtures in sediments from Norwegian and Russian Arctic Lakes
2002
https://www.sciencedirect.com/science/article/abs/pii/S0048969702004862
___________________________
Geographical
distribution of organochlorine pesticides (OCPs) in polar bears (Ursus
maritimus) in the Norwegian and Russian Arctic
2002
https://www.sciencedirect.com/science/article/abs/pii/S0048969702004904
___________________________
Organochlorine Pesticide and Trace Metal Monitoring of Russian Rivers Flowing to the Arctic Ocean: 1990–1996
2001
https://www.sciencedirect.com/science/article/abs/pii/S0025326X00001661
___________________________
Plastic pollution in the Eurasian Arctic – where does it come from and how does it get there?
Feb 03, 2021
Microplastics
have reached the remote areas of the Arctic Ocean, but we have limited
knowledge of its distribution, especially the role of rivers. By
analyzing the plastic particles in water samples from the Barents Sea to
the East-Siberian Sea, we were able to identify their origin.
https://sustainabilitycommunity.springernature.com/posts/plastic-pollution-in-the-eurasian-arctic-where-does-it-come-from-and-how-does-it-get-there
___________________________
Regional distribution of PCBs and presence of technical PCB mixtures in sediments from Norwegian and Russian Arctic Lakes
June 2003
https://www.researchgate.net/publication/10800589_Regional_distribution_of_PCBs_and_presence_of_technical_PCB_mixtures_in_sediments_from_Norwegian_and_Russian_Arctic_Lakes
___________________________
Riverine fluxes of the persistent organochlorine pesticides hexachlorcyclohexane and DDT in the Russian Federation
2000
https://www.sciencedirect.com/science/article/abs/pii/S0045653599005202
___________________________
PCBs Are Associated With Altered Gene Transcript Profiles in Arctic Beluga Whales (Delphinapterus leucas)
2014
Abstract
High trophic level arctic beluga whales (Delphinapterus leucas)
are exposed to persistent organic pollutants (POP) originating primarily
from southern latitudes. We collected samples from 43 male beluga
harvested by Inuvialuit hunters (2008–2010) in the Beaufort Sea to
evaluate the effects of POPs on the levels of 13 health-related gene
transcripts using quantitative real-time polymerase chain reaction.
Consistent with their role in detoxification, the aryl hydrocarbon
receptor (Ahr) (r2 = 0.18, p = 0.045 for 2008 and 2009) and cytochrome P450 1A1 (Cyp1a1) (r2 = 0.20, p < 0.001 for 2008 and 2009; r2 = 0.43, p
= 0.049 for 2010) transcripts were positively correlated with
polychlorinated biphenyls (PCBs), the dominant POP in beluga. Principal
Components Analysis distinguished between these two toxicology genes and
11 other genes primarily involved in growth, metabolism, and
development. Factor 1 explained 56% of gene profiles, with these latter
11 gene transcripts displaying greater abundance in years coinciding
with periods of low sea ice extent (2008 and 2010). δ13C
results suggested a shift in feeding ecology and/or change in condition
of these ice edge-associated beluga whales during these two years. While
this provides insight into the legacy of PCBs in a remote environment,
the possible impacts of a changing ice climate on the health of beluga
underscores the need for long-term studies.
https://pubs.acs.org/doi/10.1021/es403217r
___________________________
Chlorinated, brominated, and perfluorinated contaminants in livers of polar bears from Alaska
2005
Abstract
The existence of two subpopulations of polar bears in Alaska, the Beaufort Sea and the Chukchi Sea populations, has been documented. In this study, differences in concentrations and profiles of organochlorine pesticides, polychlorinated biphenyls (PCBs), polybrominated diphenyl ethers (PBDEs), and perfluorinated acids were examined in livers of polar bears from the two subpopulations in Alaska. Concentrations of most of the organohalogens analyzed were greater in the Beaufort Sea subpopulation than in the Chukchi Sea subpopulation, except for HCHs and perfluorononanoic acid (PFNA), which were high in samples from the Chukchi Sea subpopulation. Concentrations of chlordanes, PCBs, and perfluorooctanesulfonate (PFOS) were significantly different between the two subpopulations. Chlordane was the predominant contaminant in the Beaufort Sea population, and PFOS was the major contaminant in the Chukchi Sea population. Polar bears from the Beaufort Sea showed significantly higher proportions of more highly chlorinated PCBs than those from the Chukchi Sea. Concentrations of several perfluorinated acids were significantly correlated. Overall, the concentrations and profiles of organohalogens analyzed in the two subpopulations of polar bears suggest differences in the sources of exposures between the two regions of Alaska.
https://pubmed.ncbi.nlm.nih.gov/16382925/
___________________________
Concentrations and origin of polychlorinated biphenyls (PCBs) and polycyclic aromatic hydrocarbons (PAHs) in sediments of western Spitsbergen fjords (Kongsfjorden, Hornsund, and Adventfjorden)
21 March 2017
https://link.springer.com/article/10.1007/s10661-017-5858-x
___________________________
PCBs, PCDD/Fs, and Organochlorine Pesticides in Farmed Atlantic Salmon from Maine, Eastern Canada, and Norway, and Wild Salmon from Alaska
July 29, 2006
https://pubs.acs.org/doi/full/10.1021/es061006c
___________________________
Regional distribution of PCBs and presence of technical PCB mixtures in sediments from Norwegian and Russian Arctic Lakes
2003
https://www.sciencedirect.com/science/article/abs/pii/S0048969702004862
___________________________
Distribution
and Inventories of Polychlorinated Biphenyls in the Polar Mixed Layer
of Seven Pan-Arctic Shelf Seas and the Interior Basins
2011
https://pubs.acs.org/doi/10.1021/es103542f
___________________________
Latitudinal
Fractionation of Polychlorinated Biphenyls in Surface Seawater along a
62° N−89° N Transect from the Southern Norwegian Sea to the North Pole
Area
March 30, 2004
https://pubs.acs.org/doi/10.1021/es0353816
___________________________
‘Dark Waters’ and PFOA – FAQ
https://chemtrust.org/dark-waters-and-pfoa-faq/
___________________________
Aquatic Life Criteria - Perfluorooctanoic Acid (PFOA)
https://www.epa.gov/wqc/aquatic-life-criteria-perfluorooctanoic-acid-pfoa
___________________________
The Arctic Is Now Leaking Out High Concentrations of 'Forever Chemicals'
28 July 2021
https://www.sciencealert.com/arctic-ice-melt-is-leaking-out-high-concentrations-of-forever-chemicals
___________________________
Forever Chemicals Are Leaking from Arctic Ice and Affecting Native Species
Jul. 30 2021
https://www.greenmatters.com/p/arctic-forever-chemicals
___________________________
Arctic Leaking High Concentrations of ‘Forever Chemicals,’ Say Researchers
August 10, 2021
https://weather.com/news/climate/video/arctic-leaking-high-concentrations-of-forever-chemicals-say-researchers
___________________________
High concentrations of 'forever' chemicals being released from ice melt into the Arctic Ocean
July 27, 2021
https://phys.org/news/2021-07-high-chemicals-ice-arctic-ocean.html
___________________________
‘Forever chemicals’ in non-stick pans threaten polar bears
2021
https://www.thetimes.co.uk/article/forever-chemicals-in-non-stick-pans-threaten-polar-bears-d3vmsn7xj
___________________________
Geographical
distribution of organochlorine pesticides (OCPs) in polar bears (Ursus
maritimus) in the Norwegian and Russian Arctic
2003
https://www.sciencedirect.com/science/article/abs/pii/S0048969702004904
___________________________
The potential transport of pollutants by Arctic sea ice
1995
https://www.sciencedirect.com/science/article/pii/004896979504174Y
___________________________
Characterization of sediment contaminants in Arctic lagoons and estuaries
2019
https://www.sciencedirect.com/science/article/abs/pii/S0025326X1931029X
___________________________
Distribution and air-sea exchange of current-use pesticides (CUPs) from East Asia to the high Arctic Ocean.
07 Dec 2011
Abstract
Surface seawater and marine boundary layer air samples were collected on
the ice-breaker R/V Xuelong (Snow Dragon) from the East China Sea to
the high Arctic (33.23-84.5° N) in July to September 2010 and have been
analyzed for six current-use pesticides (CUPs): trifluralin, endosulfan,
chlorothalonil, chlorpyrifos, dacthal, and dicofol. In all oceanic air
samples, the six CUPs were detected, showing highest level (>100
pg/m(3)) in the Sea of Japan. Gaseous CUPs basically decreased from East
Asia (between 36.6 and 45.1° N) toward Bering and Chukchi Seas. The
dissolved CUPs in ocean water ranged widely from <MDL to 111 pg/L.
Latitudinal trends of α-endosulfan, chlorpyrifos, and dicofol in
seawater were roughly consistent with their latitudinal trends in air.
Trifluralin in seawater was relatively high in the Sea of Japan (35.2°
N) and evenly distributed between 36.9 and 72.5° N, but it remained
below the detection limit at the highest northern latitudes in Chukchi
Sea. In contrast with other CUPs, concentrations of chlorothalonil and
dacthal were more abundant in Chukchi Sea and in East Asia. The air-sea
gas exchange of CUPs was generally dominated by net deposition.
Latitudinal trends of fugacity ratios of α-endosulfan, chlorothalonil,
and dacthal showed stronger deposition of these compounds in East Asia
than in Chukchi Sea, while trifluralin showed stronger deposition in
Chukchi Sea (-455 ± 245 pg/m(2)/day) than in the North Pacific (-241 ±
158 pg/m(2)/day). Air-sea gas exchange of chlorpyrifos varied from net
volatilizaiton in East Asia (<40° N) to equilibrium or net deposition
in the North Pacific and the Arctic.
https://europepmc.org/article/MED/22103582
___________________________
Organochlorine Pesticides and Enantiomers of Chiral Pesticides in Arctic Ocean Water
August 1998
Abstract
In the summers of 1993 and 1994, seawater samples from the surface layer
(40–60 m) were collected to determine the spatial distribution of
organochlorine pesticides on expeditions that crossed the Arctic Ocean
from the Bering and Chukchi seas to the North Pole, to a station north
of Spitsbergen, and then south into the Greenland Sea. Spatial
differences in concentration were found that varied with the pesticide.
Heptachlor exo-epoxide (a metabolite of heptachlor) and
α-hexachlorocyclohexane (α-HCH) increased from the Chukchi Sea to the
pole, and then decreased toward Spitsbergen and Greenland Sea.
Chlorinated bornanes (toxaphene) followed a similar trend, but levels
were also high near Spitsbergen and in the Greenland Sea. A reverse
trend was found for endosulfan, with lower concentrations in the
ice-covered regions. Little variation was seen in chlordane
concentrations, although the ratio of trans-/cis-chlordane decreased at
high latitudes. Several of these pesticides are chiral: α-HCH, cis- and
trans-chlordane, and heptachlor exo-epoxide. Enantioselective
degradation of (−)α-HCH was found in the Bering and Chukchi seas,
whereas the (+) enantiomer was depleted in the Arctic Ocean and
Greenland Sea. Enrichment of (+) heptachlor exo-epoxide was found in all regions. Trans- and cis-chlordane were nearly racemic.
https://link.springer.com/article/10.1007/s002449900370
___________________________
Occurrence of polychlorinated biphenyls (PCBs) together with sediment properties in the surface sediments of the Bering Sea, Chukchi Sea and Canada Basin
2012
https://www.sciencedirect.com/science/article/abs/pii/S0045653512006546
___________________________
Legacy contaminants in the eastern Beaufort Sea
beluga whales (Delphinapterus leucas): are temporal
trends reflecting regulations?
2018
___________________________
Large
scale distribution of dioxins, PCBs, heavy metals, PAH-metabolites and
radionuclides in cod (Gadus morhua) from the North Atlantic and its
adjacent seas
2016 Feb 10
https://pubmed.ncbi.nlm.nih.gov/26874057/
___________________________
Dioxin
and dioxin-like PCB levels in cod-liver and -muscle from different
fishing grounds of the North- and Baltic Sea and the North Atlantic
11 August 2009
https://link.springer.com/article/10.1007/s00003-009-0308-5
___________________________
Large
scale distribution of dioxins, PCBs, heavy metals, PAH-metabolites and
radionuclides in cod (Gadus morhua) from the North Atlantic and its
adjacent seas
2016
https://www.sciencedirect.com/science/article/abs/pii/S0045653516300510
___________________________
Global accounting of PCBs in the continental shelf sediments.
01 Jan 2003
Abstract
The
recycling longevity of hydrophobic organic contaminants (HOCs) within
the global environment is set by their permanent removal through
processes such as degradation and burial in geological reservoirs. More
than 90% of the global sediment burial of organic carbon (OC) occurs on
the continental shelves, representing < 10% of the earth's ocean
area. The propensity of HOCs to associate with organic matter, and the
proximity of most population centers and thus presumed source areas to
coastal regions, led us to investigate shelf sediments as a depository
of significance for global HOC budgets. Here, the global inventory and
burial fluxes of polychlorinated biphenyls (PCBs) in continental shelf
sediments were estimated on a congener-specific basis from a database of
4214 distinct continental shelf surface sediment samples. To account
for near-urban sampling bias, the locations of each datum relative to
nearest population center were classified as Local (< 1 km), Regional
(1-10 km), or Remote (> 10 km), according to a comprehensive vector
map of the world (Digital Chart of the World) in a GIS environment. The
global inventory of, for instance, PCB congener 153 was 1200 ton (95%
confidence limit maximum: 2100 ton; and minimum 720 ton). The Remote
sub-basin of the North Atlantic contains approximately half of the
global shelf sediment inventory for most of the PCB congeners studied.
The shelf sediment inventories of individual PCB congeners constitute
significant fractions of their recently updated cumulative historical
global emissions estimates. The estimated inventory in the shelf
corresponds to about 10% of maximum emission estimates for
lower-chlorinated congeners. However, for the more bioaccumulable,
higher-chlorinated, congeners the shelf reservoirs appear to account for
up to 80% of the estimated maximum cumulative global emissions. These
shelf inventories represent 1-6% of the global industrial production of
PCBs. The global burial fluxes were estimated to be on the order of 8-24
ton/yr each for the eight major congeners investigated, again, with the
shelf constituting a more significant removal sink of the more
chlorinated congeners. The permanent removal into deeper shelf sediments
of PCB153 and PCB180 suggests that the global environmental mean
residence times of these pollutants are on the order of 110 and 70
years, respectively. Hence, even after production and direct releases
have been halted, we may expect to be exposed to such persistent
pollutants for decades and centuries to come.
https://europepmc.org/article/MED/12564894
___________________________
Persistent organochlorine contaminants in ringed seals ( Phoca hispida ) from the Kara Sea, Russian Arctic
1997
https://www.deepdyve.com/lp/wiley/persistent-organochlorine-contaminants-in-ringed-seals-phoca-hispida-9q82RHh0R7
___________________________
Persistent organic pollutants in ocean sediments from the North Pacific to the Arctic Ocean
18 March 2015
Abstract
Concentrations of polychlorinated biphenyls (PCBs), organochlorine pesticides (OC pesticides), and polybrominated diphenyl ethers (PBDEs) are reported in surficial sediments sampled along cruise transects from the Bering Sea to the central Arctic Ocean. OCs and PCBs all had significantly higher concentrations in the relatively shallow water (<500 m depth) of the Bering-Chukchi shelf areas (e.g., ΣPCB 286 ± 265 pg g−1 dw) compared to the deeper water regions (>500 m) of the Bering Sea and Arctic Ocean (e.g., Canada Basin ΣPCB 149 ± 102 pg g−1 dw). Concentrations were similar to, or slightly lower than, studies from the 1990s, indicating a lack of a declining trend. PBDEs (excluding BDE-209) displayed very low concentrations (e.g., range of median values, 3.5–6.6 pg/g dw). In the shelf areas, the sediments comprised similar proportions of silt and clay, whereas the deep basin sediments were dominated by clay, with a lower total organic carbon (TOC) content. While significant positive correlations were observed between persistent organic pollutant (POP) concentrations and TOC (Pearson correlation, r = 0.66–0.75, p <0.05), the lack of strong correlations, combined with differing chemical profiles between the sediments and technical formulations (and/or marine surface waters), indicate substantial chemical processing during transfer to the benthic environment. Marked differences in sedimentation rates between the shallow and deeper water regions are apparent (the ∼5 cm-depth grab samples collected here representing ∼100 years of accumulation for the shelf sediments and ∼1000 years for the deeper ocean regions), which may bias any comparisons. Nonetheless, the sediments of the shallower coastal arctic seas appear to serve as significant repositories for POPs deposited from surface waters.
https://agupubs.onlinelibrary.wiley.com/doi/full/10.1002/2014JC010651
___________________________
Organohalogen concentrations in blood and adipose tissue of Southern Beaufort Sea polar bears
2008
https://www.sciencedirect.com/science/article/abs/pii/S0048969708007766
___________________________
Concentrations of Polychlorinated Biphenyls (PCB’s),
Chlorinated Pesticides, and Heavy Metals and Other Elements
in Tissues of Belugas, Delphinapterus leucas, from Cook Inlet, Alaska
2000
https://aquadocs.org/bitstream/handle/1834/26386/mfr6238.pdf?sequence=1&isAllowed=y
___________________________
Contaminants in molting long-tailed ducks and nesting common eiders in the Beaufort Sea
2004
Abstract
In 2000, we collected blood from long-tailed ducks (Clangula hyemalis) and blood and eggs from common eiders (Somateria mollissima) at near-shore islands in the vicinity of Prudhoe Bay, Alaska, and at a reference area east of Prudhoe Bay. Blood was analyzed for trace elements and egg contents were analyzed for trace elements, organochlorine pesticides, polychlorinated biphenyls, and polycyclic aromatic hydrocarbons. Except for Se (mean=36.1 microg/g dry weight (dw) in common eiders and 48.8 microg/g dw in long-tailed ducks), concentrations of trace elements in blood were low and, although several trace elements differed between areas, they were not consistently higher at one location. In long-tailed ducks, Se in blood was positively correlated with activities of two serum enzymes, suggestive of an adverse effect of increasing Se levels on the liver. Although common eiders had high Se concentrations in their blood, Se residues in eggs were low (mean=2.28 microg/g dw). Strontium and Ni were higher in eggs near Prudhoe Bay than at the reference area, but none of the other trace elements or organic contaminants in eggs differed between locations. Concentrations of Ca, Sr, Mg, and Ni differed among eggs having no visible development, early-stage embryos, or late-stage embryos. Residues of 4,4'-DDE, cis-nonachlor, dieldrin, hexachlorobenzene, oxychlordane, and trans-nonachlor were found in 100% of the common eider eggs, but at low concentrations (means of 2.35-7.45 microg/kg wet weight (ww)). The mean total PCB concentration in eggs was 15.12 microg/kg ww. Of PAHs tested for, residues of 1- and 2-methylnaphthalene and naphthalene were found in 100% of the eggs, at mean concentrations of 0.36-0.89 microg/kg ww.
https://pubmed.ncbi.nlm.nih.gov/14980466/
___________________________
Polychlorinated biphenyls (PCBs) as sentinels for the elucidation of Arctic environmental change processes: a comprehensive review combined with ArcRisk project results
28 June 2018
https://link.springer.com/article/10.1007/s11356-018-2625-7
___________________________
Report says mercury, PCBs still threaten Arctic; new chemicals emerging
October 16th 2018
A new summary of toxins in the Arctic shows old-fashioned contaminants such as mercury continue to threaten polar bears and whales.
But new threats — both chemical and climatic — are emerging, says the report done for the eight nations that ring the North Pole.
"The number and types of contaminants continue to broaden," said Canadian scientist Robert Letcher, one of the lead authors of the study for the Arctic Council.
The report on the biological effects of contaminants on animals from seals to seabirds was released late last week. It's the latest in a series of assessments and is the most complete summary of research done between 2010 and 2017.
Scientists have long known that many substances pumped into southern skies make their way to the North where they work their way throughout the Arctic food web and concentrate in large predators.
Among the most common is mercury, a potent neurotoxin and a byproduct of burning coal.
Some Canadian polar bear populations have among the highest levels of mercury in the world. More than one-third of bears in the Beaufort Sea region are considered at high risk of health effects from mercury.
Mercury is also putting more than half the hooded seals in the Davis Strait at high risk.
Also found are persistent organic pollutants, known as POPs, which can include dioxins and PCBs as well as residual products from pesticides and other industrial chemicals.
An international agreement signed in 2001 that now includes 179 countries attempts to limit their spread, but they're still around.
Killer whales along the northern British Columbia coast are at high risk of PCB-related health effects. So are polar bears along Hudson Bay and seabirds along the Davis Strait.
"There are clearly hot spots in the Arctic when it comes to chemical stress impact," Letcher said.
Those regions include Hudson Bay, Baffin Bay and the Beaufort Sea.
Climate change adds to the concern.
Shrinking sea ice seems to be altering normal feeding patterns and shifting some animals to prey more prone to contamination. Hudson Bay polar bears are one example...
___________________________
Scientists find hundreds of new toxins in polar bear blood
December 7, 2018
Chemicals may be coming from Asia
The study used blood samples provided by Environment Canada from two different polar bear subpopulations: the Beaufort Sea and the Western Hudson Bay bears.
It pooled the blood of 10 bears from each subpopulation to get an average of what chemicals the bears contained. The researchers then looked at similarly pooled blood samples from bears, taken every five years back to the 1980s.
Using the historical data, Martin was able to see the rising trend of fluorinated chemicals.
Interestingly, the bears from the Beaufort subpopulation had higher concentrations of the stain-repellent chemicals than the Hudson bears, which could mean the chemicals are coming from Asia as the sea water flows across the Bering Strait and into the Beaufort Sea.
Martin says the next steps involve research that would pinpoint where and what the chemicals are coming from, so they can be cut off at the source. Future studies should also look at the human effects and concentrations.
"I'm personally trying to push for human studies," Martin said. He's encouraging anyone who wants to take part to contact him through Health Canada.
https://www.cbc.ca/news/canada/north/polar-bear-contaminants-study-1.4935613
___________________________
Hundreds of unrecognized halogenated contaminants discovered in polar bear serum
December 3, 2018
Using a new approach to measure chemical contaminants in polar bears, scientists from Canada and the United States found a large variety of new chlorinated and fluorinated substances, including many new polychlorinated biphenyl metabolites. Worryingly, these previously unrecognized contaminants have not declined in the past decades, and many long-chain fluorinated alkyl sulfonic acids have been increasing over time, says the study published in the journal Angewandte Chemie.
Polar bears reside at the top of the Arctic food chain. Whatever pollutants fish and other marine living species take up, they can end up biomagnifying in the polar bears that eat them. Halogenated contaminants were recognized in polar bear serum for the first time in the 1970s, and since then have been monitored frequently, as these man-made substances or their direct metabolites have been linked to disturbances of the immune system or endocrine function. The current study with leading author Jonathan W. Martin from the University of Alberta, Edmonton, Canada, and now at Stockholm University, Sweden, gives a survey on the different classes of halogenated contaminants now detected in polar bear serum, and also tracks down the trends in contamination during the last two decades.
Prof. Martin and Ph.D. Student Yanna Liu chose two polar bear subpopulations, one from Hudson Bay and one from the Beaufort Sea in the Northern Arctic, for analysis. Serum taken from each population was pooled and then examined by high-performance chromatography and high-resolution mass spectrometry techniques, after stripping from protein and phospholipids and extraction into plastic capillaries. Former studies have relied on gas chromatography techniques, requiring more and harsher purification steps.
One major class of substances discovered were the polychlorinated biphenyls (PCBs), which have been known to accumulate in polar bears since the 1970s. Although banned from production worldwide in the 1980s, PCBs, for which adverse health effects have been proven, persist so long in the environment that they can still be found all over the world. In addition to known metabolites of PCBs, the scientists discovered previously unknown PCB metabolites. And as they demonstrate, all these novel substances were also formed by mice exposed to a PCB mixture, suggesting that other mammals may also be exposed to these chemicals.
Other class identified were new groups of perfluoroalkyl sulfonic acids (PFASs), including the perfluoroalkyl ether sulfonates, some of which may still be used in a wide range of industrial applications. Especially the long-chain PFASs seem to have adverse reproductive, developmental and systemic effects. For these chemicals, Prof. Martin and his colleagues observed a worrying trend of increasing accumulation from 1984 to 2014, especially in the polar bear subpopulation from the Beaufort Sea. This location is closer to the Chinese bustling economic regions where still large outputs of these multipurpose chemicals have been reported.
Finally, the scientists discovered several other polychlorinated compounds in polar bears for the first time, including several chlorinated aromatics. In view of their findings, especially the trends, the authors strongly suggest a reassessment of the health risks associated with these stable metabolites. Despite some regulatory restrictions and bans on production, their concentrations have not declined, but are still increasing in endangered species that live in such remote areas as in the Arctic.
https://phys.org/news/2018-12-hundreds-unrecognized-halogenated-contaminants-polar.html
___________________________
Baseline Characterization of Anthropogenic
Contaminants in Biota Associated with the Alaska
OCS Liberty and Northstar Oil and Gas Production
Unit in the Nearshore Beaufort Sea
August 2003
https://www.boem.gov/sites/default/files/boem-newsroom/Library/Publications/2003/2003-071.pdf
___________________________
Thyroid Hormone and Selenium Status of Southern Beaufort Sea Polar Bears: Assessing Potential Biological Effects of Contaminants
2010
Abstract
Polychlorinated biphenyls (PCBs) and their metabolites have been related to potential deleterious changes in thyroid hormone concentrations of polar bears. Because PCBs may act synergistically with mercury (Hg) to further provoke thyroid disruption, we explored the interactions of both toxicants on the thyroid status of polar bears. Disruptions to thyroid function can occur through deficiencies of iodine or selenium (Se), conformational changes to circulating binding proteins, decreases in the transformation of thyroxine (T4) to triiodothyronine (T3) in thyroid or peripheral organs, or disruption of feedback systems. Many of these mechanisms of thyroid disruption have been suggested to be associated with exposure to toxicants in humans and wildlife. Selenium is important in antioxidant defense and is part of iododeionases in both thyroid and liver. Interactions between Hg and Se could also promote indirect effects on thyroid function.
Concentrations of thyroid hormones (total thyroxine, TT4; free thyroxine, FT4; total triiodothyronine, TT3; free triiodothyronine, FT3) and Se in the blood of 55 free-ranging Southern Beaufort Sea polar bears were examined for variations among sex and age cohorts during spring, and interactions with circulating toxicant concentrations of Hg and PCBs. Validation of radioimmunoassays was determined for use in ursids. Percent recoveries and sensitivity of assays were performed through serial dilutions of 2 pooled samples. Inter-assay and intra-assay correlations of variation ranged from 8-24 % with good parallelism (correlation mean > 0.9) between dilution of pooled samples and standard dilutions in protein buffer.
Free T3 concentrations were significantly lower in adult males (0.360 ± 0.228 pmol/l) than adult females (0.624 ± 0.241 pmol/l) and young (1.033 ± 0.413 pmol/l). Similar variations among cohorts were found for TT4, FT4 and TT3. Only free fractions of T3 significantly decreased with age. Thyroid hormones were positively correlated to concentrations of Se. Molar ratios of TT4: TT3 were greater in females than males, but TT3: FT3 and FT4: FT3 were lower in females than males. Five of the eight thyroid function indices were correlated with at least one toxicant in adult females, and two of eight thyroid function indices correlated with toxicants in adult males. There was a positive correlation between the molar ratio of TT4:TT3 with Hg, but a negative correlation between molar TT4:TT3 and elevations of both toxicants (Hg x PCBs interaction).
Numerous biological factors complicate the assessment of the impacts of toxicants on thyroid status of polar bears. For example, previous periods of fasting and food deprivation in polar bears may disrupt the normal homeostatic balance of Se. Female polar bears may be more susceptible to thyroidal effects during spring due to greater concentrations of toxicants (Hg and PCBs), lower concentrations of Se, and previous periods of food deprivation during maternal denning. Alterations in thyroid function are expected to be recoverable. Further assessment of thyroid status and regulation in polar bears are needed to evaluate the impacts of contaminants on endocrine function. Variations among seasons and cohorts, interactions with essential elements, and validation of methods must be included in these evaluations.
https://www.vin.com/apputil/content/defaultadv1.aspx?pId=11307&meta=VIN&id=4473852
___________________________
Spatial distribution of selenium-mercury in Arctic seabirds
2023
https://www.sciencedirect.com/science/article/abs/pii/S0269749123021127
___________________________
ASSESSMENT OF PCBs AND DDTs IN
FISH POPULATIONS OF THE COLVILLE RIVER NEAR THE
FORMER UMIAT AIR FORCE STATION UMIAT, ALASKA
November 2015
https://www.north-slope.org/wp-content/uploads/2022/05/LINC_Assessment_PCBs_DDTs_Fish_Populations_Colville_River_Umiat_.pdf
___________________________
Canadian Arctic Contaminants Assessment Report III (2013): Persistent Organic Pollutants in Canada's North
2016
3. Information on the chemicals of interest has expanded
The list of individual compounds analysed was expanded in Phase III particularly for perfluorinated and polyfluorinated alkyl substances (PFASs), brominated flame retardants (BFRs) and current use pesticides (CUPs). About 35 chemicals or chemical groups that were not previously reported, or for which only very limited measurements were available in the previous assessment, have been detected particularly in arctic air, snow and biota (Table 2). See the Glossary for more details on the chemical names and abbreviations.
| Major groups of POPs and other persistent organics | NCP I (1991-1996) | NCP II (1997-2002) | NCP III (2003-2011) |
|---|---|---|---|
| PCBs1 | Air, snow, sediment, seawater, biota | Air, seawater, sediment, biota | Air, snow, seawater, biota |
| OC pesticides2 | Air, snow, sediment, seawater, biota | Air, seawater, sediment, biota | Air, snow, biota |
| Chlorobenzenes | Air, snow, sediment, seawater, biota | Air, seawater, sediment, biota | Air, snow, biota |
| Chlorinated dioxins/furans | Biota | Air, sediment, biota | Biota |
| Chlorinated naphthalenes (PCNs) | Air, biota | Air, biota | |
| Chlorinated paraffins | Air, sediment, biota | Biota | |
| Endosulfan | Air, seawater, biota | Air, seawater, biota | |
| Polybrominated diphenyl ethers (PBDEs) | Sediment, biota | Air, snow, seawater, sediment, biota | |
| Hexabromocyclododecane (HBCDD) | Air, snow, seawater, biota | ||
| Other Brominated and chlorinated flame retardants | Air, snow, seawater, biota | ||
| Penta and hexabromobiphenyls | Air, biota | ||
| Current use pesticides3 | Air, snow, seawater, lake water, biota | ||
| Perfluorooctane sulfonate (PFOS) and other perfluoro-alkyl acids and alcohols | Air, snow, seawater, lake water, sediment, biota | ||
| Siloxanes | Air |
1various congeners depending on the study; 2DDTs, hexachlorocyclohexanes (HCHs), chlordanes, toxaphene; 3Current use pesticides including dacthal, chlorothalonil, chlorpyrifos, pentachloronitrobenzene(PCNB), trifluralin
Among the chlorinated organics, PCNs are now more widely measured (air, seals, beluga, seabirds). Only limited new data were available for chlorinated paraffins over the period 2003-2011 due to analytical difficulties for the labs involved with measurement. Both the PCNs and short chain chlorinated paraffins SCCPs) are currently being evaluated for inclusion in the Stockholm Convention.
New groups of chemicals measured in the past 10 years included CUPs such as dacthal, PCNB, trifluralin and chlorthalonil which became routinely reported for air and seawater. Limited measurements of CUPs were also made in marine and terrestrial food webs which indicated that these CUPs do not biomagnify. About 20 brominated and chlorinated flame retardant chemicals also were included in analytical suites. Many were also being assessed under Canada’s Chemical Management Plan. For HBCDD, the most widely detected non-PBDE flame retardant, the data for HBCDD in Canadian arctic biota formed an important part of the risk profile adopted by the Stockholm Convention in 2010. However most of the other non-PBDE BFRs have been below detection limits in air and biological samples.
The discovery of PFASs in arctic wildlife, and subsequently in all environmental compartments, is perhaps the most surprising result of the past 10 years of arctic contaminants monitoring. Unlike chlorinated and brominated POPs, these chemicals are relatively water soluble and “oleophobic”, accumulating in protein rich tissues such as liver and blood. The precursors of PFOS and other PFASs are highly volatile and best measured in the atmosphere. However they can be degraded in the atmosphere to persistent and bioaccumulative substances. The presence of high levels of PFOS and long chain perfluorocarboxylates (PFCAs) in Arctic marine mammals and polar bears also illustrated the need to examine a broader array of chemicals for their ability to be transported to the Arctic, to be transformed to persistent substances, and to accumulate in arctic food webs.
The use of passive air samplers began under Phase III and results for Arctic locations from this program, which was part of the Global Atmospheric Passive Sampling (GAPS) program were comparable with the active high volume sampling at Alert. Passive air samplers are advantageous because of their low cost, simple construction and electricity-free operation. Modification of the absorbent in the samplers enabled sampling of volatile precursors of PFOS and PFCAs as well as volatile methyl siloxanes in Arctic air and comparisons with rural and urban areas around the globe. However, low air concentrations in the Arctic often result in detectability issues. A newly developed flow-through passive sampler, which has shown comparable results at a much lower cost and maintenance than high-volume air sampling at Alert may resolve this issue.
The importance of particle transport of non-volatile contaminants such as the widely used flame retardant decaBDE has been demonstrated by the detection of elevated concentrations in the Devon Island ice cap. This transport pathway was previously recognized mainly for inorganic chemicals such as lead or sulfate. Other “new” flame retardant chemicals in air samples taken at Alert are also mainly on particles. BFRs such as bis(tribromophenoxy) ethane,, ethylhexyl-tetrabromobenzoate and bis(ethylhexyl)tetrabromophthalte were generally detected with concentrations similar to those of the dominant PBDE congeners.
Several independent studies that have screened chemicals in commerce have demonstrated there are hundreds of substances with properties similar to those of known persistent organic chemicals detected in the Arctic. These may be future candidates for monitoring in Arctic air and wildlife. To model the transport of these candidate chemicals to the Arctic requires information on quantities of chemicals used and emitted in source regions. This information is generally not available except for CUPs. However, modeling of long range atmospheric transport of POPs has advanced to the point that it is possible to use a global model to suggest a cap on the annual emissions in various parts of the world, depending on the efficiency of transport to a vulnerable area.
The detection of perfluorinated alkyl acids such as PFOS and PFOA in arctic seawater, along with global modeling, has demonstrated the importance of ocean transport of contaminants. The slow movement and large mass of seawater also underlines the very long term nature of the exposure of arctic marine food chains to contaminants. The discovery of the PFASs in seawater has led to a tremendous expansion of modelling of long range ocean transport (LROT) transport of PFASs and other POPs to the Arctic. Environmental measurements of two major PFASs, PFOS and PFOA are in reasonable agreement with currently available data for ocean waters suggesting that available emission estimates for these two compounds are plausible. Modelling results suggest that redistribution of these contaminants from lower latitudes to the Arctic Ocean is ongoing and the total mass (and average concentration) of PFOA and PFOS in the marine environment is expected to increase for the next 10 to 20 years. A major conclusion from LROT modelling is that exposure of marine food webs to more water soluble POPs in the eastern Arctic waters, may be substantially different than exposure elsewhere e.g. in the western Canadian arctic waters. This pattern of distribution is distinct from LRAT, which tends to result in more uniform deposition fluxes and therefore of concentrations/exposure in the water column. This is borne out by observations of different concentrations and rates of change of POPs in beluga and ringed seals from the southern Beaufort Sea compared to Hudson Bay and Cumberland Sound regions.
Recommendations:
- Much further work is needed to assess whether climate change, particularly warming trends, is affecting POPs transport to the Arctic
- Urgent need for more research on other particle bound organic chemicals that may be entering the arctic environment.
- More data are required on the quantities of chemicals used and emitted in source regions.
- Monitoring programs need to consider including a broader range of chemicals, including both parents and transformation products, which may have POP-like properties to assess their potential for long-range transport as well as to assess changes by developing time trends in different media. Chemicals with potential for Arctic contamination can first be identified using fate and transport models.
- More focus is needed on new candidate chemicals on current
Stockholm Convention and UNECE LRTAP lists (PCNs, pentachlorophenol,
hexachlorobutadiene) as well as on SCCPs, chlordecone and
hexabromobiphenyl in order to fully assess their importance as
contaminants in the biological environment.
Table 3:
The table describes temporal trends for arctic air and wildlife (burbot, lake trout, landlocked char, seabirds, seals, beluga, and polar bears) monitored under the Northern Contaminants Program core monitoring program. The table illustrates how the monitoring program is now able to measure statistically significant decreasing trends for all persistent organic pollutants (POPs) originally included in the Stockholm Convention (PCBs, ∑CBz, ∑CHLs, ∑DDT, and toxaphene) in nearly all monitoring species and air. The table also shows statistically significant trends for newer POPs (∑PBDEs, HBCDD, PFOS and precursors, PFCAs and precursors), with some species and locations exhibiting increasing trends and others decreasing. Some species also show an increasing trend followed by a decreasing trend, particularly for newer POPs that were recently added to the Stockholm Convention. The table shows, with a few exceptions, how there is still insufficient data to measure trends of endosulfan, SCCPs, PCNs, and PCDD/Fs.
Reference: List of Acronyms
- PCBs – polychlorinated biphenyls
- ∑CBz – sum of chlorobenzenes
- ∑CHLs – sum of chlordane related compounds
- ∑DDT – sum of DDT related compounds
- ∑PBDEs – sum of polybrominated diphenyl ethers
- HBCDD - hexabromocyclododecane
- PFOS – perfluorooctane sulfonate
- PFCAs – perfluoroalkyl carboxylates
- SCCPs – short-chain chlorinated paraffins
- PCNs – polychlorinated naphthalenes
- PCDD/Fs – polychlorinated dibenzo-p-dioxins and furans
Recommendations:
- Continued annual sampling is essential for detecting temporal trends of chemicals in commerce in biota. Annual sampling has been instrumental in demonstrating the rise and fall of new POPs, improving the statistical power of trends of legacy POPs, as well as in allowing investigations of the effect of climate change
- There are limited measurements and a lack of time trends of atmospheric POPs in the western and eastern Canadian Arctic. This data gap needs to be addressed either by use of hi-vol samplers or passive air samplers or some combination. Air monitoring seems particularly critical for the western Arctic given the known rise of organic chemical production and uses in Asia in the past decade
- Time-series data for POPs and new contaminants in seawater are needed for understanding the fate and trends of contaminants and would be particularly useful for the less bioaccumulative chemicals such as current use pesticides.
- While annual sample collection has boosted the statistical power of the biological program and therefore must be continued, consideration should be given to de-emphasizing annual measurements of some legacy POPs, where statistical analysis shows that the datasets meet monitoring goals, and placing more emphasis on new candidate or emerging chemicals which may have limited datasets.
- It must be recognized that a major strength of the temporal trend programs conducted under the NCP is the availability of archived samples from specimen banks. These must be maintained to continue to have a strong program for POPs monitoring.
___________________________
Organochlorine Pesticides and Enantiomers of Chiral Pesticides in Arctic Ocean Water
August 1998
https://link.springer.com/article/10.1007/s002449900370
___________________________
Occurrence of polychlorinated biphenyls (PCBs) together with sediment properties in the surface sediments of the Bering Sea, Chukchi Sea and Canada Basin.
2012
https://europepmc.org/article/MED/22722002
___________________________
Monitoring PCBs in polar bears: lessons learned from Svalbard.
11 October 2001
https://www.semanticscholar.org/paper/Monitoring-PCBs-in-polar-bears%3A-lessons-learned-Henriksen-Wiig/8a98351de828359fa86246bf88e98976613148fc
___________________________
Unwelcome travelers: Pesticides in the Arctic
2011
https://www.panna.org/blog/unwelcome-travelers-pesticides-arctic
___________________________
Chlorinated, brominated, and perfluorinated contaminants in livers of polar bears from Alaska
2005
https://pubmed.ncbi.nlm.nih.gov/16382925/
___________________________
Organochlorine Pesticides and Enantiomers of Chiral Pesticides in Arctic Ocean Water
August 1998
Abstract
In the summers of 1993 and 1994, seawater samples from the surface layer
(40–60 m) were collected to determine the spatial distribution of
organochlorine pesticides on expeditions that crossed the Arctic Ocean
from the Bering and Chukchi seas to the North Pole, to a station north
of Spitsbergen, and then south into the Greenland Sea. Spatial
differences in concentration were found that varied with the pesticide.
Heptachlor exo-epoxide (a metabolite of heptachlor) and
α-hexachlorocyclohexane (α-HCH) increased from the Chukchi Sea to the
pole, and then decreased toward Spitsbergen and Greenland Sea.
Chlorinated bornanes (toxaphene) followed a similar trend, but levels
were also high near Spitsbergen and in the Greenland Sea. A reverse
trend was found for endosulfan, with lower concentrations in the
ice-covered regions. Little variation was seen in chlordane
concentrations, although the ratio of trans-/cis-chlordane decreased at
high latitudes. Several of these pesticides are chiral: α-HCH, cis- and
trans-chlordane, and heptachlor exo-epoxide. Enantioselective
degradation of (−)α-HCH was found in the Bering and Chukchi seas,
whereas the (+) enantiomer was depleted in the Arctic Ocean and
Greenland Sea. Enrichment of (+) heptachlor exo-epoxide was found in all regions. Trans- and cis-chlordane were nearly racemic.
https://link.springer.com/article/10.1007/s002449900370
___________________________
Occurrence of polychlorinated biphenyls (PCBs) together with sediment properties in the surface sediments of the Bering Sea, Chukchi Sea and Canada Basin
2012 Jun 20
https://pubmed.ncbi.nlm.nih.gov/22722002/
___________________________
Researchers Follow Pesticides’ Migration To The Arctic
December 1, 2011
https://cen.acs.org/articles/89/web/2011/12/Researchers-Follow-PesticidesMigration-Arctic.html
___________________________
A potential nitrogen sink discovered in the oxygenated Chukchi Shelf waters of the Arctic
20 September 2017
https://geochemicaltransactions.biomedcentral.com/articles/10.1186/s12932-017-0043-2
___________________________
On the circulation, water mass distribution, and nutrient concentrations of the western Chukchi Sea
2022-01-05
https://www.osti.gov/pages/biblio/1839056
___________________________
Organochlorine Pesticides and Enantiomers of Chiral Pesticides in Arctic Ocean Water
August 1998
https://link.springer.com/article/10.1007/s002449900370
___________________________
Unwelcome travelers: Pesticides in the Arctic
Dec 8, 2011
https://www.panna.org/blog/unwelcome-travelers-pesticides-arctic
___________________________
Distribution of organochlorine pesticides in seawater of the Bering and Chukchi Sea
2001
Abstract
Organochlorine pesticides (OCPs) in the seawater collected in the Bering
and Chukchi Seas during the First Chinese Arctic Research Expedition
were confirmed by gas chromatography–mass spectrometry (GC–MS) and
analyzed by capillary gas chromatography with micro-electron capture
detector (GC-μECD). The average of hexachlorocyclohexanes (HCHs; sum of
isomers α-, β-, γ-, δ-) was nearly equal in the Bering Sea (mean
concentration 412.7 pg/l) and in the Chukchi Sea (mean concentration
445.8 pg/l), which showed no obvious latitudinal difference of these two
regions. Compared with previously reported studies, concentrations of
OCPs in these regions were much lower than the levels in the last
decades. The ratio of α:γ HCH was 5.0 and 3.4 for the
Bering and Chukchi sea, respectively, which indicated the different
pesticide composition in these two regions. Many other OCPs with
different residue patterns were also found for the first time in the
investigation regions. Heptachlor epoxide (in the Bering Sea) and
heptachlor (in the Chukchi Sea) were main OCPs contaminants besides
HCHs.
https://www.sciencedirect.com/science/article/abs/pii/S0269749101001348
___________________________
Atmospheric organochlorine pollutants and air-sea exchange of hexachlorocyclohexane in the Bering and Chukchi Seas
June 16, 2010
https://www.usgs.gov/publications/atmospheric-organochlorine-pollutants-and-air-sea-exchange-hexachlorocyclohexane
___________________________
Arctic Pollution
2013
https://theglobalfool.com/arctic-pollution/
___________________________
Organochlorine Pesticides and Enantiomers of Chiral Pesticides in Arctic Ocean Water
August 1998
https://link.springer.com/article/10.1007/s002449900370
___________________________
On carbon transport and fate in the East Siberian Arctic land–shelf–atmosphere system
4 January 2012
https://iopscience.iop.org/article/10.1088/1748-9326/7/1/015201
___________________________
Distribution of organochlorine pesticides in seawater of the Bering and Chukchi Sea
2001
https://pubmed.ncbi.nlm.nih.gov/11808555/
___________________________
Distribution and sources of rare earth elements in sediments of the Chukchi and East Siberian Seas
2019
https://www.sciencedirect.com/science/article/pii/S1873965218301725
___________________________
Abundance and distribution of microplastics in the surface sediments from the northern Bering and Chukchi Seas
2018 Nov 2
https://pubmed.ncbi.nlm.nih.gov/30415031/
___________________________
Eastward and northward components of ocean current, temperature, salinity and ice analysis collected from industry sponsored moorings in the Chukchi Sea, Alaska from 2008-09-08 to 2016-10-13
https://www.ncei.noaa.gov/access/metadata/landing-page/bin/iso?id=gov.noaa.nodc:0164964
___________________________
Microplastics abundance and characteristics in surface waters from the Northwest Pacific, the Bering Sea, and the Chukchi Sea
2019
https://www.peeref.com/works/18763348
___________________________
Pre-modern Arctic Ocean circulation from surface sediment neodymium isotopes
04 March 2013
https://agupubs.onlinelibrary.wiley.com/doi/full/10.1002/grl.50188
___________________________
Seawater-derived neodymium isotope records in the Chukchi Sea, western Arctic Ocean during Holocene: implications for oceanographic circulation
April 2015
https://ui.adsabs.harvard.edu/abs/2015EGUGA..17.8776L/abstract
___________________________
Benthic fluxes of trace metals in the Chukchi Sea and their transport into the Arctic Ocean
2018
https://www.sciencedirect.com/science/article/abs/pii/S0304420318301282
___________________________
Separating individual contributions of major Siberian rivers in the Transpolar Drift of the Arctic Ocean
15 April 2021
https://www.nature.com/articles/s41598-021-86948-y
___________________________
Late Holocene Paleomagnetic Secular Variation in the Chukchi Sea, Arctic Ocean
29 April 2022
https://agupubs.onlinelibrary.wiley.com/doi/full/10.1029/2021GC010187
___________________________
Provenance of terrigenous detritus of the surface sediments in the Bering and Chukchi Seas as derived from Sr and Nd isotopes: Implications for recent climate change in the Arctic regions
2011
https://www.sciencedirect.com/science/article/abs/pii/S0967064511002530
___________________________
Microplastics abundance and characteristics in surface waters from the Northwest Pacific, the Bering Sea, and the Chukchi Sea
2019 Apr 23
Microplastics (MPs) in the Arctic Ocean have gained considerable
attention due to its ubiquity and impacts within ecosystems. However,
little information is available on MPs in the Pacific section of the
Arctic Ocean. The present study determined the abundance, distribution,
and composition of MPs in surface waters from the Northwestern Pacific,
the Bering Sea, and the Chukchi Sea. The MPs abundances varied from
0.018 items/m3 to 0.31 items/m3, with a mean abundance of 0.13 ± 0.11 items/m3.
The highest level of MPs was found in the Chukchi Sea. Of all of the
detected MPs, polyethylene terephthalate (PET) accounted for the largest
proportion of MPs, and fiber was predominant with regard to the total
amount. Our results highlighted that the Arctic Ocean is becoming a
hotspot for plastic pollution, and the risks posed by MPs need to be
paid closer attention in future investigations.
https://pubmed.ncbi.nlm.nih.gov/31789166/
___________________________
A spike in central Arctic Ocean radium levels startled scientists — and led to discoveries about how the ocean is rapidly changing
May 15, 2018
In 2007, researchers climbed onto the icebreaker Polarstern and debarked from the northern Norwegian city of Tromsø, which sailed to the central Arctic Ocean. Here, they took samples of the surface water, examining them for a special isotope, radium-228.
Years later, in 2015, a second research team found their own way to the same central Arctic waters, this time on board the American icebreaker Healy,on a similar mission, to test the central Arctic waters for the radium-228 isotope.
Comparing the measurements from 2007 and 2015, the researchers made a startling discovery, recorded in a January article published in the journal Science Advances: the amount of radium-228 had nearly doubled over the last eight years, indicating significant changes are happening along the Arctic coast due to climate change.
Radium-228 is a naturally-occurring isotope that dissolves in water, making it easy for scientists to track its origin, flow and how much is found in the water. It is added to the water when the sea encounters the coastline or continental shelf, the underwater extension of a continent.
“Seeing high levels of radium tells us that the water has recently been in contact with the coast and that’s what makes it a good tracer,” said Lauren Kipp, a graduate student at Woods Hole Oceanographic Institution and MIT and lead author of the study.
For the study, Kipp and her co-researchers took samples of sea surface water at 69 locations spanning from the southern Chukchi Sea up to the North Pole and looping around through the Canada Basin and the Beaufort Sea.
https://www.arctictoday.com/spike-central-arctic-ocean-radium-levels-startled-scientists-led-discoveries-ocean-rapidly-changing/
___________________________
Radium levels suggest Arctic Ocean chemistry is changing
April 10, 2018
https://www.earthmagazine.org/article/radium-levels-suggest-arctic-ocean-chemistry-changing
___________________________
America's Most 'Toxics-Releasing' Facility Is Not Where You'd Think
February 21, 2018
In 2016 Alaska's Red Dog Mine officially released 756 million pounds of toxic chemicals, and residents in a native village 50 miles away are worried they're being contaminated.
https://www.nationalgeographic.com/science/article/most-toxic-town-us-kotzebue-alaska-red-dog-mine
___________________________
Benthic fluxes of trace metals in the Chukchi Sea and their transport into the Arctic Ocean
https://oceanrep.geomar.de/id/eprint/44899/7/Vieira_final%20draft%20with%20figures%20and%20tables.pdf
___________________________
Transit time of river water in the Bering and Chukchi Seas estimated from δ18O and radium isotopes
2017
Abstract
Seawater samples for the measurements of 226Ra, 228Ra and stable oxygen isotope (δ18O) were collected from the Bering and Chukchi Seas in the summer of 2014. The fractions of meteoric water (fMW) and sea-ice melted water (fSIM) were estimated based on the mass balance of salinity and δ18O with a three end-member mixing model. Our results showed that the average fMW increased northward from the Bering Basin to the Canada Basin while the fSIM distributed homogeneously. The lowest fMW and 228Ra/226Ra)A.R. values were found in the upper Bering Basin with little terrestrial input. The highest fMW but low 228Ra/226Ra)A.R. appeared in the northern Chukchi Sea and the Canada Basin, ascribing to the current-driven accumulation of freshwater and its long residence time. More abundant sea-ice melted water was found on the pack-ice edge, indicating the trap of earlier melted waters by the ice pack. Based upon the linear relationships between 228Ra/226Ra)A.R. and fMW in the Bering Shelf and the Chukchi Shelf, the transit time for the Pacific inflow was constrained. The transit time of river water from the Bering Shelf to the Chukchi Shelf was estimated as 0.2–4.4 years with an average of 1.6 ± 1.5 years, while that from the Chukchi Shelf to the Canada Basin was 10.2–13.2 years with an average of 11.8 ± 1.1 years. The spatial variation of the transit time was mainly affected by the current intensity. Our study highlights the importance of in-depth evaluation for the subarctic-arctic exchange.
https://www.sciencedirect.com/science/article/abs/pii/S007966111730037X
___________________________
Impacts of Chromophoric Dissolved Organic Material on Surface Ocean Heating in the Chukchi Sea
2008
https://digitalcommons.odu.edu/cgi/viewcontent.cgi?article=1292&context=oeas_fac_pubs
___________________________
Effects of UV radiation on aquatic ecosystems and interactions with other environmental factors
2014
https://pubs.rsc.org/en/content/articlehtml/2015/pp/c4pp90035a
___________________________
Effects of climate change on methane emissions from seafloor sediments in the Arctic Ocean: A review
17 May 2016
https://aslopubs.onlinelibrary.wiley.com/doi/full/10.1002/lno.10307
___________________________
"Komsomolets" leaks radioactivity
July 10, 2019
One sample taken from an open ventilation hole of the wreaked Soviet nuclear powered submarine shows levels of about 800 Becquerel per liter.
https://thebarentsobserver.com/en/ecology/2019/07/komsomolets-leaks-radioactivity-see-unique-video
___________________________
Pelagic vs Coastal-Key Drivers of Pollutant Levels in Barents Sea Polar Bears with Contrasted Space-Use Strategies
2019 Dec 11
https://pubmed.ncbi.nlm.nih.gov/31823610/
___________________________
Endocrine-Disrupting Chemicals and Climate Change: A Worst-Case Combination for Arctic Marine Mammals and Seabirds?
1 April 2006
https://ehp.niehs.nih.gov/doi/10.1289/ehp.8057
___________________________
Water, sanitation, pollution, and health in the Arctic
25 October 2018
https://link.springer.com/article/10.1007/s11356-018-3388-x
___________________________
Treatment of Arctic wastewater by chemical coagulation, UV and peracetic acid disinfection
16 February 2017
https://link.springer.com/article/10.1007/s11356-017-8585-5
___________________________
Mercury and toxic cocktails affect the Arctic ecosystems, wildlife and human health – How to take action?
23 October 2020
https://www.arctic-council.org/news/mercury-and-toxic-cocktails-effects-on-arctic/
___________________________
Tracking the Spread of Toxic Chemicals Through the Arctic
2022
https://www.maritime-executive.com/editorials/tracking-the-spread-of-toxic-chemicals-through-the-arctic
___________________________
Newer PFAS contaminant detected for first time in Arctic seawater
July 29, 2020
https://www.sciencedaily.com/releases/2020/07/200729114838.htm
___________________________
Project reveals low levels of PFAS in drinking water
August 6th, 2020
http://www.thearcticsounder.com/article/2032project_reveals_low_levels_of_pfas_in
___________________________
Investigating the Uptake and Fate of Poly- and
Perfluoroalkylated Substances (PFAS) in Sea Ice Using an Experimental
Sea Ice Chamber
2021 Jun 3
https://www.ncbi.nlm.nih.gov/pmc/articles/PMC8296678/
___________________________
2021 Arctic Innovator Looks to Advance Technology to Destroy Toxic PFAS ‘Forever Chemicals’ Prevalent Across Alaska
June 7, 2021
https://uaf.edu/oipc/news/2021/2021-arctic-innovator-chris-woodruff.php
___________________________
Toxic chemicals released by melting Arctic ice
Jul 25, 2011
Climate
change is boosting levels of banned pollutants such as PCBs and DDT in
the atmosphere, Canadian, Chinese and Norwegian scientists have found.
A
"wide range" of persistent organic pollutants, or POPs, have been
increasingly released into the Arctic atmosphere since the early 1990s,
says the study led by Environment Canada scientist Jianmin Ma,
"confirming that Arctic warming could undermine global efforts to reduce
environmental and human exposure to these toxic chemicals."
The
study, published Sunday in Nature Climate Change, links higher summer
air temperatures and lower sea ice cover to increasing levels of POPs.
That suggests that POPs previously trapped in water, snow and ice could
be released back into the air as the ice melts, allowing them to travel
long distances through the environment.
https://www.cbc.ca/news/science/toxic-chemicals-released-by-melting-arctic-ice-1.1049162
___________________________
Heavy metals in the atmospheric precipitation on the Barents Sea coast
20 July 2010
https://link.springer.com/article/10.3103/S1068373910050055
___________________________
Norwegian-Russian event: Anthropogenic litter in the Barents Sea - plastic and lost fishing gear
2021
https://www.mynewsdesk.com/no/akvaplan-niva/news/norwegian-russian-event-anthropogenic-litter-in-the-barents-sea-plastic-and-lost-fishing-gear-415379
___________________________
Heavy metals and POPs in red king crab from the Barents Sea
2014 Jul 9
https://pubmed.ncbi.nlm.nih.gov/25149005/
___________________________
Stakeholder Workshop on Marine Litter in the Barents Sea: From sources to solutions
Nov 29, 2021
https://www.uarctic.org/news/2021/11/stakeholder-workshop-on-marine-litter-in-the-barents-sea-from-sources-to-solutions/
___________________________
New Data on the Concentration of Plutonium Isotopes in the Sediments of the Barents Sea
May 2011
https://www.researchgate.net/publication/256103530_New_Data_on_the_Concentration_of_Plutonium_Isotopes_in_the_Sediments_of_the_Barents_Sea
___________________________
A baseline study on levels of polychlorinated dibenzo-p-dioxins, polychlorinated dibenzofurans, non-ortho and mono-ortho PCBs, non-dioxin-like PCBs and polybrominated diphenyl ethers in Northeast Arctic cod (Gadus morhua) from different parts of the Barents Sea
2013 Jul 26
https://pubmed.ncbi.nlm.nih.gov/23896403/
___________________________
Middle Jurassic–Lower Cretaceous glendonites from the eastern Barents Shelf as a tool for paleoenvironmental and paleoclimatic reconstructions
2021
https://www.sciencedirect.com/science/article/abs/pii/S0031018221003850
___________________________
Understanding source terms of anthropogenic uranium in the Arctic Ocean - First 236 U and 233 U dataset in Barents Sea sediments
2022
https://pubmed.ncbi.nlm.nih.gov/35872206/
___________________________
Fears toxic splash in Barents Sea and Baffin Bay from Russian rocket
October 09, 2017
Inuit in Canada and Greenland are calling on Ottawa and Copenhagen to demand the postponement of a Russian rocket launch scheduled to deliver a European Space Agency satellite to orbit next week and look for alternative launch vehicles that use non-toxic propellants for any future launches.
https://thebarentsobserver.com/en/ecology/2017/10/fears-toxic-splash-barents-sea-and-baffin-bay-russian-rocket
___________________________
Content of artificial radionuclides in the birds of the Barents Sea and the Sea of Azov
2003
https://pubmed.ncbi.nlm.nih.gov/12854418/
___________________________
[A radiation situation on the Kola Peninsula, Novaia Zemlia, Franz-Josef Land and in the Barents Sea water]
1993
https://pubmed.ncbi.nlm.nih.gov/8358308/
___________________________
Modeling biomagnification and metabolism of contaminants in Harp seals of the Barents Sea
February 2002
https://www.researchgate.net/publication/11555174_Modeling_biomagnification_and_metabolism_of_contaminants_in_Harp_seals_of_the_Barents_Sea
___________________________
'Whole' reactors lurk under Barents Sea
13 February 1993
https://www.newscientist.com/article/mg13718601-500-whole-reactors-lurk-under-barents-sea/
___________________________
Impact of an iron mine and a nickel smelter at the Norwegian/Russian border close to the Barents Sea on surface soil magnetic susceptibility and content of potentially toxic elements
2017 Dec 15
https://pubmed.ncbi.nlm.nih.gov/29253789/
___________________________
Giant methane burps left scars at the bottom of the Barents Sea
6/8/2017
https://arstechnica.com/science/2017/06/giant-methane-burps-left-scars-at-the-bottom-of-the-barents-sea/
___________________________
Ancient Fault System Feeding Methane to Enormous Craters on Arctic Ocean Seafloor Discovered
6/12/20
https://www.newsweek.com/arctic-sea-methane-craters-fault-system-1510493
___________________________
Kursk submarine disaster
https://en.wikipedia.org/wiki/Kursk_submarine_disaster
___________________________
Lifting Russia’s accident reactors from the Arctic seafloor will cost nearly €300 million
March 08, 2020
Experts are discussing the framework for safe lifting of dumped reactors from four submarines and uranium fuel from one icebreaker reactor in the Kara Sea, in addition to one sunken nuclear submarine in the Barents Sea.
https://thebarentsobserver.com/en/ecology/2020/03/lifting-russias-accident-reactors-arctic-seafloor-will-cost-nearly-eu300-million
___________________________
Russia to Lift Radioactive Time Bombs From Ocean Floor in 2030
Oct. 4, 2021
Two
rusty nuclear submarines will be raised from the sea beds of the
Barents and Kara Seas and brought to a shipyard for safe
decommissioning.
https://www.themoscowtimes.com/2021/10/04/russia-to-lift-radioactive-time-bombs-from-ocean-floor-in-2030-a75207
___________________________
Tackling dumped nuclear waste gets priority in Russia’s Arctic Council leadership
May 23, 2021
The
reactors from the submarines K-11, K-19, and K-140, plus the entire
submarine K-27 and spent uranium fuel from one of the old reactors of
the Lenin-icebreaker have to be lifted from the seafloor and secured.
https://thebarentsobserver.com/en/nuclear-safety/2021/05/lifting-nuclear-waste-kara-sea-gets-priority-russias-arctic-council
___________________________
Heavy metals in the atmospheric precipitation on the Barents Sea coast
2010
https://xueshu.baidu.com/usercenter/paper/show?paperid=6abc3c57d426f0f6bd1c8ad6e28dd80e
___________________________
Fears That the Barents Sea Will Be Filled With Trash
Jan 31 2018
Scientist Geir Wing Gabrielsen has spent every summer for the past 36 years in Svalbard. Today, he fears that the Barents Sea is becoming a garbage dump. – We really need to find out more about this, he says.
https://www.highnorthnews.com/en/fears-barents-sea-will-be-filled-trash
___________________________
Man's Impact on the Barents Sea
1994
https://www.jstor.org/stable/40511662
___________________________
International and regional regulations on vessel source pollution in Barents Sea and Persian Gulf
2014
https://munin.uit.no/bitstream/handle/10037/8359/thesis.pdf;sequence=2
___________________________
Drilling in the Barents Sea Could Lead to Demanding Cooperation Between Norway and Russia
Jun 23 2021
https://www.highnorthnews.com/en/drilling-barents-sea-could-lead-demanding-cooperation-between-norway-and-russia
___________________________
Plastic pollution tendencies of the Barents Sea and adjacent waters under the climate change
September 2018
https://www.researchgate.net/publication/328814855_Plastic_pollution_tendencies_of_the_Barents_Sea_and_adjacent_waters_under_the_climate_change
___________________________
Sediment composition and heavy metal distribution in Barents Sea surface samples: results from Institute of Marine Research 2003 and 2004
2008
https://www.ngu.no/en/publikasjon/sediment-composition-and-heavy-metal-distribution-barents-sea-surface-samples-results
___________________________
Atmosphere–ocean exchange of heavy metals and polycyclic aromatic hydrocarbons in the Russian Arctic Ocean
August 2019
https://www.researchgate.net/publication/334858221_Atmosphere-ocean_exchange_of_heavy_metals_and_polycyclic_aromatic_hydrocarbons_in_the_Russian_Arctic_Ocean
___________________________
Assessment of current natural and anthropogenic radionuclide activity concentrations in the bottom sediments from the Barents Sea
2020
https://www.sciencedirect.com/science/article/abs/pii/S0025326X20306895
___________________________
Persistent organic pollutants in the Pechora Sea walruses
22 January 2019
https://link.springer.com/article/10.1007/s00300-019-02457-9
___________________________
Decades of piled up nuclear fuel bids farewell to Andreyeva Bay
June 23, 2017
Two decades ago, a green four-car train would make the rounds every few months to Russia’s snowy Kola Peninsula to cart nuclear fuel and radioactive waste more than 3000 kilometers south from the Arctic to the Ural Mountains.
https://bellona.org/news/nuclear-issues/2017-06-decades-of-piled-up-nuclear-fuel-bids-farewell-to-andreyeva-bay
___________________________
Selected anthropogenic and natural radioisotopes in the Barents Sea and off the western coast of Svalbard
2013 Sep 17
https://pubmed.ncbi.nlm.nih.gov/24056048/
___________________________
Short-lived 224Ra and 223Ra isotopes in the Anadyr River–Bering Sea system
September 2017
https://www.researchgate.net/publication/320129862_Short-lived_224Ra_and_223Ra_isotopes_in_the_Anadyr_River-Bering_Sea_system
___________________________
Determination of plutonium activity concentrations and 240Pu/239Pu atom ratios in Brown Algae (Fucus distichus) collected from Amchitka Island, Alaska
16 July 2009
https://link.springer.com/article/10.1007/s10967-009-0221-5
___________________________
The Bomb that Cracked an Island
September 27, 2013
Amchitka Island sits at the midway point on the great arc of Alaska’s Aleutian Islands, less than 900 miles across the Bering Sea from the coast of Russia. Amchitka, a spongy landscape of maritime tundra, is one of the most southerly of the Aleutians. The island’s relatively temperate climate has made it one of the Arctic’s most valuable bird sanctuaries, a critical staging ground for more than 100 migratory species, as well as home to walruses, sea otters and sea lions. Off the coast of Amchitka is a thriving fishery of salmon, pollock, haddock and halibut.
All of these values were recognized early on. In 1913, Amchitka was designated as a national wildlife refuge by President William Howard Taft. But these ecological wonders were swept aside in the early ’60s when the Pentagon and the Atomic Energy Commission (AEC) went on the lookout for a new place to blow up H-bombs. Four decades ago, Amchitka was the site of three large underground nuclear tests, including the most powerful nuclear explosion ever detonated by the United States.
The aftershocks of those blasts are still being felt. Despite claims by the AEC and the Pentagon that the test sites would safely contain the radiation released by the blasts for thousands of years, independent research by Greenpeace and newly released documents from the Department of Energy (DOE) show that the Amchitka tests began to leak almost immediately. Highly radioactive elements and gasses, such as tritium, americium-241 and plutonium, poured out of the collapsed test shafts, leached into the groundwater and worked their way into ponds, creeks and the Bering Sea.
At the same time, thousands of Amchitka laborers and Aleuts living on nearby islands were put in harm’s way. Dozens have died of radiation-linked cancers. The response of the federal government to these disturbing findings has been almost as troublesome as the circumstances surrounding the tests themselves: a consistent pattern of indifference, denial and cover-up continues even today.
There were several factors behind the selection of Amchitka as a test site. One most certainly was the proximity to the Soviet Union. These explosions were meant to send a message. Indeed, the tests were designed to calibrate the performance of the Spartan anti-ballistic missile, built to take out the Soviet nuclear arsenal. Publicly, however, the rationale offered by the AEC and the Defense Department was simply that Amchitka was a remote, and therefore safe, testing ground. “The site was selectedand I underscore the pointbecause of the virtually zero likelihood of any damage,” claimed James Schlesinger, then chairman of the AEC.
What Schlesinger and his cohorts overlooked was the remarkable culture of the Aleuts. Amchitka may have been remote from the continental United States, but for nearly 10,000 years it had been the home of the Aleuts. Indeed, anthropologists believe the islands around Amchitka may be the oldest continuously inhabited area in North America. The Aleuts left Amchitka in the 1880s after Russian fur traders had wiped out the sea otter population, but they continued to inhabit nearby islands and relied on the waters near Amchitka for subsistence. The Aleuts raised forceful objections to the tests, pointing to the risk of radiation leaks, earthquakes and tsunamis that might overwhelm their coastal villages. These concerns were never addressed by the federal government. In fact, the Aleuts were never consulted about the possible dangers at all.
In 1965, the Long Shot test exploded an 80 kiloton bomb. The $10 million test, the first one supervised by the Pentagon and not the AEC, was really a trial run for bigger things to come. But small as it was, there were immediate problems. Despite claims by the Pentagon that the test site would not leak, radioactive tritium and krypton-85 began to seep into freshwater lakes almost instantly. But evidence of radioactivity, collected by Defense Department scientists only three months after the test, was kept secret for five years. The bomb site continues to spill toxins into the environment. In 1993, EPA researchers detected high levels of tritium in groundwater samples taken near the test site.
The contamination from Long Shot didn’t deter the Pentagon bomb-testers. In 1969, the AEC drilled a hole 4,000 feet deep into the rock of Amchitka and set off the Milrow nuclear test. The one megaton blast was 10 times as powerful as Long Shot. The AEC called it a “calibration test” designed to see if Amchitka could withstand a much larger test. The evidence should have convinced them of their dangerous folly. The blast triggered a string of small earthquakes and several massive landslides; knocked water from ponds, rivers and lakes more than 50 feet into the air; and, according to government accounts, “turned the surrounding sea to froth.”
A year later, the AEC and the Pentagon announced their plans for the Cannikin nuclear test. At five megatons, Cannikin was to be the biggest underground nuclear explosion ever conducted by the United States. The blast would be 385 times as powerful as the bomb dropped on Hiroshima. Cannikin became a rallying point for native groups, anti-war and anti-nuke activists, and the nascent environmental movement. Indeed, it was opposition to Cannikin by Canadian and American greens, who tried to disrupt the test by taking boats near the island, that sparked the birth of Greenpeace.
A lawsuit was filed in federal court, charging that the test violated the Limited Test Ban Treaty and the newly enacted National Environmental Policy Act. In a 4 to 3 decision, the Supreme Court refused to halt the test. What the Court didn’t know, however, was that six federal agencies, including the departments of State and Interior, and the fledgling EPA, had lodged serious objections to the Cannikin test, ranging from environmental and health concerns to legal and diplomatic problems. Nixon issued an executive order to keep the comments from being released. These documents, known as the Cannikin Papers, came to symbolize the continuing pattern of secrecy and cover-up that typified the nation’s nuclear testing program. Even so, five hours after the ruling was handed down on Nov. 6, 1971, the AEC and the Pentagon pulled the switch, detonating the Cannikin bomb.
In an effort to calm growing public opposition, AEC chief Schlesinger dismissed environmental protesters and the Aleuts as doomsayers, taking his family with him to watch the test. “It’s fun for the kids and my wife is delighted to get away from the house for awhile,” he quipped.
With the Schlesingers looking on, the Cannikin bomb, a 300-foot-long device implanted in a mile-deep hole under Cannikin lake, exploded with the force of an earthquake registering 7.0 on the Richter Scale. The shock of the blast scooped a mile-wide, 60-foot-deep subsidence crater in the ground over the test site and triggered massive rockfalls.
The immediate ecological damage from the blast was staggering. Nearly 1,000 sea otters, a species once hunted to near extinction, were killedtheir skulls crushed by the shockwaves of the explosion. Other marine mammals died when their eyes were blown out of their sockets or when their lungs ruptured. Thousands of birds also perished, their spines snapped and their legs pushed through their bodies. (Neither the Pentagon nor the Fish and Wildlife Service has ever studied the long-term ecological consequences of the Amchitka explosions.) Most worrisome was that a large volume of water from White Alice Creek vanished after the blast. The disappearance of the creek was more than a sign of Cannikin’s horrific power. It was also an indication that the project had gone terribly wrong; the blast ruptured the crust of the earth, sucking the creek into a brand new aquifer, a radioactive one.
In the months following the explosion, blood and urine samples were taken from Aleuts living in the village of Adak on a nearby island. The samples were shown to have abnormally high levels of tritium and cesium-137, both known carcinogens. Despite these alarming findings, the feds never went back to Adak to conduct follow-up medical studies. The Aleuts, who continue their seafaring lifestyle, are particularly vulnerable to radiation-contaminated fish and marine mammals, and radiation that might spread through the Bering Sea, plants and iceflows.
But the Aleuts weren’t the only ones exposed to Cannikin’s radioactive wrath. More than 1,500 workers who helped build the test sites, operate the bomb tests and clean up afterward were also put at risk. The AEC never conducted medical studies on any of these laborers. When the Alaska District Council of Laborers of the AFL-CIO, began looking into the matter in the early ’90s, the DOE claimed that none of the workers had been exposed to radiation. They later were forced to admit that exposure records and dosimeter badges had been lost.
In 1996, two Greenpeace researchers, Pam Miller and Norm Buske, returned to Amchitka. Buske, a physicist, collected water and plant samples from various sites on the island. Despite claims by the DOE that the radiation would be contained, the samples taken by Buske revealed the presence of plutonium and americium-241 in freshwater plants at the edge of the Bering Sea. In other words, Cannikin continues to leak. Both of these radioactive elements are extremely toxic and have half-lives of hundreds of years.
In part because of the report issued by Miller and Buske, a new sense of urgency was lent to the claims of laborers who said they had become sick after working at the Amchitka nuclear site. In 1998, the union commissioned a study by Rosalie Bertell, a former consultant to the Nuclear Regulatory Commission (which replaced the AEC). Bertell found that hundreds of Amchitka workers were exposed to ionizing radiation at five times the level then recognized as hazardous. However, the research is complicated by the fact that many of the records from the Amchitka blast remain classified and others were simply tossed away. “The loss of worker exposure records, or the failure to keep such records, was inexcusable,” Bertell says.
One of the driving forces behind the effort to seek justice for the Amchitka workers and the Aleuts is Beverley Aleck. Her husband Nick helped drill the mile-deep pit for the Cannikin test; four years later, he died of myelogenous leukemia, a type of cancer associated with radiation exposure. Aleck, an Aleut, has waged a multi-year battle with the DOE to open the records and to begin a health monitoring program for the Amchitka workers. For more than four decades promised health surveys of the Amchitka workers have languished without funding.
Will the victims of the Amchitka blasts ever get justice? Don’t count on it. For starters, the Aleuts and Amchitka workers are specifically excluded by the Radiation Exposure Compensation Act from receiving medical assistance, death benefits or financial compensation. There is a move to amend this legal loophole, but even that wouldn’t mean the workers and Aleuts would be treated fairly. The DOE has tried repeatedly to stiff arm other cases by either dismissing the link between radiation exposure and cancer or, when that fails, invoking a “sovereignty” doctrine, which claims the agency is immune from civil lawsuits.
Dr. Paul Seligman, former deputy assistant secretary of the DOE’s Office of Health Studies, writes it off as the price of the Cold War. “These were hazardous operations,” Seligman says. “The hazards were well understood, but the priorities at the time were weapons production and the defense of the nation.”
At a time when the mainstream press and Republican politicians are howling over lax security at nuclear weapons sites and Chinese espionage, a more dangerous betrayal of trust is the withholding of test data from the American public. China may use the Los Alamos secrets to upgrade its tiny nuclear arsenal, but the Amchitka explosions already have imperiled a thriving marine ecosystem and caused dozens of lethal cancers.
The continuing cover-up and manipulation of information by the DOE not only denies justice to the victims of Amchitka, but indicates that those living near other DOE sites may be at great risk. “DOE management of the U.S. nuclear weapons complex is of the old school in which bad news is hidden,” says Pamela Miller, now executive director of Alaska Community Action on Toxics. “This conflicts with sound risk management and makes the entire system inherently risky. The overwhelming threat is of an unanticipated catastrophe.”
https://www.counterpunch.org/2013/09/27/the-bomb-that-cracked-an-island/
___________________________
Organochlorine pesticides (OCPs) and polychlorinated
biphenyls (PCBs) in Pacific salmon from the Kamchatka Peninsula and
Sakhalin Island, Northwest Pacific
August 2021
https://www.researchgate.net/publication/351778746_Organochlorine_pesticides_OCPs_and_polychlorinated_biphenyls_PCBs_in_Pacific_salmon_from_the_Kamchatka_Peninsula_and_Sakhalin_Island_Northwest_Pacific
___________________________
High mercury bioaccumulation in Pacific salmons from the Sea of Okhotsk and the Bering Sea
18 January 2018
https://link.springer.com/article/10.1007/s10311-018-0704-0
___________________________
Bioaccumulation of HCHs and DDTs in organs of Pacific salmon (genus Oncorhynchus) from the Sea of Okhotsk and the Bering Sea
2016 May 21
Abstract
Concentrations of isomers of hexachlorocyclohexane (α-, β-, γ-HCH) and
dichlorodiphenyltrichloroethane (DDT) and its metabolites
(dichlorodiphenyldichloroethane (DDD) and
dichlorodiphenyldichloroethylene (DDE) were assessed in organs of the
pink (Oncorhynchus gorbuscha), chum (Oncorhynchus keta), chinook
(Oncorhynchus tshawytscha), and sockeye salmon (Oncorhynchus nerka),
caught near the Kuril Islands (the northern-western part of the Pacific
Ocean), in the Sea of Okhotsk and the Bering Sea. Pesticides have been
found to accumulate in fish organs in the following: muscles < liver
< eggs < male gonads. The highest concentrations in muscles and
liver have been recorded from sockeye. Of the DDT group, only DDE has
been detected. The average concentration of HCHs + DDE in the muscles of
pink, chum, chinook, and sockeye was 141, 125, 1241, 1641 ng/g lipids,
respectively; and in the liver, 279, 183, 1305, 3805 ng/g lipids,
respectively. The total concentration of HCHs isomers was higher than
that of DDE. Average HCHs + DDE concentration in organs of salmon from
study area is lower than that in salmon from Pacific coast of North
America.
https://pubmed.ncbi.nlm.nih.gov/27219293/
___________________________
Current Levels of Organochlorine Pesticides in Marine Ecosystems of the Russian Far Eastern Seas
08 October 2020
https://link.springer.com/article/10.1134/S199542551906009X
___________________________
Bioindicators of Organochlorine Pesticides in the Sea of Okhotsk and the Western Bering Sea
20 May 2017
https://link.springer.com/article/10.1007/s00244-017-0380-2
___________________________
Mercury in organs of Pacific walruses (Odobenus rosmarus divergens) from the Bering Sea
2017 Nov 18
https://pubmed.ncbi.nlm.nih.gov/29151185/
___________________________
Murre eggs (Uria aalge and Uria lomvia) as indicators of mercury contamination in the Alaskan marine environment
2005
https://pubmed.ncbi.nlm.nih.gov/16509300/
___________________________
Mercury and methylmercury distribution in tissues of sculpins from the Bering Sea.
2015
https://europepmc.org/article/PMC/PMC5283796
___________________________
Persistent organic pollutants in bottom and pelagic fish from the Sea of Okhotsk
2018
https://meetings.pices.int/Publications/Presentations/PICES-2018/MEQ-D1-1650-Lukyanova.pdf
___________________________
Postdoc position within relative sea level data and databases
24/06/2022
https://www.euraxess.gov.ro/ro/node/804019
___________________________
New data reveals extraordinary global heating in the Arctic
15 Jun 2022
Temperatures in the Barents Sea region are ‘off the scale’ and may affect extreme weather in the US and Europe
https://www.theguardian.com/environment/2022/jun/15/new-data-reveals-extraordinary-global-heating-in-the-arctic
___________________________
'Off the Scale': Warmer Arctic Ocean Fueling Climate Feedback Loop Faster Than Previously Known
2022
"This is one of the scariest reports I have ever seen," said one climate scientist in response to new study.
https://www.commondreams.org/news/2022/06/15/scale-warmer-arctic-ocean-fueling-climate-feedback-loop-faster-previously-known
___________________________
Climate Toll on Arctic Bases: Sunken Runways, Damaged Roads
2022
The
Pentagon's inspector general's office says U.S. military bases in the
Arctic and sub-Arctic are failing to prepare their installations for
future climate change as required.
https://www.usnews.com/news/politics/articles/2022-04-15/climate-toll-on-arctic-bases-sunken-runways-damaged-roads
___________________________
Codify Arctic Refuge Protections, Say Campaigners Amid Big Oil Exodus
June 2, 2022
"We
support Congress and the Biden administration taking long-overdue
action to... reestablish protections for this crown jewel of our
national wildlife refuge system," said one activist.
https://www.commondreams.org/news/2022/06/02/codify-arctic-refuge-protections-say-campaigners-amid-big-oil-exodus
___________________________
The Arctic This Week Take Five: Week of May 2, 2022
https://www.thearcticinstitute.org/arctic-week-take-five-week-may-2-2022/
___________________________
'Arctic Angels' assist with 2022 Colony Glacier recovery efforts
June 22, 2022
https://www.army.mil/article/257814/arctic_angels_assist_with_2022_colony_glacier_recovery_efforts
___________________________
Carbon dioxide “has almost nothing to do with climate,” says World Climate Declaration signatory (Controversial)
05/04/2022
https://www.rcinet.ca/eye-on-the-arctic/2022/07/01/microbe-discovery-in-arctic-canada-could-help-better-understand-life-on-mars/
___________________________
Heat Waves In Antarctica and the Arctic
March 21, 2022
https://newsforkids.net/articles/2022/03/21/heat-waves-in-antarctica-and-the-arctic/
___________________________
Arctic heat waves linked to sea ice loss, new study reveals
August 29, 2024
https://phys.org/news/2024-08-arctic-linked-sea-ice-loss.html
___________________________
Summer 2024 was Lapland's warmest in 2,000 years, tree ring study shows
April 28, 2025
https://phys.org/news/2025-04-summer-lapland-warmest-years.html
___________________________
Early Archean serpentine mud volcanoes at Isua, Greenland, as a niche for early life.
2011
https://europepmc.org/article/PMC/3203773
___________________________
Commodities Trader Trafigura Reviews Stake in Russian Arctic Oil Project
2022
https://www.wsj.com/livecoverage/russia-ukraine-latest-news-2022-03-02/card/commodities-trader-trafigura-reviews-stake-in-russian-arctic-oil-project-NteH6gXbEgDVW6TIOsqg
___________________________
Arctic sea ice winter peak in 2022 is 10th lowest on record
2022
https://www.carbonbrief.org/arctic-sea-ice-winter-peak-in-2022-is-10th-lowest-on-record/
___________________________
Arctic Methane Threat: Global Warming Increasing Bacterial Methanogenesis & Methane Release
2022
https://countercurrents.org/2022/02/arctic-methane-threat-global-warming-increasing-bacterial-methanogenesis-methane-release/
___________________________
Danish-Canadian deal ends 49-year-old feud over Arctic isle
June 14, 2022
A decades-old dispute between Denmark and Canada over a tiny, barren and uninhabited rock in the Arctic has come to an end
https://abcnews.go.com/International/wireStory/danish-canadian-deal-ends-49-year-feud-arctic-85378448
___________________________
Red alert: Portions of the Arctic are warming much faster than we thought
2022
"What's happening in the far north is off the scale."
https://www.salon.com/2022/06/20/red-alert-portions-of-the-arctic-are-warming-much-faster-than-we-thought_partner/
-
___________________________
A new Iron Curtain is eroding Norway’s hard-won ties with Russia on Arctic issues
May 2, 2022
https://www.ktoo.org/2022/05/02/russia-norway-nato-arctic-council/
___________________________
If you’re not thinking about the climate impacts of thawing permafrost, (here’s why) you should be
30 January 2022
https://news.un.org/en/story/2022/01/1110722
___________________________
The worst polluters in the Arctic are not what you think
06.05.2022
More
than 600 fishing vessels sail the icy waters of the Arctic. But just
over two dozen big tankers are the worst offenders when it comes to air
pollution in this vulnerable region.
https://norwegianscitechnews.com/2022/05/the-worst-polluters-in-the-arctic-are-not-what-you-think/
___________________________
Local Arctic Air Pollution: A Neglected but Serious Problem
03 September 2018
https://agupubs.onlinelibrary.wiley.com/doi/full/10.1029/2018EF000952
___________________________
Air pollution alters the atmosphere in the remote Arctic
09-26-2024
https://www.earth.com/news/air-pollution-alters-the-atmosphere-in-the-remote-arctic/
___________________________
Gray whales are dying along the Pacific coast
March 16, 2022
https://edition.cnn.com/interactive/2022/03/climate/gray-whale-pacific-arctic-climate-change/
___________________________
Giant sponge gardens discovered on the peaks of extinct volcanoes under Arctic sea ice
8 Feb 2022
https://www.abc.net.au/news/science/2022-02-09/sponge-arctic-ocean-sea-ice-volcanoes/100810816
___________________________
Alaska Native news
https://alaska-native-news.com/category/alaskas-arctic/
___________________________
'Major winter storm' to bring Arctic temperatures to millions of Americans
21 February 2022
Forecasters
have warned temperatures will drop by up to 30 degrees in some places
with some cities seeing a sharp polar plunge in the next 48 hours.
https://news.sky.com/story/major-winter-storm-to-bring-arctic-temperatures-to-millions-of-americans-12547799
___________________________
Arctic sea ice decline
https://en.wikipedia.org/wiki/Arctic_sea_ice_decline
___________________________
Millions locked in a deep freeze as arctic air leads to coldest day since 2019
2019
Wind
chills Tuesday morning were as cold as 30 degrees below zero in some
spots. Temperatures that cold can lead to frostbite in mere minutes.
https://www.nbcnews.com/news/weather/millions-locked-deep-freeze-arctic-air-leads-coldest-day-2019-rcna11753
___________________________
Study clarifies Arctic impacts on British winters
6 Feb 2022
https://www.metoffice.gov.uk/about-us/press-office/news/weather-and-climate/2022/arctic-sea-ice-impacts-on-british-winters
___________________________
Taiwanese arctic research station opens in Norway
2022
https://www.taipeitimes.com/News/taiwan/archives/2022/06/26/2003780589
___________________________
Italy Halts Funding For $21 Billion Arctic LNG 2 Project
Mar 02, 2022
https://oilprice.com/Latest-Energy-News/World-News/Italy-Halts-Funding-For-21-Billion-Arctic-LNG-2-Project.html
___________________________
Holes the size of city blocks are forming in the Arctic seafloor
2022
https://edition.cnn.com/2022/03/14/world/arctic-seafloor-holes-permafrost-scn/index.html
___________________________
Wildfires Are Fueling a Dangerous Feedback Loop of Arctic Warming
3/18/22
Brown carbon released by fires is ending up in the Arctic and absorbing sunlight, a study found.
https://gizmodo.com/wildfires-are-fueling-a-dangerous-feedback-loop-of-arct-1848667999
___________________________
CLOUD at CERN reveals the role of iodine acids in atmospheric aerosol formation
5 February, 2021
The results suggest a new mechanism that could accelerate the loss of Arctic sea ice
https://home.cern/news/news/experiments/cloud-cern-reveals-role-iodine-acids-atmospheric-aerosol-formation
___________________________
Stratospheric Aerosol Injection (technology briefing)
https://www.geoengineeringmonitor.org/2021/02/stratospheric_aerosol_injection/
___________________________
Controversial spraying method aims to curb global warming
November 23, 2018
https://www.cbsnews.com/news/geoengineering-treatment-stratospheric-aerosol-injection-climate-change-study-today-2018-11-23/
___________________________
Solid Aerosols Found in the Arctic Can Affect the Cloud and Climate Formation: New Study
Mar 29, 2022
https://www.natureworldnews.com/articles/50136/20220329/solid-aerosols-found-arctic-affect-cloud-climate-formation-according-study.htm
___________________________
Annual distributions and sources of Arctic aerosol components, aerosol optical depth, and aerosol absorption
2014
https://ro.uow.edu.au/smhpapers/1628/
___________________________
New insights into aerosol and climate in the Arctic
https://pure.mpg.de/pubman/faces/ViewItemOverviewPage.jsp?itemId=item_3029769
___________________________
A North American Arctic aerosol climatology using ground-based sunphotometry.
2002
https://www.thefreelibrary.com/A+North+American+Arctic+aerosol+climatology+using+ground-based...-a092746499
___________________________
Aerosol optical properties over the Svalbard region of Arctic: ground-based measurements and satellite remote sensing
2016
https://www.deepdyve.com/lp/spie/aerosol-optical-properties-over-the-svalbard-region-of-arctic-ground-erfbqxtnzJ
___________________________
Arctic Study of Tropospheric Aerosol and Radiation
2005
(ASTAR) 2000: Arctic haze case study
https://www.tandfonline.com/doi/pdf/10.3402/tellusb.v57i2.16784
___________________________
Warming Arctic reduces dust levels in parts of the planet, study finds
April 25, 2024
https://phys.org/news/2024-04-arctic-planet.html
___________________________
Arctic dust found to be a major source of particles that form ice crystals in Arctic low-level clouds
July 7, 2023
Researchers from Nagoya University and the National Institute of Polar Research in Japan have found that dust from land without snow cover in the Arctic is a major source of particles that form ice crystals in low-level clouds of the Arctic (at altitudes below about 3 km) during summer and fall.
The formation of ice crystals in low-level clouds is considered to affect climate because it can cause ice particles
to grow at the expense of liquid droplets and then fall as
precipitation, resulting in a lower sunlight reflectance and a shorter
lifetime for clouds.
https://phys.org/news/2023-07-arctic-major-source-particles-ice.html
___________________________
New insights into the formation of tiny cloud particles in the Arctic
June 21, 2024
https://phys.org/news/2024-06-insights-formation-tiny-cloud-particles.html
___________________________
Arctic lake sediment records reveal unexpected storm patterns
November 11, 2024
https://phys.org/news/2024-11-arctic-lake-sediment-reveal-unexpected.html
___________________________
Rare thunderstorm near the North Pole: A sign of a warming Arctic?
April 16, 2025
https://phys.org/news/2025-04-rare-thunderstorm-north-pole-arctic.html
___________________________
Arctic cyclones could be missing link in sea ice depletion models
February 12, 2025
https://phys.org/news/2025-02-arctic-cyclones-link-sea-ice.html
___________________________
Absorption instruments inter-comparison campaign at the Arctic Pallas station
2021
https://amt.copernicus.org/articles/14/5397/2021/
___________________________
Aethalometer Measurements of Equivalent Black Carbon in the Arctic
23 April 2013
https://psl.noaa.gov/iasoa/node/81
___________________________
Decadal increase in Arctic dimethylsulfide emission
September 9, 2019
https://www.pnas.org/doi/10.1073/pnas.1904378116
___________________________
Solid aerosols found in Arctic atmosphere could impact cloud formation
Mar 30, 2022
https://www.spacedaily.com/reports/Solid_aerosols_found_in_Arctic_atmosphere_could_impact_cloud_formation_and_climate_999.html
___________________________
Elucidating the Role of Anthropogenic Aerosols in Arctic Sea Ice Variations
01 Jan 2018
https://journals.ametsoc.org/view/journals/clim/31/1/jcli-d-17-0287.1.xml
___________________________
Stratospheric aerosol injection
https://en.wikipedia.org/wiki/Stratospheric_aerosol_injection
___________________________
Scientists map Arctic aerosols to better understand regional warming
1 March 2022
https://www.psi.ch/en/media/our-research/scientists-map-arctic-aerosols
___________________________
Black carbon aerosols heating Arctic: Large contribution from mid-latitude biomass burning
2021
https://wattsupwiththat.com/2021/11/05/black-carbon-aerosols-heating-arctic-large-contribution-from-mid-latitude-biomass-burning/
___________________________
Aerosol black carbon over Svalbard regions of Arctic
2015
https://www.sciencedirect.com/science/article/pii/S1873965215300189
___________________________
Aerosols in current and future Arctic climate
1 February 2021
https://www.semanticscholar.org/paper/Aerosols-in-current-and-future-Arctic-climate-Schmale-Zieger/8d0e6838571a85dae468fc864f4e6e78e9c9b709
___________________________
Annual cycle observations of aerosols capable of ice formation in central Arctic clouds
20 June 2022
https://www.nature.com/articles/s41467-022-31182-x
___________________________
Solid aerosols found in Arctic atmosphere could impact cloud formation and climate
March 28, 2022
https://www.sciencedaily.com/releases/2022/03/220328165339.htm
___________________________
A characterization of Arctic aerosols on the basis of aerosol optical depth and black carbon measurements
June 10 2014
https://online.ucpress.edu/elementa/article/doi/10.12952/journal.elementa.000027/112941/A-characterization-of-Arctic-aerosols-on-the-basis
___________________________
Molecular markers of biomass burning in arctic aerosols
2013 Jul 16
https://pubmed.ncbi.nlm.nih.gov/23808421/
___________________________
Modeling of observed mineral dust aerosols in the arctic and the impact on winter season low-level clouds
2013
https://www.academia.edu/82301125/Modeling_of_observed_mineral_dust_aerosols_in_the_arctic_and_the_impact_on_winter_season_low_level_clouds
___________________________
Non-ignorable contribution of anthropogenic source to aerosols in Arctic Ocean
2021
https://www.sciencedirect.com/science/article/abs/pii/S001393512100832X
___________________________
Black carbon aerosols heating Arctic: Large contribution from mid-latitude biomass burning
4-Nov-2021
The
year-to-year spring variation in Arctic black carbon (BC) aerosol
abundance is strongly correlated with biomass burning in the
mid-latitudes. Moreover, current models underestimate the contribution
of BC from biomass burning by a factor of three.
https://www.eurekalert.org/news-releases/933667
___________________________
Chemical and geochemical composition of spring-summer Arctic aerosol collected at Ny Alesund, Svalbard Islands
2017
https://www.academia.edu/80533056/Chemical_and_geochemical_composition_of_spring_summer_Arctic_aerosol_collected_at_Ny_Alesund_Svalbard_Islands
___________________________
Solid Aerosols Found in Arctic Atmosphere Could Impact Cloud Formation and Climate
29 March 2022
https://www.enn.com/articles/70007-solid-aerosols-found-in-arctic-atmosphere-could-impact-cloud-formation-and-climate
___________________________
Solid aerosols found in Arctic atmosphere could impact cloud formation and climate
2022
https://article.wn.com/view/2022/03/29/Solid_aerosols_found_in_Arctic_atmosphere_could_impact_cloud_s/
___________________________
New research aerosol stations in the Russian Arctic
2019
https://peexhq.home.blog/2019/12/11/new-research-aerosol-stations-in-the-russian-arctic/
___________________________
Arctic Exploration Timeline
https://americanpolar.org/about/arctic-exploration-timeline/
___________________________
Atmospheric HULIS and its ability to mediate the reactive oxygen species (ROS): A review
2017
https://www.sciencedirect.com/science/article/abs/pii/S1001074217314171
___________________________
Fluorescence characteristics of water-soluble organic carbon in atmospheric aerosol
2020
https://www.sciencedirect.com/science/article/abs/pii/S0269749120365957
___________________________
Aerosol remote sensing in polar regions
2014
https://www.sciencedirect.com/science/article/abs/pii/S0012825214001913
___________________________
Brown carbon in the cryosphere: Current knowledge and perspective
2016
https://www.sciencedirect.com/science/article/pii/S1674927816300302
___________________________
Levoglucosan as a tracer of biomass burning: Recent progress and perspectives
2019
https://www.sciencedirect.com/science/article/pii/S0169809518311098
___________________________
Global Transport of Anthropogenic Contaminants and the Consequences for the Arctic Marine Ecosystem
1999
https://www.sciencedirect.com/science/article/abs/pii/S0025326X99000417
___________________________
Role of organic acids (formic, acetic, pyruvic and oxalic) in the formation of cloud condensation nuclei (CCN): a review
2000
https://www.sciencedirect.com/science/article/pii/S0169809500000375
___________________________
Chapter 5 - Characterization of Mixed-Phase Clouds: Contributions From the Field Campaigns and Ground Based Networks
2018
https://www.sciencedirect.com/science/article/pii/B9780128105498000052
___________________________
Role of organic acids (formic, acetic, pyruvic and oxalic) in the formation of cloud condensation nuclei (CCN): a review
2000
https://www.sciencedirect.com/science/article/pii/S0169809500000375
___________________________
Chapter 16 - Optical properties of brown carbon in aerosols and surface snow at Ny-Ålesund during the polar summer
2021
This study reports the characterization of optical properties of Arctic
aerosol and surface snow collected at Ny-Ålesund, Svalbard during the
polar summer. Methanol-soluble brown carbon (BrC) extracts showed higher
absorption coefficients at 300 nm compared to water-soluble BrC and
also exhibited a tail of absorption toward higher wavelengths due to the
presence of polyconjugated and/or nitroaromatic systems. Fluorescence
spectra for water extract for air and snow samples showed peaks at ~340 nm
indicating the presence of protein-like fluorophores, possibly from
sea-to-air emission of marine organics and secondary formation of
aerosols. Air mass back trajectories also suggested the potential
contribution of forest fires from Alaska and Russia to BrC aerosol in
the Arctic.
https://www.sciencedirect.com/science/article/pii/B9780128228692000220
___________________________
Arctic Aerosols
https://www.sciencedirect.com/topics/earth-and-planetary-sciences/arctic-aerosols
___________________________
Black carbon aerosols heating the Arctic: Large contribution from mid-latitude biomass burning
November 4, 2021
https://phys.org/news/2021-11-black-carbon-aerosols-arctic-large.html
___________________________
Modelling wintertime Arctic Haze and sea-spray aerosols
2022
https://egusphere.copernicus.org/preprints/2022/egusphere-2022-310/
___________________________
Aerosols May Drive a Significant Portion of Arctic Warming
2009
https://www.nasa.gov/topics/earth/features/warming_aerosols.html
___________________________
How do we know the age of the seafloor?
https://www.earthobservatory.sg/earth-science-education/earth-science-faqs/geology-and-tectonics/how-do-we-know-the-age-of-the-seafloor
___________________________
Earth's Inconstant Magnetic Field
2003
Our
planet's magnetic field is in a constant state of change, say
researchers who are beginning to understand how it behaves and why.
https://www.nasa.gov/vision/earth/lookingatearth/29dec_magneticfield.html
___________________________
What Is Magnetic Polarity?
May 21, 2024
https://www.allthescience.org/what-is-magnetic-polarity.htm
___________________________
Giant caldera in the Arctic Ocean: Evidence of the catastrophic eruptive event
10 April 2017
Abstract
A giant caldera located in the eastern segment of the Gakkel Ridge could
be firstly seen on the bathymetric map of the Arctic Ocean published in
1999. In 2014, seismic and multibeam echosounding data were acquired at
the location. The caldera is 80 km long, 40 km wide and 1.2 km deep.
The total volume of ejected volcanic material is estimated as no less
than 3000 km3 placing it into the same category with the
largest Quaternary calderas (Yellowstone and Toba). Time of the eruption
is estimated as ~1.1 Ma. Thin layers of the volcanic material related
to the eruption had been identified in sedimentary cores located about
1000 km away from the Gakkel Ridge. The Gakkel Ridge Caldera is the
single example of a supervolcano in the rift zone of the Mid-Oceanic
Ridge System.
https://www.nature.com/articles/srep46248
___________________________
Advanced
geophysical studies of accretion of oceanic lithosphere in Mid-Ocean
Ridges characterized by contrasting tectono-magmatic settings
2012
https://dspace.mit.edu/handle/1721.1/70780
___________________________
Magnetic Reversals and Sea-Floor Spreading
2016
___________________________
Researchers reveal the dynamic processes that sculpt the Arctic seafloor
October 8, 2024
https://phys.org/news/2024-10-reveal-dynamic-sculpt-arctic-seafloor.html
___________________________
Russia's Hephaestus mud volcano erupts chucking muck hundreds of meters (VIDEO)
25 Feb 2018
https://www.sott.net/article/378402-Russias-Hephaestus-mud-volcano-erupts-chucking-muck-hundreds-of-meters-VIDEO
___________________________
Discovery
of novel cold-active antifungals from polar bacteria isolated from the
Canadian high arctic that are active against major spoilage fungi in the
cheese industry
August 2021
https://escholarship.mcgill.ca/downloads/rv0430112
___________________________
Determining polar ionospheric electrojet currents from Swarm satellite constellation magnetic data
05 August 2016
https://earth-planets-space.springeropen.com/articles/10.1186/s40623-016-0509-y
___________________________
Lithospheric Magnetic Anomalies of the Eastern Part of the Arctic Ocean as Images of Tectonic Structures
December 2021
https://ui.adsabs.harvard.edu/abs/2021IzAOP..57.1021A/abstract
___________________________
Earth actually has Four north Poles
2020
https://www.discovermagazine.com/planet-earth/earth-actually-has-four-north-poles
___________________________
Volcanic Eruptions May Be Rapidly Melting Arctic Ice Sheets, Study Says
October 26, 2017
https://weather.com/news/climate/news/2017-10-25-arctic-sea-ice-volcanic-eruption-trigger-melting
___________________________
Deep-biosphere methane production stimulated by geofluids in the Nankai accretionary complex
13 Jun 2018
https://www.science.org/doi/10.1126/sciadv.aao4631
___________________________
Methane seep community of the Håkon Mosby mud volcano (the Norwegian Sea): composition and trophic aspects
19 Oct 2011
https://www.tandfonline.com/doi/abs/10.1080/00364820310003190?journalCode=ssar20
___________________________
Ocean floor mud reveals secrets of past European climate
2017
https://phys.org/news/2017-11-ocean-floor-mud-reveals-secrets.html
___________________________
On the Role of Climate Forcing by Volcanic Sulphate and Volcanic Ash
2014
https://www.hindawi.com/journals/amete/2014/340123/
___________________________
Q&A: What happens when a volcano beneath a glacier erupts?
October 11, 2016
Scientists studying Iceland's Eyjafjallajökull volcano took a close look
https://beta.nsf.gov/news/qa-what-happens-when-volcano-beneath-glacier-erupts
___________________________
Hydrothermal Underwater Volcanoes and Bacteria iron, sulfur, methane eating bacteria
http://volcanoexperience.com/hydrothermal.html
___________________________
Geomechanical characterization of mud volcanoes using P-wave velocity datasets
2022
https://www.research.manchester.ac.uk/portal/files/47102441/Accepted_Paper.pdf
___________________________
Novel microbial communities of the Haakon Mosby mud volcano and their role as a methane sink
2006
https://epic.awi.de/id/eprint/14471/
___________________________
Early Archean serpentine mud volcanoes at Isua, Greenland, as a niche for early life
2011
https://www.jstor.org/stable/41352570
___________________________
Iceland’s recent volcanic eruptions driven by pooling magma are set to last centuries into the future
July 31, 2024
___________________________
Lava bleeds from Iceland volcano into the frozen landscape in incredible satellite image
February 9, 2024
A volcano on Iceland's Reykjanes Peninsula erupted for the third time in three months, sending lava 2.8 miles west from the huge fissure in Earth's surface.

An overview image of the eruption was captured by the SENTINEL-2 satellite (Copernicus EU) on Feb. 8 at 13:04 UTC.
___________________________
Iceland battles a lava flow: Countries have built barriers and tried explosives in the past, but it’s hard to stop molten rock
Jan. 14, 2024
___________________________
Volcanism of Iceland
https://en.wikipedia.org/wiki/Volcanism_of_Iceland
___________________________
Is Iceland entering a new volcanic era?
9 February 2024
This week, Iceland woke up to yet another day of fire, as towering fountains of lava lit up the dark morning sky.
This time the evacuated town of Grindavik was spared, but the molten rock still wreaked havoc - engulfing a pipe that provides heat and hot water to thousands living in the area and cutting off a road to the Blue Lagoon tourist attraction.
It is the third short-lived eruption on the Reykjanes peninsula since December 2023 and the sixth since 2021. But scientists think this is just the start of a period of volcanic activity that could last for decades or even centuries.
https://www.bbc.com/news/science-environment-68255375
___________________________
Iceland’s Recent Volcanic Eruptions Are Unleashing Deep Secrets
February 21, 2024
Each dramatic episode over the past few years has led to fresh geologic revelations, and researchers think another bout is on the way

___________________________
Methane cold seeps as biological oases in the high-Arctic deep sea
27 October 2017
Abstract
Cold seeps can support unique faunal communities via chemosynthetic
interactions fueled by seabed emissions of hydrocarbons. Additionally,
cold seeps can enhance habitat complexity at the deep seafloor through
the accretion of methane derived authigenic carbonates (MDAC). We
examined infaunal and megafaunal community structure at high-Arctic cold
seeps through analyses of benthic samples and seafloor photographs from
pockmarks exhibiting highly elevated methane concentrations in
sediments and the water column at Vestnesa Ridge (VR), Svalbard (79° N).
Infaunal biomass and abundance were five times higher, species richness
was 2.5 times higher and diversity was 1.5 times higher at methane-rich
Vestnesa compared to a nearby control region. Seabed photos reveal
different faunal associations inside, at the edge, and outside Vestnesa
pockmarks. Brittle stars were the most common megafauna occurring on the
soft bottom plains outside pockmarks. Microbial mats, chemosymbiotic
siboglinid worms, and carbonate outcrops were prominent features inside
the pockmarks, and high trophic-level predators aggregated around these
features. Our faunal data, visual observations, and measurements of
sediment characteristics indicate that methane is a key environmental
driver of the biological system at VR. We suggest that chemoautotrophic
production enhances infaunal diversity, abundance, and biomass at the
seep while MDAC create a heterogeneous deep-sea habitat leading to
aggregation of heterotrophic, conventional megafauna. Through this
combination of rich infaunal and megafaunal associations, the cold seeps
of VR are benthic oases compared to the surrounding high-Arctic deep
sea.
https://aslopubs.onlinelibrary.wiley.com/doi/10.1002/lno.10732
___________________________
Endosymbioses
between bacteria and deep-sea siboglinid tubeworms from an Arctic Cold
Seep (Haakon Mosby Mud Volcano, Barents Sea).
14 Aug 2008,
https://europepmc.org/article/MED/18707616
___________________________
Active mud volcanoes on the continental slope of the Canadian Beaufort Sea
2015
https://oceanrep.geomar.de/id/eprint/30718/1/Paull_et_al-2015-Geochemistry,_Geophysics,_Geosystems.pdf
___________________________
Early Archean serpentine mud volcanoes at Isua, Greenland, as a niche for early life
2011
https://www.academia.edu/48720378/Early_Archean_serpentine_mud_volcanoes_at_Isua_Greenland_as_a_niche_for_early_life
___________________________
The small-sized benthic biota of the Håkon Mosby Mud Volcano (SW Barents Sea slope)
2005
https://www.academia.edu/6765070/The_small_sized_benthic_biota_of_the_H%C3%A5kon_Mosby_Mud_Volcano_SW_Barents_Sea_slope
___________________________
Fate of vent-derived methane in seawater above the Håkon Mosby mud volcano (Norwegian Sea)
2003
https://www.sciencedirect.com/science/article/abs/pii/S0304420303000318
___________________________
Distinct methane-dependent biogeochemical states in Arctic seafloor gas hydrate mounds
2021 Nov 2
https://www.ncbi.nlm.nih.gov/pmc/articles/PMC8563959/
___________________________
Cold Seeps in a Warming Arctic: Insights for Benthic Ecology
2020
https://www.frontiersin.org/articles/10.3389/fmars.2020.00244/full
___________________________
Discriminative
biogeochemical signatures of methanotrophs in different chemosynthetic
habitats at an active mud volcano in the Canadian Beaufort Sea
26 November 2019
https://www.nature.com/articles/s41598-019-53950-4
___________________________
Unlocking the mysteries of the Arctic seafloor
2021
https://www.mbari.org/unlocking-the-mysteries-of-the-arctic-seafloor/
___________________________
Methane Eating Bacteria Found in Icy Arctic Water
Oct 20, 2006
https://news.softpedia.com/news/Methane-Eating-Bacteria-Found-in-the-Icy-Arctic-Water-38414.shtml
___________________________
More Methane from the Deep Sea: Mud volcanoes as methane source
November 11, 2014
The
mud volcano Haakon Mosby in the Barents Sea near Norway annually emits
several hundred tons of methane, a potent greenhouse gas. But do mud
volcanoes like Haakon Mosby emit gas and mud continuously or do their
emissions come from episodic eruptions?
A study by a research
team, coordinated by the Max-Planck-Institute in Bremen, reports on the
results of a long-term observatory in NATURE Communications. Over 431
days, they collected data on temperature, pressure and pH together with
imagery of 25 eruptions of mud and gas. Some of these eruptions were so
violent that the seabed topography was profoundly changed. They
calculated that the mud volcano may emit 10 times more methane than
previously assumed.
There are over 1000 known mud volcanoes on
land, and a growing number, such as the Haakon Mosby Mud Volcano, are
found in the sea, between 200 and 4000 meters depth. Scientists
estimated that submarine volcanoes emit 27 million tons of methane—about
5 percent of the global emission. This may be an underestimation, as
not all volcanoes are known and because they are not monitored by
long-term observatories.
https://www.whoi.edu/press-room/news-tip/more-methane-from-the-deep-sea-mud-volcanos-as-methane-source/
___________________________
Meiobenthos at the Arctic Håkon Mosby Mud Volcano, with a parental-caring nematode thriving in sulphide-rich sediments
2006
https://www.int-res.com/abstracts/meps/v321/p143-155/
___________________________
Pingo-like features and mud volcanoes on the eastern Mackenzie Shelf
September 12, 2017
Over
the last few days we conducted three remotely operated vehicle (ROV)
dives and two autonomous underwater vehicle (AUV) surveys at areas of
geologic interest on the eastern Mackenzie Shelf that are called
pingo-like features (PLFs) and mud volcanoes.
On the adjacent
land of the Tuktoyaktuk Peninsula approximately 1,350 pingos are known
to occur. Pingos are round-to-oval, mound-shaped features that form on
land when fresh water enters the near-surface sediments in summer and
then freezes in winter. As the ice forms, physical expansion occurs and
pushes up the sediment layers above it creating the pingo.
Pingo-like
features found on the seafloor are circular mounds that come up like
haystacks from the seafloor and they superficially resemble pingos found
on land. The underwater PLFs were first discovered in this area in 1969
and were investigated as a potential hazard to navigation. Since then,
thousands of PLFs have been identified along the continental shelf/slope
and only a handful have been studied in detail to understand how they
form. One of the goals of this trip is to try to understand whether the
marine PLFs and the terrestrial pingos are actually similar features
and formed under similar processes...

Pingo-like features in bathymetry.
https://www.mbari.org/canadian-arctic-2017-sep-12/
___________________________
Bacterial endosymbiont of Oligobrachia sp. (Frenulata) from an active mud volcano in the Canadian Beaufort Sea
13 November 2019
https://link.springer.com/article/10.1007/s00300-019-02599-w
___________________________
Nematode species distribution patterns at the Håkon Mosby Mud Volcano (Norwegian Sea)
2010
https://www.deepdyve.com/lp/wiley/nematode-species-distribution-patterns-at-the-h-kon-mosby-mud-volcano-JVSPQVWwWi
___________________________
Meiobenthos at the Arctic Hakon Mosby Mud Volcano with a parental caring nematode thriving in sulfide-rich sediments
September 2006
https://www.researchgate.net/publication/232251266_Meiobenthos_at_the_Arctic_Hakon_Mosby_Mud_Volcano_with_a_parental_caring_nematode_thriving_in_sulfide-rich_sediments
___________________________
Endosymbioses
between bacteria and deep-sea siboglinid tubeworms from an Arctic Cold
Seep (Haakon Mosby Mud Volcano, Barents Sea).
2008
https://europepmc.org/article/MED/18707616
___________________________
Methane Devourer Discovered In The Arctic
October 20, 2006
https://www.sciencedaily.com/releases/2006/10/061019100814.htm
___________________________
Research at the Haakon Mosby Mud Volcano
2006
https://www.mpi-bremen.de/en/Research-at-the-Haakon-Mosby-Mud-Volcano.html
___________________________
Million-year-old Arctic sedimentary record sheds light on climate mystery
April 16, 2022
https://www.geologypage.com/2022/04/million-year-old-arctic-sedimentary-record-sheds-light-on-climate-mystery.html
___________________________
Discovery of a black smoker vent field and vent fauna at the Arctic Mid-Ocean Ridge
23 November 2010
https://www.nature.com/articles/ncomms1124/
___________________________
Undersea Cable Connecting Norway With Arctic Satellite Station Has Been Mysteriously Severed
Jan 10, 2022
https://www.thedrive.com/the-war-zone/43828/undersea-cable-connecting-norway-with-arctic-satellite-station-has-been-mysteriously-severed
___________________________
Arctic Sea Ice Is Growing Faster Than Before, But There's A Catch
Dec 10, 2018
A
recent study by NASA found that sea ice is growing faster during the
winter months today than it did decades ago. This increased growth of
sea ice has helped to slow down the overall reduction in Arctic sea ice
and delayed an ice-free Arctic.
NASA makes sure to clearly note
that this doesn't mean climate change isn't taking place, that our
planet is not warming and that the overall amount of sea ice isn't
declining in the Arctic.
Temperatures in the Arctic have warmed
much faster than temperatures in tropical locations. The doubled rate of
warming has led to increasingly smaller sea ice extents during Arctic
summer months and an overall reduction in sea ice.
The graph
above by NASA shows an average 12.8 percent decline in average September
sea ice extent, with the rate of decline increasing since the 1990s.
So
how can it be that sea ice is declining in the Arctic but wintertime
growth is increasing? The story lies in the magnitudes of both changes.
While the Arctic sea ice is growing faster and higher during the winter
months, it is more than offset by the melting in the summer months. So
what we've seen is that the increased rate of sea ice growth in the
winter helps to mitigate the melting during the summer. However,
ultimately the warming summer temperatures continue to overall reduce
the extent of sea ice.
Over the past few decades, sea ice across
the Arctic Ocean has gotten smaller and thinner. Compared to the 1980s,
today's end-of-summer Arctic sea ice extent is about half. Since 1958,
Arctic sea ice lost about two-thirds of its thickness, with nearly
three-quarters of Arctic sea ice forming and melting each year.
The
NASA research team found that in the 1980s, sea ice on average in the
Arctic was 6.6 feet thick in October. From there, on average 3.3 more
feet of sea ice would form through the winter. Comparing that to today,
where average sea ice in the Arctic is 3.3 feet thick in October but
will grow on average 5 feet more of sea ice through the winter. Hence,
the combined sea ice thickness in the 1980s was 9.9 feet thick, compared
to 8.3 feet thick today.
The negative feedback of increasing
rate of wintertime sea ice growth will help slow down the overall
decline in Arctic sea ice. However, the seemingly inevitable ice-free
Arctic will win out in the end, adds NASA.
Another positive
factor of the increased growth in wintertime Arctic sea ice is the
impact it has on global circulation. While global ocean circulation
continues to slow down, increased Arctic sea ice growth could help to
mitigate the slowing.
As a quick overview, global ocean
circulation is slowing down because overall Arctic ice levels are
continuing to decline, causing a freshwater influx into the Northern
Atlantic Ocean and a "cap" on the mechanism that drives global ocean
circulation. By increasing the rate at which wintertime sea ice forms,
the freshwater cap could be limited for a time...
https://www.forbes.com/sites/trevornace/2018/12/10/arctic-sea-ice-is-growing-faster-than-before-but-theres-a-catch/?sh=39de4da01ef4
___________________________
Fact check: Arctic sea ice declining despite false claims it's reached a 30-year high
June 28, 2022
https://news.yahoo.com/fact-check-arctic-sea-ice-225945318.html
___________________________
Why You Should Be Worried About This Glacier
Aug 31, 2022
https://www.youtube.com/watch?v=G6A_7KS-eOY
___________________________
The role of volcanic heating of the tropical stratosphere in formation of heat centers in the Arctic regions
17 June 2014
https://link.springer.com/article/10.1134/S1024856014030142
___________________________
Plants of the Arctic and Antarctic
https://beyondpenguins.ehe.osu.edu/issue/polar-plants/plants-of-the-arctic-and-antarctic
___________________________
No laughing matter
2019
The warming Arctic permafrost may be releasing more nitrous oxide, a potent greenhouse gas, than previously thought
https://news.harvard.edu/gazette/story/2019/06/harvard-chemist-permafrost-n2o-levels-12-times-higher-than-expected/
___________________________
10 Most Amazing Volcanoes in Alaska
December 2, 2021
https://www.touropia.com/volcanoes-in-alaska/
___________________________
Arctic ocean volcano blew its top – even under pressure
25 June 2008
https://www.newscientist.com/article/mg19826625-800-arctic-ocean-volcano-blew-its-top-even-under-pressure/
___________________________
Arctic Sponges Discovered Eating Corpses of Long-Dead Worms
2/10/22
The giant sponges, which live longer than humans, are thriving on an underwater mountain range near the North pole
https://gizmodo.com/arctic-sponges-discovered-eating-corpses-of-long-dead-w-1848514382
___________________________
A new research effort focuses on Alaska’s sub-Arctic corals and sponges
October 12, 2021
NOAA's four-year Alaska Deep-Sea Coral and Sponge Initiative will search some of the nearly three-quarters of Alaska waters have yet to be surveyed by sonar.
https://www.arctictoday.com/a-new-research-effort-focuses-on-alaskas-sub-arctic-corals-and-sponges/
___________________________
Hungry sea sponges feast on fossils atop an extinct underwater volcano
11 Feb 2022
In the Arctic Ocean, scientists have discovered a thriving ecosystem where food appeared to be nearly nonexistent.
https://www.nationalgeographic.co.uk/science-and-technology/2022/02/hungry-sea-sponges-feast-on-fossils-atop-an-extinct-underwater-volcano
___________________________
Bones of crocodile-like creature confirm that Arctic was once a hot spot
18 Dec 1998
It
was a landscape of steaming swamp and fetid forest. It sweltered in
summer, and even at its coldest it hardly ever froze. It was the Arctic
circle 90 million years ago.
Something geologists have suspected
for years was confirmed when John Tarduno of the University of Rochester
in New York took a closer look at rocks just above a layer of basalt
1,000ft thick in the high Canadian Arctic. Basalt means a volcanic
eruption; 1,000ft of basalt means a series of huge volcanic eruptions.
But
Professor Tarduno was more interested in a layer of shale just above
it. Shale is ancient mud. That meant that the long-gone volcanic
eruption was followed by a lagoon, swamp or estuary. Mud at the bottom
of a lake or lagoon is almost perfect for preserving fossils...
https://www.theguardian.com/world/1998/dec/18/1
___________________________
Seismic tremor reveals active trans-crustal magmatic system beneath Kamchatka volcanoes
2 Feb 2022
https://www.science.org/doi/10.1126/sciadv.abj1571
___________________________
Mud volcano stews in chilly Arctic waters.
1997
https://www.thefreelibrary.com/Mud+volcano+stews+in+chilly+Arctic+waters.-a019517770
___________________________
Paradoxical cold conditions during the medieval climate anomaly in the Western Arctic
2016
https://www.ncbi.nlm.nih.gov/pmc/articles/PMC5016737/
___________________________
Volcanic eruptions triggered global warming 56m years ago, study reveals
2017
Scientists
say one of the most rapid periods of warming in Earth’s history was due
to gradual release of CO2, warning current levels of emissions were
even higher
A dramatic period of global warming 56 million years
ago that saw temperatures climb by up to five degrees and triggered
extinctions of marine organisms was down to volcanic eruptions,
researchers have revealed, in a study they say offers insights into the
scale and possible impact of global warming today.
One of the
most rapid periods of warming in Earth’s history, the Palaeocene/Eocene
Thermal Maximum (PETM), occurred as Greenland pulled away from Europe.
However, details of the quantities of carbon dioxide behind the warming and where it came from had remained unclear.
Now
scientists say they have solved the puzzle, revealing that the main
driver of the event was a gradual release of carbon dioxide through
volcanic eruptions – findings, they say, that overturn a long-held view
that the PETM mirrors the rapid rise in carbon emissions seen today...
https://www.theguardian.com/science/2017/aug/30/volcanic-eruptions-triggered-global-warming-56m-years-ago-study-reveals
___________________________
Holes the size of city blocks are forming in the Arctic seafloor
March 14, 2022
https://www.cnn.com/2022/03/14/world/arctic-seafloor-holes-permafrost-scn/index.html
___________________________
Faster Arctic Sea Ice Retreat in CMIP5 than in CMIP3 due to Volcanoes
15 Dec 2016
https://journals.ametsoc.org/view/journals/clim/29/24/jcli-d-16-0391.1.xml
___________________________
Evidence of recent volcanic activity on the ultraslow-spreading Gakkel ridge
2001
https://pubmed.ncbi.nlm.nih.gov/11236991/
___________________________
Arctic volcanoes exploded at 'impossible' depth
25 June 2008
https://www.newscientist.com/article/dn14203-arctic-volcanoes-exploded-at-impossible-depth/
___________________________
A dated volcano-tectonic deformation event in Jan Mayen causing landlocking of Arctic charr
11 February 2021
Abstract
We provide the first documentation of tectonic deformation resulting from a volcanic eruption on the island of Jan Mayen. Vertical displacement of about 14 m southwest of the stratovolcano Beerenberg is associated with an eruption in ad 1732 on its southeastern flank. The age of the uplift event is bracketed by radiocarbon-dated driftwood buried by material deposited due to uplift, and by tephra from this eruption. Constraints, inferred from radiocarbon ages alone, allow for the possibility that uplift was completed prior to the ad 1732 eruption. However, the occurrence of tephra in the sediment column indicates that some displacement was ongoing during the eruption but ceased before the eruption terminated. We attribute the tectonic deformation to intrusion of shallow magma associated with the volcanic eruption. Our results complement previous studies of volcanic activity on Jan Mayan by providing precise age constraints for past volcanic activity. Also, it raises new hypotheses regarding the nature, timing and prevalence of precursor tectonic events to Jan Mayan eruptions. The uplift caused the complete isolation of a coastal lake by closing its outlet to the sea, thus landlocking the facultative migratory fish species Arctic charr (Salvelinus alpinus).
https://onlinelibrary.wiley.com/doi/full/10.1002/jqs.3280
___________________________
Future Volcanic Eruptions May Cause Ozone Hole Over Arctic
Mar 15, 2002
https://www.spacedaily.com/news/ozone-02c.html
___________________________
Volcano in Iceland Is One of the Largest Sources of Volcanic CO2
8 November 2018
High-precision
airborne measurements, in combination with atmospheric modeling,
suggest that the Katla subglacial caldera may be one of the planet’s
biggest sources of volcanic carbon dioxide.
https://eos.org/research-spotlights/volcano-in-iceland-is-one-of-the-largest-sources-of-volcanic-co2
___________________________
Newly discovered Greenland (mantle) plume drives thermal activities in the Arctic
2020
https://wattsupwiththat.com/2020/12/07/newly-discovered-greenland-mantle-plume-drives-thermal-activities-in-the-arctic/
___________________________
'Ice volcanoes' erupt on Michigan beach during Arctic blast
February 18, 2020
https://www.foxnews.com/us/ice-volcanoes-michigan-lake-cold-blast-winter-weather-ice-shelf
___________________________
Kikiktat volcanics of Arctic Alaska—Melting of harzburgitic mantle associated with the Franklin large igneous province
June 01, 2015
https://pubs.geoscienceworld.org/gsa/lithosphere/article/7/3/275/145742/Kikiktat-volcanics-of-Arctic-Alaska-Melting-of
___________________________
Frozen Splendor: Gems and Minerals Near the Arctic Region
March 17, 2017
https://www.gia.edu/gia-news-research/gems-minerals-near-arctic-region
___________________________
Volcanic activity sparks the Arctic Oscillation
August 2021
https://ui.adsabs.harvard.edu/abs/2021NatSR..1115839Q/abstract
___________________________
IMPACTS OF VOLCANIC ERUPTIONS AND GEOENGINEERING ON ARCTIC CLIMATE
May, 2014
https://rucore.libraries.rutgers.edu/rutgers-lib/44011/PDF/1/play/
___________________________
Global Warming or Simply...
Massive under Sea Volcanoes?
June 26, 2008
https://www.bibliotecapleyades.net/ciencia/ciencia_globalwarmingpseudo91.htm
___________________________
Deeply Submerged Volcanoes Blow Their Tops
August 14, 2008
Telltale rocks reveal evidence of a phenomenon scientists thought was impossible
A
research team led by Woods Hole Oceanographic Institution (WHOI) has
uncovered evidence of explosive volcanic eruptions on the Arctic Ocean
seafloor almost 2.5 miles deep. Scientists did not think volcanoes
submerged under such intense water pressure were capable of such violent
eruptions.
Researchers found jagged, glassy fragments of rock
(called pyroclastic deposits) spread out over a 4-square-mile
(10-square-kilometer) area around a series of small volcanic craters on
the Gakkel Ridge, a remote and mostly unexplored section of the
mid-ocean ridge, the volcanic undersea mountain chain that wraps around
the globe.
“These are the first pyroclastic deposits we’ve ever
found in such deep water, at oppressive pressures that inhibit the
formation of steam, and many people thought this was not possible,” said
WHOI geophysicist Rob Reves-Sohn, chief scientist of an expedition to
the Gakkel Ridge in July 2007. “This means that a tremendous blast of
carbon dioxide was released into the water column during the explosive
eruption.”
Reves-Sohn was lead author of a paper, co-authored by
22 researchers from nine institutions in four countries, that was
published June 26, 2008, in the journal Nature.
Seafloor
volcanoes usually emit lobes and sheets of lava during an eruption,
rather than explosive plumes of gas, steam, and rock that are ejected
from land-based volcanoes. Under the intense weight and pressure of
water, it is difficult to build up the amount of steam and carbon
dioxide gas required to explode a mass of rock up into the water column.
Far less energy is needed to do so in air, so ocean eruptions are more
likely to resemble those of Kilauea than Mount Saint Helens or Mount
Pinatubo.
On the Gakkel Ridge expedition, researchers used a
combination of survey and sampling instruments to examine the seafloor
and collect samples of rock and sediment, as well as dozens of hours of
high-definition video. They saw rough shards and bits of basalt
blanketing the seafloor and spread out in all directions from the
volcanic craters they discovered and named Loké, Oden, and Thor.
They
also found deposits on top of relatively new lavas and high-standing
features—indications that the rock debris had fallen or precipitated out
of the water, rather than being moved as part of a lava flow that
erupted from the volcanoes.
Closer analysis has shown that the
some of the tiny fragments are angular bits of quenched glass known to
volcanologists as limu o Pele, or “Pele’s seaweed.” These fragments are
formed when lava is stretched thin around expanding gas bubbles during
an explosion. Reves-Sohn and colleagues also found larger blocks of
rock—known as talus—that could have been ejected by explosive blasts
from the seafloor.
“Are pyroclastic eruptions more common than we
thought, or is there something special about the conditions along the
Gakkel Ridge?” said Reves-Sohn. “That is our next question.”
https://www.whoi.edu/oceanus/feature/deeply-submerged-volcanoes-blow-their-tops/
___________________________
Newly discovered Greenland plume drives thermal activities in the Arctic
December 7, 2020
https://phys.org/news/2020-12-newly-greenland-plume-thermal-arctic.html
___________________________
Arctic “ozone hole” in a cold volcanic stratosphere
February 19, 2002
https://www.pnas.org/doi/10.1073/pnas.052518199
___________________________
Ozone hole 2009
November 27, 2009
Latest depletion event 10th largest in last 30 years
https://antarcticsun.usap.gov/science/1969/
___________________________
Arctic Oscillation response to volcanic eruptions in the IPCC AR4 climate models
11 April 2006
https://agupubs.onlinelibrary.wiley.com/doi/full/10.1029/2005JD006286
___________________________
Future Volcanic Eruptions May Cause Ozone Hole Over Arctic
March 6, 2002
https://www.sciencedaily.com/releases/2002/03/020306073904.htm
___________________________
Another sign things are getting weird: Lightning around the North Pole increased dramatically in 2021
January 5, 2022
https://www.cnn.com/2022/01/05/world/lightning-increased-north-pole-arctic-2021-climate/index.html
___________________________
Arctic Ocean: volcanoes and recent earthquakes - interactive map / Volcano Discovery
https://www.volcanoesandearthquakes.com/map/arctic
___________________________
Volcanic Surge Separated The Arctic Ocean From The Atlantic
August 28, 2021
https://www.healththoroughfare.com/science/volcanic-surge-separated-the-arctic-ocean-from-the-atlantic/36137
___________________________
The Effect of Large Volcanic Eruptions on Arctic Ozone Loss and Recovery
https://geo.arc.nasa.gov/sgp/modeling/model3.html
___________________________
Fire and Ice: Why Volcanic Activity Is Not Melting the Polar Ice Sheets
May 6, 2020
https://climate.nasa.gov/ask-nasa-climate/2982/fire-and-ice-why-volcanic-activity-is-not-melting-the-polar-ice-sheets/
___________________________
Volcanic arc
https://en.wikipedia.org/wiki/Volcanic_arc
A
volcanic arc (also known as a magmatic arc is a belt of volcanoes
formed above a subducting oceanic tectonic plate,[2] with the belt
arranged in an arc shape as seen from above. Volcanic arcs typically
parallel an oceanic trench, with the arc located further from the
subducting plate than the trench. The oceanic plate is saturated with
water, mostly in the form of hydrous minerals such as micas, amphiboles,
and serpentine minerals. As the oceanic plate is subducted, it is
subjected to increasing pressure and temperature with increasing depth.
The heat and pressure break down the hydrous minerals in the plate,
releasing water into the overlying mantle. Volatiles such as water
drastically lower the melting point of the mantle, causing some of the
mantle to melt and form magma at depth under the overriding plate. The
magma ascends to form an arc of volcanoes parallel to the subduction
zone.
___________________________
Ice and flames: Those mysterious Arctic volcanoes
2018
https://arctic.ru/analitic/20181107/801083.html
___________________________
Earth's magnetic field broke down 42,000 years ago and caused massive sudden climate change
February 19, 2021
https://phys.org/news/2021-02-earth-magnetic-field-broke-years.html
___________________________
Earth’s magnetic pole is shifting faster than scientists predicted
February 6th, 2019
If
there’s one thing big-budget Hollywood disaster films have taught us,
it’s that the Earth’s poles are nothing to be messed with. But
apocalyptic fiction aside, scientists have been tracking the movement of
Earth’s poles for well over a century, and they never stay put.
In
what might seem like an alarming bulletin, scientists from the National
Centers For Environmental Information have issued an update that
reveals the new location of Earth’s north magnetic pole. The update is
actually an “out-of-cycle” event, meaning that it had to be done sooner
than planned do to the rapid shifting of the pole’s location...
https://bgr.com/science/north-pole-shift-polar-flip/
___________________________
Arctic Volcano Caused Ancient Global Cooling
May 19, 2022
https://polarjournal.ch/en/2022/05/19/arctic-volcano-caused-ancient-global-cooling/
___________________________
Rivers speeding up Arctic ice melt at alarming rate
January 18, 2022
Summary:
Freshwater flowing into the Arctic Ocean from the continent is thought
to exacerbate Arctic amplification, but the extent of its impact isn't
fully understood. New research measures how the flow of the Yenisei
River -- the largest freshwater river that flows into the Arctic Ocean
-- has changed over the last few hundred years, and describes the impact
freshwater has had on the Arctic.
https://www.sciencedaily.com/releases/2022/01/220118104146.htm
___________________________
Massive volcanic eruption in Scotland drove prehistoric global warming, scientists say
2019
Rocks
collected across Inner Hebrides provide first evidence for major
Scottish event contributing to 8C increase in global temperature
A
massive eruption on the Isle of Skye helped push the planet into a
period of dramatic global warming millions of years ago, according to
new research...
https://www.independent.co.uk/news/science/volcano-eruption-scotland-eruption-global-warming-climate-change-isle-skye-inner-hebrides-a8744041.html
___________________________
An unrecognizable Arctic
July 24, 2013
In
early May 2013, sensors atop a research facility perched on Hawaiian
volcano Mauna Loa recorded a sobering statistic. The average daily level
of carbon dioxide in the air had reached a concentration above 400
parts per million—a level that hasn’t been seen since around 3 to 5
million years ago, well before humans roamed the Earth.
Human
burning of fossil fuels continues to increase the amount of carbon, a
potent heat-trapping greenhouse gas, in our atmosphere. As a result, our
planet is warming, and that warming is pushing Earth systems past
critical points. This is especially true within the icy realm of the
Arctic, the northernmost polar region of the planet, where the effects
of climate change are expected to be most exaggerated [1] and have the
biggest impact (see sidebar).
NASA scientists and others around
the world are tracking these profound changes and trying to understand
what the future may hold. In some cases, Arctic systems may be reaching
“tipping points” [2]—critical moments in time where a small change has
large, potentially irreversible impacts (see sidebar). Examples of
tipping points include the melting of permafrost in the Alaskan tundra
and the acidification of the oceans. In other cases, where it may be
difficult to quantify a particular tipping point, whole systems are
racing toward dramatic transformations, such as the melting of sea ice
and the decay of the Greenland ice sheet.
“The changes are
dramatic,” said Ron Kwok, a senior research scientist at NASA’s Jet
Propulsion Laboratory. “It is indisputable that sea level rise,
disappearing sea ice, melting ice sheets and other changes are
happening. It’s a call to action in terms of understanding and
mitigation.”
https://climate.nasa.gov/news/958/an-unrecognizable-arctic/
___________________________
That’s amazing, the Arctic sky has turned red!
2018
https://strangesounds.org/2018/10/thats-amazing-the-arctic-sky-has-turned-red.html
___________________________
Top 10 Most Famous and Intriguing Polar Explorers
July 25, 2016
https://explore.quarkexpeditions.com/blog/top-10-most-famous-and-intriguing-polar-explorers
___________________________
Frozen fallout: Ukraine invasion scrambles Arctic rush
April 16, 2022
U.S., allies reconsider Russian ambitions in 'high north'
https://www.washingtontimes.com/news/2022/apr/16/frozen-fallout-ukraine-invasion-scrambles-arctic-r/
___________________________
Arctic Sea Ice Minimum Extent
https://climate.nasa.gov/vital-signs/arctic-sea-ice/
___________________________
A New Frontier for Fracking: Drilling Near the Arctic Circle
August 18, 2014
Hydraulic
fracturing is about to move into the Canadian Arctic, with companies
exploring the region’s rich shale oil deposits. But many indigenous
people and conservationists have serious concerns about the impact of
fracking in more fragile northern environments.
https://e360.yale.edu/features/a_new_frontier_for_fracking_drilling_near_the_arctic_circle
___________________________
Fracking comes to the Arctic in a new Alaska oil boom
2017
https://phys.org/news/2017-04-fracking-arctic-alaska-oil-boom.html
___________________________
How Oil and Gas Drilling Could Disrupt the Arctic National Wildlife Refuge
The
U.S. Department of the Interior has approved a plan to auction off
leases for oil and gas development in the refuge. NC State researchers
say the move poses numerous threats.
2020
https://cnr.ncsu.edu/news/2020/08/how-oil-and-gas-drilling-could-disrupt-the-arctic-national-wildlife-refuge/
___________________________
Researchers found the toxic leftovers of a northern Canadian mine in nearby snowshoe hares
June 20, 2018
https://www.arctictoday.com/researchers-found-toxic-leftovers-northern-canadian-mine-nearby-snowshoe-hares/
___________________________
Ethical Reflections on Fracking
2015
https://www.kairoscanada.org/wp-content/uploads/2014/04/final-Ethical-Reflections-on-Fracking-Feb.-2015.pdf
___________________________
'Glacial fracking': A hidden source of Arctic greenhouse gas emissions
February 19, 2025
https://www.sciencedaily.com/releases/2025/02/250219110104.htm
___________________________
Fracking report validates environmental concerns in N.W.T.
2014
https://www.cbc.ca/news/canada/north/fracking-report-validates-environmental-concerns-in-n-w-t-1.2629503
___________________________
What You Need to Know About Fracking In Canada
2017
https://thenarwhal.ca/what-is-fracking-in-canada/
___________________________
Fracking boom continues to raise environmental concerns
2013
https://www.cbc.ca/news/canada/calgary/fracking-boom-continues-to-raise-environmental-concerns-1.1312363
___________________________
Exposure to Oil and Gas Fracking Sites Linked to Adverse Birth Outcomes
2022
https://journals.lww.com/ajnonline/Fulltext/2022/07000/Exposure_to_Oil_and_Gas_Fracking_Sites_Linked_to.7.aspx
___________________________
Fracking tied to cancer-causing chemicals
2016
https://www.ncbi.nlm.nih.gov/pmc/articles/PMC5235941/
___________________________
Fracking on the rise in Manitoba
2013
Not as dirty as American kin, but oil well regulation lacking
https://www.winnipegfreepress.com/local/Fracking-on-the-rise-in-Manitoba-213970561.html
___________________________
We are Endangered! Save the Yukon... No Fracking!!!
2015
https://secure.avaaz.org/community_petitions/en/Yukon_Government_Leader_Yukon_Territory_Canada_Ban_Fracking_in_the_Yukon_Territory_permanently/
___________________________
Experts raise concern of water contamination following Yukon mine landslide
27 Jun. 2024
Two experts have raised water contamination concerns following the landslide at a gold mine in Yukon earlier this week.
On Monday, Victoria Gold Corp.’s Eagle Gold Mine experienced a “significant” landslide early Monday after a heap leach failure, according to the employer.
___________________________
Dead fish in creek near Eagle mine likely killed by cyanide, Yukon officials say
August 21, 2024
Cyanide toxicity in Haggart Creek spiked following water discharge by Victoria Gold last week
https://www.cbc.ca/news/canada/north/yukon-heap-leach-failure-update-1.7289886
___________________________
Documents show 'disastrous' cyanide leaks continue at Eagle mine in Yukon
July 24, 2024
Victoria Gold excavated a pit to hold contaminated solution — but failed to line it
https://www.cbc.ca/news/canada/north/eagle-mine-july-23-documents-cyanide-leaks-1.7272765
___________________________
A Canadian gold mine spill raises fears among Alaskans on the Yukon River
July 29, 2024
___________________________
Gold cyanidation
Gold cyanidation (also known as the cyanide process or the MacArthur–Forrest process) is a hydrometallurgical technique for extracting gold from low-grade ore through conversion to a water-soluble coordination complex. It is the most commonly used leaching process for gold extraction.[1] Cyanidation is also widely used in silver extraction, usually after froth flotation.[2]
Production of reagents for mineral processing to recover gold represents 70% of cyanide consumption globally. While other metals, such as copper, zinc, and silver, are also recovered using cyanide, gold remains the primary driver of this technology. [1] The highly toxic nature of cyanide has led to controversy regarding its use in gold mining, with it being banned in some parts of the world. However, when used with appropriate safety measures, cyanide can be safely employed in gold extraction processes.[3] One critical factor in its safe use is maintaining an alkaline pH level above 10.5, which is typically controlled using lime in industrial-scale operations. Lime plays an essential role in gold processing, ensuring that the pH remains at the correct level to mitigate risks associated with cyanide use.
https://en.wikipedia.org/wiki/Gold_cyanidation
___________________________
The melting Arctic permafrost is unleashing a 'toxic' legacy
2025
Rising temperatures could cause huge amounts of toxic materials to seep out of sealed-off mines into waterways
https://theweek.com/environment/the-melting-arctic-permafrost-is-unleashing-minings-toxic-legacy
___________________________
Arctic Oil Rush Poses Environmental Risks And Challenges
2018
https://www.rferl.org/a/arctic-oil-rush-poses-environmental-risks-and-challenges/24691867.html
___________________________
Alaska regulators reject permit application for controversial gold project
March 16, 2025
https://www.arctictoday.com/alaska-regulators-reject-permit-application-for-controversial-gold-project/
___________________________
New federal program aims to speed restoration of damaged Alaska streams and rivers
July 10, 2024
https://www.arctictoday.com/new-federal-program-aims-to-speed-restoration-of-damaged-alaska-streams-and-rivers/
___________________________
Months after fish died near an Alaska mine, state regulators and the mine’s owner still don’t know what killed them
March 25, 2025
https://www.arctictoday.com/months-after-fish-died-near-an-alaska-mine-state-regulators-and-the-mines-owner-still-dont-know-what-killed-them/
___________________________
Why some of Alaska’s rivers are turning orange: CBS News
May 23, 2024

A small headwater tributary of the Akillik Rivver in Kobuk Valley National Park in summer 2017 and summer 2018.
For years, dozens of rivers and streams in Alaska have turned rusty orange. Scientists suspect that the change in color was caused by thawing permafrost releasing minerals into crystal clear water, CBS News reports, citing a report published in Nature Earth and Environment.
Scientists sampled affected water across 75 locations in a Texas-sized area of northern Alaska’s Brooks mountain range, Some of the locations are so remote that researchers are using helicopters to access them.
The study revealed elevated levels of metals such as iron, zinc, nickel, copper, and cadmium in the affected water, with iron primarily responsible for the orange hue.
The discoloration has led to declines in the fish population, posing risks to subsistence, sport and commercial fisheries. It also threatens rural drinking water supplies, potentially affecting taste and requiring a higher level of filtration.
Researchers are continuing to monitor the situation, investigating the long-term effects of climate change on permafrost and water quality. They are also exploring the potential for recovery if colder temperatures return and permafrost refreezes.
https://www.arctictoday.com/why-some-of-alaskas-rivers-are-turning-orange-cbs-news/
___________________________
River water in Norilsk is still red from diesel fuel, two years after spill, says activist
June 8, 2022
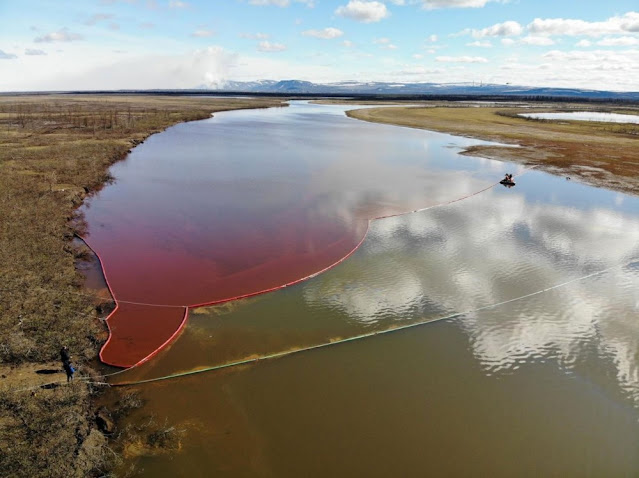
Fuel on the water in Norilsk after a 2020 spill. (Rosprirodnadzor via The Independent Barents Observer)
___________________________
Gazprom’s new pipeline across the Gulf of Ob stirs environmental concern
January 3, 2022

Terminal cranes are seen along the Ob River. (Atle Staalesen / The Independent Barents Observer)
https://www.arctictoday.com/gazproms-new-pipeline-across-the-gulf-of-ob-stirs-environmental-concern/
___________________________
Norway to postpone oil and gas licensing round
November 29, 2022
https://www.arctictoday.com/norway-to-postpone-oil-and-gas-licensing-round/
___________________________
Scientific Review of Hydraulic Fracturing in British Columbia
February 2019
https://www2.gov.bc.ca/assets/gov/farming-natural-resources-and-industry/natural-gas-oil/responsible-oil-gas-development/scientific_hydraulic_fracturing_review_panel_final_report.pdf
___________________________
Fracking Hotspots in Canada
February 11, 2014
https://www.alternativesjournal.ca/politics-policies/fracking-hotspots-in-canada/
___________________________
Birth defects, cancer and disease among potential health risks from fracking for Canadians, doctors warn
2020
https://www.thestar.com/news/canada/2020/01/29/doctors-warn-fracking-could-have-severe-health-environmental-consequences-for-canadians.html
___________________________
Tar Sands Tailings Ponds: Out of Canada's Control
December 21, 2017
The Alberta tar sands have become synonymous with global climate change, but their production process wreaks destruction across a huge region of North America’s boreal forest. Tailings ponds, which now hold more than 1 trillion liters of toxic waste, are a commonly overlooked byproduct of the tar sands industry that has long been flagged for regulators as a potential environmental catastrophe. Yet, in its lackluster response to our petition to NAFTA’s Commission for Environmental Cooperation (CEC) last month, the Canadian government showed an alarming inability to take even basic steps to begin confronting the problem. Meanwhile, noxious chemicals are leaking into major rivers, taking a toll on the fragile boreal forest environment and Indigenous Peoples that have lived in the area for thousands of years.
In June 2017, the Natural Resources Defense Council (NRDC), Environmental Defence Canada (EDC) and Daniel T’seleie of the K’ahsho Got’ine Dene First Nation filed a petition to the CEC, NAFTA’s environmental tribunal, to hold the Canadian government accountable to its own federal laws. Specifically, the petition urged the CEC to investigate Canada’s enforcement (or lack thereof) of its Fisheries Act, which prohibits leaking of “deleterious substances” into fresh water bodies, including leaks from tar sands tailings ponds into the waters of Northeast Alberta. In November, Environment and Climate Change Canada (ECCC) offered a startling response, using nature as an alibi for the tar sands industry’s environmental wrongdoings.
Citing its record of inspections and scientific research, ECCC asserted that its actions demonstrate “effective enforcement” of the Fisheries Act’s pollution prevention provisions. According to the government’s response, Canada had been taking a “proactive” approach until 2014, but regulators claim that their methodology was insufficient to understand whether contamination was “natural” or if it was a result of extractive industries. Using this flimsy cover, Canada then admitted that it has prioritized other issues since 2014, and taken a “reactive” approach to the ever-growing tar sands tailings problem. As a result, Alberta’s tar sands tailings ponds will continue to seep into the province’s fresh water system for the foreseeable future. NAFTA’s CEC has 120 working days from ECCC’s response to decide on next steps in the dispute.

Tar sands tailings

Tar sands tailings ponds
Producing oil from tar sands is a resource-intensive process. An industrial hellscape of open-pit mines spreads across the land, giving way to 220 km2 of tailings ponds that drown the ruins of once-undisturbed old growth boreal forest. According to Natural Resources Canada, a typical surface mine requires 3-4 barrels of fresh water in order to produce one barrel of crude oil from tar sands, a fact that has made water levels plummet in surrounding rivers during dry years. And because this water turns into a lethal stew—that contains not just H20, but also sand, silt, heavy metals and highly harmful petrochemical byproducts like lead, mercury, arsenic and benzene—it ends up in these ponds.
Tailings ponds present a clear and present danger because they fail to contain these damaging chemicals. In fact, the federal government’s own research has shown that toxic substances are seeping into groundwater and the Athabasca River, causing serious health risks. EDC’s analysis of industry data revealed that the ponds are leaking 11 million liters per day in aggregate, and that a single pond can leak up to 6.5 million liters per day. Tailings ponds are ostensibly designed to allow minerals to “settle out” in order to prevent seepage of polluted water outside of containment zones, but evidence shows that the dirty water is interacting with the Athabasca watershed. In addition to wet toxins, the ponds emit dry pollutants: carcinogenic hydrocarbons evaporate into the ambient air and pass into the water supply, and greenhouse gases like carbon dioxide and methane enter the atmosphere, contributing to climate change.
Astonishingly, for nearly half a century, from 1967 to 2009, no regulations or requirements to limit tailings ponds even existed, despite producers relying on the method to store their substantial volumes of toxic waste. Then, in 2009, Alberta acknowledged that a serious environmental threat was lurking in the tailings ponds, and regulators signaled their willingness to do something about it. Alberta’s government proposed Directive 074, but industry was able to ignore it because there was scant enforcement. This failure triggered NRDC and EDC to submit our first petition in April 2010, flagging abundant evidence of the leakage problem and outlining what enforcement of the Fisheries Act would look like.
Alberta’s government announced a Tailings Management Framework (TMF) in March 2015, setting targets for tailings reductions, but these requirements favored industry and were too weak to protect the environment and communities impacted by the waste. In July 2016, the Alberta Energy Regulator issued Directive 085, requiring companies to submit Tailings Management Plans aimed at shrinking the tailings, but a Pembina Institute study soon revealed that the industry’s plans would allow for increases in tailings for decades, and allow further delays for reclaiming the landscape. We therefore refiled our petition in June 2017, arguing that Canada and Alberta should take a closer look at Directive 085 and include more stringent requirements for companies to substantially reduce the volume of tailings and immediately begin the long process of reclamation. Last month, Canada admitted failure, conceding that they have not prioritized enforcement.
The problem for Canada is that there is a growing body of research that convincingly undermines their weak excuse. Recent studies confirm that tar sands bitumen has a unique environmental fingerprint found in areas surrounding the epicenter of production, including waterways into which tailings are known to be leaking.
Urgent Need to Reduce Health and Environmental Hazards
Given ECCC’s acknowledgment of its own shortcomings, there are two main considerations that merit a more concerted effort:
1. Disproportionate impact on Indigenous Peoples
Canada endorsed the United Nations Declaration on the Rights of Indigenous Peoples (UNDRIP) in 2016, after having committed to it in principle in 2010. Moreover, Bill C-262, brought by New Democratic Party MP, Romeo Saganash, has gained support from Liberals to legislate and enforce UNDRIP under Canadian law. If the Canadian government is sincere about its current principles on relations with Indigenous Peoples—which recognize that “meaningful engagement with Indigenous peoples aims to secure their free, prior, and informed consent when Canada proposes to take actions which impact them and their rights, including their lands, territories and resources”—then it is imperative that authorities consider local knowledge and enforce stronger environmental protections.
The Athabasca River flows north, through the predominantly Indigenous community of Fort Chipewyan, where residents have suffered rare forms of cancer that are typically tied to fossil fuel production sites. In 2014, the Athabasca Chipewyan First Nation (AFCN) and the Mikisew Cree First Nation (MCFN) released a report in collaboration with researchers from University of Manitoba that outlined clear associations between tar sands contaminants and illness and affliction in Fort Chipewyan. Tailings ponds are also impacting biodiversity on First Nation territories with increased animal mortality and deformities observed by hunters and fishermen. To address these environmental injustices, Canada should enforce its Fisheries Act, and Alberta should offer adequate support for monitoring, but these governments must also work with Indigenous Peoples on a nation-to-nation basis.
2. Slow and costly remediation
Tar sands mining is a truly Sisyphean undertaking. The costs of cleaning up the tailings ponds mess are estimated to be so high that, if Albertan taxpayers are saddled with the bill, the cost will cancel out the amount of royalties that Alberta has received from producing oil from tar sands since 1969—and then some. To alleviate this hefty burden on tax payers, Alberta needs to reverse course, and ensure that the tar sands industry remains on the hook for the toxic legacy they continue to spread across the boreal forest. A first step is ending, as soon as possible, any further accumulation of tailings waste. Achieving that basic milestone will allow industry to begin keeping its promise to remediate these environmental catastrophes and allow the region to begin the long process of healing.
https://www.nrdc.org/experts/james-blair/tar-sands-tailings-ponds-out-canadas-control
___________________________
One trillion litres of toxic waste and growing: Alberta’s tailings ponds
Alberta’s growing tailings ponds are an ongoing source of controversy and scientific concern.
Oil sands mining operations produce significant volumes of toxic waste called tailings—
a poisonous brew of water, sand, silt and petrochemical waste products. For over fifty years,
the oil sands industry has stored these tailings in enormous lakes that the industry refers to
as “tailings ponds.” New research shows that these tailings have now surpassed 1.18 trillion
litres and their volumes continue to grow each year.1 These tailings ponds have significant
environmental impacts. Scientific reports have found tailings ponds leach chemicals that
sicken local communities, poison wildlife, and pose the ever-growing threat of contaminating
the region’s water resources.
What Are Oil Sands Tailings
For over half a century, the oil sands industry has created tailings ponds that today cover an
area greater than cities of Toronto (pre-amalgamation) and Vancouver combined, or Manhattan
and Boston combined.7 Tailings are produced during the process of separating bitumen — the
thick, extra heavy substance which is raw oil sands crude — from the mixture of sand, clay, and bitumen that make up the oil deposits. 8 Industry uses hot water and chemicals to separate the bitumen from the slurry of other materials. It then skims off the bitumen and pumps the remaining waste slurry into tailings ponds.9 Every barrel of oil sands extracted adds 1.5 barrels of liquid waste to Alberta’s tailing ponds, and each day industry needs to store 25 million new litres of tailings. 10 Today, Alberta’s liquid tailings now make up more than 1.18 trillion litres of toxic waste, and continue to grow.


___________________________
Could Canadian oil be the most destructive on earth?
Feb 29, 2008
Check
out this new report from Environmental Defence Canada. The title sort
of says it all: "Canada's Toxic Tar Sands: The Most Destructive Project
On Earth" (PDF).
https://grist.org/article/the-problem-with-tar-sands/
___________________________
Everything you need to know about the tar sands and how they impact you
17 May, 2021
https://www.greenpeace.org/canada/en/story/3138/everything-you-need-to-know-about-the-tar-sands-and-how-they-impact-you/
___________________________
Canada’s Tar Sands: Destruction So Vast and Deep It Challenges the Existence of Land and People
November 21, 2021
Oil
companies have replaced Indigenous people’s traditional lands with
mines that cover an area bigger than New York City, stripping away
boreal forest and wetlands and rerouting waterways.
https://insideclimatenews.org/news/21112021/tar-sands-canada-oil/
___________________________
Report: Canada’s Toxic Tar Sands: The Most Destructive Project on Earth
https://environmentaldefence.ca/report/report-canadas-toxic-tar-sands-the-most-destructive-project-on-earth/
___________________________
Environmental Impact of Tar Sands 'Horrible,' Expert Says
July 14, 2014
https://pulitzercenter.org/stories/environmental-impact-tar-sands-horrible-expert-says
___________________________
A mining rush in Canada’s backcountry threatens Alaska salmon
Dec. 31, 2012
https://www.hcn.org/issues/44.22/a-mining-rush-in-canadas-backcountry-threatens-alaska-salmon
___________________________
Canada’s oil sands industry is taking a big hit
March 5, 2021
With
the Biden administration cancellation of the Keystone XL Pipeline, a
troubled industry seeks ways to transport its product.
https://yaleclimateconnections.org/2021/03/canadas-oil-sands-industry-is-taking-a-big-hit/
___________________________
OIL SHALE AND TAR SANDS
https://www.biologicaldiversity.org/programs/public_lands/energy/dirty_energy_development/oil_shale_and_tar_sands/
___________________________
Fracking And Tar Sands
2018
https://www.kineticpetro.com/fracking-and-tar-sands/
___________________________
Tar-sands mining in Canada is unleashing mercury pollution
Jan 03, 2014
As if the oil-sands operations in Alberta weren't bad enough, here's another way they're polluting the environment.
https://grist.org/climate-energy/tar-sands-mining-in-canada-is-unleashing-mercury-pollution/
___________________________
Unexamined risks from tar sands oil may threaten oceans
December 20, 2016
A
lack of publicly available information about the chemical composition
of fuel mined from tar sands hampers efforts to safeguard marine
habitats. A new analysis recommends that officials gain a better
understanding of the fuel’s environmental impacts before setting
regulations.
https://news.stanford.edu/2016/12/20/unexamined-risks-tar-sands-oil-may-threaten-north-americas-oceans/
___________________________
Myth: Tar Sands versus Oil Sands: What’s in a name?
Jul 7, 2019
The
tug of war over what to call it doesn’t change the fact that it’s home
to Canada’s largest oil discovery and a vital resource.
https://context.capp.ca/energy-matters/2019/mythbuster-oil-vs-tar/
___________________________
Alberta Oil Sands: Canada’s Environmental Disaster
April 6, 2021
https://defendtheearth.org/alberta-oil-sands-canadas-environmental-disaster/
___________________________
Oil for Export: Tar Sands Bitumen Cannot be Refined in Eastern Canada
Oct. 3, 2013
https://thenarwhal.ca/oil-export-tar-sands-bitumen-cannot-be-refined-eastern-canada/
___________________________
The Dirty Truth About Tar Sands
2014
https://www.nrcm.org/news/the-dirty-truth-about-tar-sands/
___________________________
Sydney Tar Ponds Contamination, Nova Scotia Canada
2018
https://www.ejatlas.org/conflict/sydney-tar-ponds-contamination-nova-scotia-canada
___________________________
Post-Apocalyptic Destruction of the Tar Sands: Alberta from Above
November 26, 2014
https://wilderutopia.com/environment/post-apocalyptic-destruction-of-the-tar-sands-alberta-from-above/
___________________________
German research institute pulls out of Canadian tar sands project
2013
https://www.euractiv.com/section/science-policymaking/news/german-research-institute-pulls-out-of-canadian-tar-sands-project/
___________________________
Canada’s oil sands residents complain of health effects
April 26, 2014
https://www.thelancet.com/journals/lancet/article/PIIS0140-6736(14)60703-0/fulltext
___________________________
Environmental Considerations of Shale and Tight Resource Development
2020-09-02
https://www.nrcan.gc.ca/energy/energy-sources-distribution/natural-gas/shale-tight-resources-canada/environmental-considerations-shale-and-tight-resource-development/17682
___________________________
Koch Brothers’ Tar Sands Waste Petcoke Piles Spread to Chicago
Oct. 24, 2013
https://thenarwhal.ca/koch-brothers-tar-sands-waste-petcoke-piles-spread-detroit-chicago/
___________________________
Alaska and fracking
https://www.gem.wiki/Alaska_and_fracking
___________________________
Russia 'secretly working with environmentalists to oppose fracking'
2014
Nato chief, Anders Fogh Rasmussen, says Moscow mounting disinformation campaign to maintain reliance on Russian gas
https://www.theguardian.com/environment/2014/jun/19/russia-secretly-working-with-environmentalists-to-oppose-fracking
___________________________
Liquid salt could help clean up tar sands
2011
https://newatlas.com/ionic-liquids-used-to-process-tar-sands/18214/
___________________________
Permafrost thaw will make radon a bigger threat to Arctic residents, a new study says
February 18, 2022
Thawing soil can release built-up stores of the gas, increasing levels as much as 100-fold.
https://www.arctictoday.com/permafrost-thaw-will-make-radon-a-bigger-threat-to-arctic-residents-a-new-study-says/
___________________________
Climate change in the Arctic and radon gas: a rising threat from the ground up
Mar 11, 2022
https://ncceh.ca/content/blog/climate-change-arctic-and-radon-gas-rising-threat-ground
___________________________
Thawing of Arctic permafrost may release cancer-causing gas, scientists warn
09 February 2022
‘An unexpected plume of radon could represent a dangerous health hazard,’ lead author says
https://www.independent.co.uk/climate-change/news/arctic-permafrost-thawing-carcinogen-gas-b2011535.html
___________________________
Radioactive contamination in the Arctic—sources, dose assessment and potential risks
2002
https://www.sciencedirect.com/science/article/abs/pii/S0265931X01000935
___________________________
Rising radon levels pose increased lung cancer risk for Canadians
Oct 24 2024
https://www.news-medical.net/news/20241024/Rising-radon-levels-pose-increased-lung-cancer-risk-for-Canadians.aspx
___________________________
The race against radon
05.11.2022
Scientists
are working to map out the risks of the permafrost thaw, which could
expose millions of people to the invisible cancer-causing gas
https://knowablemagazine.org/article/physical-world/2022/race-against-radon
___________________________
Radioactive contamination in the Arctic--sources, dose assessment and potential risks
2002
https://pubmed.ncbi.nlm.nih.gov/11936613/
___________________________
How has the intensity of UVB radiation changed recently in the Arctic, and what significance might these changes have?
UV radiation: the unexplored threat to the Arctic
https://www.pmel.noaa.gov/arctic-zone/essay_weatherhead.html
___________________________
The Arctic Is Absorbing More Sunlight
2014
NASA
satellite instruments have observed a marked increase in the amount of
solar radiation absorbed by the Arctic since the year 2000, a trend that
aligns with the steady decrease in Arctic sea ice during the same
period.
While sea ice is mostly white and reflects sunlight,
ocean water is darker and absorbs more of the Sun’s energy. A decline in
Arctic albedo (reflectivity) has been a key concern among scientists
since summer Arctic sea ice cover began shrinking in recent decades. As
more solar energy is absorbed by the ocean, air, and icy land masses, it
enhances the ongoing warming in the region, which is more pronounced
than anywhere else on the planet.
The maps above show the net
change in solar radiation absorbed by the atmosphere over the Arctic
from 2000 to 2014, as well as the net change in sea ice cover over the
same period. Shades of red depict areas absorbing more sunlight (top
map) and areas with less ice cover (second map). The radiation
measurements were made by NASA’s Clouds and the Earth’s Radiant Energy
System (CERES) instruments, which fly on multiple satellites.
Measurements of sea ice cover were compiled from multiple satellite
missions by the National Snow and Ice Data Center. Turn on the image
comparison tool to see how increases in absorbed energy align with
decreases in ice cover.
Since the year 2000, the rate at which
the Arctic absorbs solar radiation in June, July, and August has
increased by 5 percent, said Norman Loeb, principal investigator for
CERES and a climate scientist at NASA’s Langley Research Center. While a
5 percent increase might not seem like much, consider that the global
rate has remained essentially flat during that same time. No other
region on Earth shows a trend of change.
When averaged over the
entire Arctic Ocean, the increase in absorbed solar radiation is about
10 Watts per square meter. This is equivalent to an extra 10-watt light
bulb shining continuously over every 10.76 square feet of Arctic Ocean
for the entire summer. Regionally, the increase is even greater, Loeb
noted. Areas such as the Beaufort Sea, which has experienced the some of
the most pronounced decreases in sea-ice coverage, show a 50 watts per
square meter increase.
As a region, the Arctic is showing more
dramatic signs of climate change than any other part of the planet.
These include a warming of air temperatures at a rate two to three times
greater than the rest of the planet, and the loss of September sea ice
extent at a rate of 13 percent per decade...
https://earthobservatory.nasa.gov/images/84930/the-arctic-is-absorbing-more-sunlight
___________________________
Emerging Trends in Arctic Solar Absorption
16 December 2021
https://agupubs.onlinelibrary.wiley.com/doi/10.1029/2021GL095813
___________________________
Russia confirms 'extremely high' radiation levels in toxic cloud
21 November 2017
https://www.newscientist.com/article/2153998-russia-confirms-extremely-high-radiation-levels-in-toxic-cloud/
___________________________
Photosynthesis of two Arctic macroalgae under different ambient radiation levels and their sensitivity to enhanced UV radiation
March 2000
https://link.springer.com/article/10.1007/s003000050442
___________________________
Effects of UV radiation on the structure of Arctic macrobenthic communities
12 February 2011
https://link.springer.com/article/10.1007/s00300-011-0959-4
___________________________
Radiation in the Arctic Atmosphere and Atmosphere – Cryosphere Feedbacks
2020
Arctic surface temperature has been increasing at a rate 2–3 times that of the global average in the last half century. Enhanced warming of the Arctic, or Arctic Amplification, is a climatic response to external forcing. Despite good results obtained by climatic models for the globe, the largest intermodel differences in surface temperature warming are found in the Arctic. The magnitude of this warming drives many different processes and determines the evolution of many climatic parameters such as clouds, sea ice extent, and land ice sheet mass. The Arctic Amplification can be attributed to the peculiar feedback processes that are triggered in the Arctic. Most of these processes include radiation interaction with the atmosphere and with the surface, all of them contributing to the radiation budget. It is then mandatory to correctly evaluate this budget both at the surface and at the top of the atmosphere and in the solar and thermal spectra. This can be done using both direct observations, from ground and from space, and model simulation via radiation transfer codes. This last approach need many observed input parameters anyhow.
In this contribution results on the evaluation of the radiation budget in the Arctic are first reviewed. Follows a detailed description of the effects of the most important atmospheric gases (carbon dioxide, methane, ozone etc.) on both shortwave and longwave radiation ranges. The same is illustrated for aerosol loading in the Arctic, based on a large dataset of aerosol radiative properties measured by means of sun-photometers in numerous Arctic stations. Finally, the effect of the surface reflectivity characteristics on the radiation budget is illustrated by means of albedo models specific for the Arctic.
https://link.springer.com/chapter/10.1007/978-3-030-33566-3_10
___________________________
NASA Reports Arctic Stratospheric Ozone Depletion Hit Record Low in March
Apr 16, 2020
Ozone
levels above the Arctic reached a record low for March, NASA
researchers report. An analysis of satellite observations show that
ozone levels reached their lowest point on March 12 at 205 Dobson units.
While
such low levels are rare, they are not unprecedented. Similar low ozone
levels occurred in the upper atmosphere, or stratosphere, in 1997 and
2011. In comparison, the lowest March ozone value observed in the Arctic
is usually around 240 Dobson units.
https://www.nasa.gov/feature/goddard/2020/nasa-reports-arctic-stratospheric-ozone-depletion-hit-record-low-in-march
___________________________
NASA Reports Arctic Stratospheric Ozone Depletion Hit a Record Low for March
April 16, 2020
https://climate.nasa.gov/news/2972/nasa-reports-arctic-stratospheric-ozone-depletion-hit-a-record-low-for-march/
___________________________
Arctic moisture on the move
April 6, 2015
Arctic
sea ice—frozen seawater floating on top of the Arctic Ocean and its
neighboring seas—grows in the fall and winter and melts in the spring
and summer. Since 1978, satellites monitoring this annual growth and
retreat have detected an overall decline in Arctic sea ice.
Scientists
such as NASA’s Linette Boisvert want to know how this decline is
contributing to a warmer and wetter Arctic. One way to find out is by
looking at the energy balance at the surface. Areas of ice-free ocean
absorb more heat from the sun and become warmer, increasing humidity
near the surface. When the humidity at the surface is higher than that
of the overlying air, the moisture is released into the atmosphere. In
its vapor form, this water is a greenhouse gas that can lead to further
warming and ice loss.
The map above, produced with data from the
Atmospheric Infrared Sounder (AIRS) instrument on NASA’s Aqua satellite,
represents the vertical transport of moisture over the Arctic on June
21, 2014. Orange and red areas show where moisture is leaving the
surface and entering the atmosphere (evaporation); blue areas are where
moisture is moving from the atmosphere to the surface. The rate at which
this occurs is called the moisture flux.
Data for this map were
acquired on the summer solstice, after the sea ice had started its
annual retreat toward its minimum extent (usually reached in September).
The transition between sea ice and ocean water is visible where the
moisture flux switches from negative (blue) over the solid sea ice pack
to positive (red) over ice-free waters...
https://climate.nasa.gov/news/2267/arctic-moisture-on-the-move/
___________________________
Investigate the feedback mechanisms of Arctic clouds and radiation on sea ice changes
2021
https://ceres.larc.nasa.gov/documents/STM/2021-05/26_Dong_CERES_STM_20210512_350_Huang.pdf
___________________________
Arctic Cloud, Radiation and their Interactions with Sea Ice
2021
https://repository.arizona.edu/handle/10150/642163
___________________________
High levels of ultraviolet radiation observed by ground-based instruments below the 2011 Arctic ozone hole
01 Nov 2013
https://acp.copernicus.org/articles/13/10573/2013/
___________________________
Ionizing Radiation: how fungi cope, adapt, and exploit with the help of melanin
2008 Oct 24
https://www.ncbi.nlm.nih.gov/pmc/articles/PMC2677413/
___________________________
Concentrations
of sunscreens and antioxidant pigments in Arctic Calanus spp. in
relation to ice cover, ultraviolet radiation, and the phytoplankton
spring bloom
30 September 2015
https://aslopubs.onlinelibrary.wiley.com/doi/10.1002/lno.10194
___________________________
Evaluation of the Arctic surface radiation budget in CMIP5 models
https://ntrs.nasa.gov/api/citations/20170008772/downloads/20170008772.pdf
___________________________
Stratospheric ozone loss-induced cloud effects lead to less surface ultraviolet radiation over the Siberian Arctic in spring
2021
https://iopscience.iop.org/article/10.1088/1748-9326/ac18e9
___________________________
UV Radiation and Arctic Ecosystems
https://www.kobo.com/us/en/ebook/uv-radiation-and-arctic-ecosystems
___________________________
Biological Oceanography
https://www.kobo.com/us/en/ebook/biological-oceanography-1
___________________________
Global Environment
https://www.kobo.com/us/en/ebook/global-environment
___________________________
Radiation: Ultraviolet (UV) radiation
9 March 2016
https://www.who.int/news-room/questions-and-answers/item/radiation-ultraviolet-(uv)
___________________________
Global and Arctic effective radiative forcing of anthropogenic gases and aerosols in MRI-ESM2.0
10 August 2020
Abstract
The effective radiative forcing (ERF) of anthropogenic gases and aerosols under present-day conditions relative to preindustrial conditions is estimated using the Meteorological Research Institute Earth System Model version 2.0 (MRI-ESM2.0) as part of the Radiative Forcing Model Intercomparison Project (RFMIP) and Aerosol and Chemistry Model Intercomparison Project (AerChemMIP), endorsed by the sixth phase of the Coupled Model Intercomparison Project (CMIP6). The global mean total anthropogenic net ERF estimate at the top of the atmosphere is 1.96 W m−2 and is composed primarily of positive forcings due to carbon dioxide (1.85 W m−2), methane (0.71 W m−2), and halocarbons (0.30 W m−2) and negative forcing due to the total aerosols (− 1.22 W m−2). The total aerosol ERF consists of 23% from aerosol-radiation interactions (− 0.32 W m−2), 71% from aerosol-cloud interactions (− 0.98 W m−2), and slightly from surface albedo changes caused by aerosols (0.08 W m−2). The ERFs due to aerosol-radiation interactions consist of opposing contributions from light-absorbing black carbon (BC) (0.25 W m−2) and from light-scattering sulfate (− 0.48 W m−2) and organic aerosols (− 0.07 W m−2) and are pronounced over emission source regions. The ERFs due to aerosol-cloud interactions (ERFaci) are prominent over the source and downwind regions, caused by increases in the number concentrations of cloud condensation nuclei and cloud droplets in low-level clouds. Concurrently, increases in the number concentration of ice crystals in high-level clouds (temperatures < –38 °C), primarily induced by anthropogenic BC aerosols, particularly over tropical convective regions, cause both substantial negative shortwave and positive longwave ERFaci values in MRI-ESM2.0. These distinct forcings largely cancel each other; however, significant longwave radiative heating of the atmosphere caused by high-level ice clouds suggests the importance of further studies on the interactions of aerosols with ice clouds. Total anthropogenic net ERFs are almost entirely positive over the Arctic due to contributions from the surface albedo reductions caused by BC. In the Arctic, BC provides the second largest contribution to the positive ERFs after carbon dioxide, suggesting a possible important role of BC in Arctic surface warming.
https://progearthplanetsci.springeropen.com/articles/10.1186/s40645-020-00348-w
___________________________
Arctic stratospheric ozone depletion and increased UVB radiation: potential impacts to human health
2005
https://www.tandfonline.com/doi/pdf/10.3402/ijch.v64i5.18032
___________________________
A Steep Latitudinal Gradient of Solar Ultraviolet-B Radiation in the Arctic-Alpine Life Zone
01 June 1980
https://esajournals.onlinelibrary.wiley.com/doi/abs/10.2307/1937426
___________________________
Into the mist of studying the mystery of Arctic low level clouds
August 10, 2018
https://blogs.egu.eu/divisions/as/2018/08/10/into-the-mist-of-studying-the-mystery-of-arctic-low-level-clouds/
___________________________
Effects of Arctic haze on low-level stratus properties and the surface radiation budget
2007
https://ui.adsabs.harvard.edu/abs/2007PhDT........40Z/abstract
___________________________
Shrinking Atmospheric Layer Linked to Low Levels of Solar Radiation
August 26, 2010
https://www.nsf.gov/news/news_summ.jsp?cntn_id=117580
___________________________
RADIATION AND CLOUD OBSERVATIONS ON A HIGH ARCTIC PLATEAU ICE CAP
1987
https://www.cambridge.org/core/services/aop-cambridge-core/content/view/5484905C28A9411C4BD646E1B9A0AE36/S0022143000008649a.pdf/div-class-title-radiation-and-cloud-observations-on-a-high-arctic-plateau-ice-cap-div.pdf
___________________________
Effects of reducing the ambient UV-B radiation in the high Arctic on Salix arctica and Vaccinium uliginosum
2005
https://orbit.dtu.dk/en/publications/effects-of-reducing-the-ambient-uv-b-radiation-in-the-high-arctic
___________________________
Dynamical
Response of an Arctic Mixed-Phase Cloud to Ice Precipitation and
Downwelling Longwave Radiation From an Upper-Level Cloud
Jan 27 2020
https://pennstate.pure.elsevier.com/en/publications/dynamical-response-of-an-arctic-mixed-phase-cloud-to-ice-precipit
___________________________
Assessment
of the effects of acid-coated ice nuclei on the Arctic cloud
microstructure, atmospheric dehydration, radiation and temperature
during winter
15 March 2012
https://rmets.onlinelibrary.wiley.com/doi/abs/10.1002/joc.3454
___________________________
Arctic Clouds and Surface Radiation – a critical comparison of satellite retrievals and the ERA-Interim reanalysis
2012
https://pure.mpg.de/rest/items/item_1517160_8/component/file_1539280/content
___________________________
Characteristics of the Reanalysis and Satellite-Based Surface Net Radiation Data in the Arctic
2020
In this study, we compared four net radiation products: the fifth generation of European Centre for Medium-Range Weather Forecasts atmospheric reanalysis of the global climate (ERA5), National Centers for Environmental Prediction (NCEP), Clouds and the Earth’s Radiant Energy System Energy Balanced and Filled (EBAF), and Global Energy and Water Exchanges (GEWEX), based on ground observation data and intercomparison data. ERA5 showed the highest accuracy, followed by EBAF, GEWEX, and NCEP. When analyzing the validation grid, ERA5 showed the most similar data distribution to ground observation data. Different characteristics were observed between the reanalysis data and satellite data. In the case of satellite-based data, the net radiation value tended to increase at high latitudes. Compared with the reanalysis data, Greenland and the central Arctic appeared to be overestimated. All data were highly correlated, with a difference of 6–21 W/m2 among the products examined in this study. Error was attributed mainly to difficulties in predicting long-term climate change and having to combine net radiation data from several sources. This study highlights criteria that may be helpful in selecting data for future climate research models of this region.
https://www.hindawi.com/journals/js/2020/8825870/
___________________________
Unusual Weather Leads to Ozone Low Over the Arctic
2020
https://earthobservatory.nasa.gov/images/146588/unusual-weather-leads-to-ozone-low-over-the-arctic
___________________________
The Role of Downward Infrared Radiation in the Recent Arctic Winter Warming Trend
2017
https://www.jstor.org/stable/26388101
___________________________
Downwelling longwave radiation and atmospheric winter states in the western maritime Arctic
09 September 2014
https://rmets.onlinelibrary.wiley.com/doi/10.1002/joc.4149
___________________________
Arctic Ice Cap Rebounds From 2012 — But Does That Matter?
2013
https://science.slashdot.org/story/13/09/09/0413229/arctic-ice-cap-rebounds-from-2012-but-does-that-matter
___________________________
Arctic sea ice delusions strike the Mail on Sunday and Telegraph
8 Sep 2013
Both UK periodicals focus on short-term noise and ignore the rapid long-term Arctic sea ice death spiral
https://www.theguardian.com/environment/climate-consensus-97-per-cent/2013/sep/09/climate-change-arctic-sea-ice-delusions
___________________________
Radiation levels near this Siberian village were 1,000 times above normal last fall. But no one worried much
Feb. 16, 2018
For
decades the Techa River was used by the Mayak nuclear plant to dump
radioactive wastes. It has resulted in serious contamination of the
water and its banks
Reporting from Khudaiberdynsk, Russia — Boris Salomatin has lived his entire 60 years down a dirt road in the tiny village of Khudaiberdynsk, a few miles from the entrance to the massive Mayak nuclear fuel reprocessing complex.
The year he was born, this Siberian landscape on the edge of the Ural Mountains bore the brunt of one of the world’s worst nuclear accidents. On Sept. 29, 1957, decades before Three Mile Island, Chernobyl and Fukushima entered the lexicon of landmark nuclear disasters, a buried cache of liquid radioactive waste from Mayak exploded. More than a quarter-million people were exposed to radiation, and nearly two dozen villages, home to more than 10,000 people, had to be vacated forever.
From March 1949 to November 1951, environmental activists have learned, radioactive waste was poured directly into the nearby Techa River, and nearby lakes were inundated with pollution as well.
The Soviet government kept the accident secret until 1976, when a dissident published an article about it in New Scientist magazine. By that time, thousands of people who had remained living in the area around the plant had fallen ill with cancer or given birth to children with birth defects.
Salomatin, a retired welder, has never spent too much time worrying about it, because what would be the point?
“What are you going to do?” said Salomatin, who grew up in the shadow of the sprawling nuclear plant built in the 1940s as the base for the former Soviet Union’s nuclear weapons program. “We live like we live. I swim in those lakes all the time. I just don’t swim too deep.”
Yet over the last few months, residents here have been reminded that the threat posed by Mayak, operated inside an officially “closed” city that is off limits to most outsiders, has never really gone away.
In October, European radiation safety agencies detected a cloud containing a radioactive isotope, ruthenium-106, that could be traced to somewhere near Mayak.
The Russian government and its nuclear agency issued a series of denials. Then on Nov. 21, nearly two months after the French and German safety agencies said they had first detected the cloud over Europe, Roshydromet, Russia’s meteorological agency, confirmed that levels of ruthenium-106 had been recorded in late September at levels almost 1,000 times higher than normal in Argayash and 440 times higher in Novogorny, two frequent testing spots within 10 miles of Mayak.
That meant alarming levels of radiation not far from where Salomatin lives, halfway between Argayash and Novogorny, on the road to Ozersk, the closed city.
There’s not much to the town here. In the winter, the school’s soccer field is too frozen to play on. Stray dogs bark and roam outside the fences surrounding compact houses and gardens.
A small store carries basic staples of potatoes, onions and toilet paper. It stands across from the House of Culture, a remnant of the former Soviet Union, where community events were once held. Today, the faded paint peels off the exterior walls. Cars bounce up and down as they swerve to miss potholes in the hard, dirt road. Salomatin and his wife share a small apartment in a two-story building on one of the village’s two main dirt roads.
Even now, Salomatin says he’s not convinced there has been any particular danger; most of the alarm, he says, is being spread by the “yellow press.”
“If someone farts in this side of the village, the yellow press will report that it was a radioactive dust cloud coming from the other side of the village,” he said as he drew on his cigarette.
To prove his point, Salomatin brought out a large plastic bottle full of homemade raspberry preserves. He had picked the berries himself not far from here, he said as he unscrewed the top, tipped the bottle back and let the liquid pour into his mouth.
Gosman Kabirov, an environmental activist from the nearby town of Chelyabinsk, poured a capful of the raspberry syrup onto a piece of cardboard and held his radioactivity dosimeter up to it. The numbers flickered and rested on 12, an acceptable level of radiation, Kabirov said.
Rusatom, the Russian state nuclear energy company that owns Mayak, continues to deny that its facility could be the source of the cloud that drifted over Europe in the fall.
Test samples from Mayak showed “no presence of ruthenium-106,” a Russian interagency investigative commission said in a December report, suggesting that the emissions could have come from a satellite that burned as it fell from the sky.
The French nuclear safety agency rejected that hypothesis, saying there was no record of a satellite falling to Earth during the period of the radioactive cloud’s detection over Europe.
Still, Russian officials seem determined to dispel any fears. Shortly after the news broke of the unusual levels of ruthenium-106, Chelyabinsk’s head oncologist, Andrei Vazhenin, said there was no public health danger; ruthenium-106, he said, isn’t a “pure carcinogenic.”
He had a suggestion for anyone who was worried about their health: They should stay indoors, he said, and “watch football and drink beer.”
https://www.latimes.com/world/europe/la-fg-russia-mayak-20180216-story.html
___________________________
Arctic Coastal Cleanup
Enhancing efforts to remove litter from Arctic beaches and waterways
https://www.arctic-council.org/projects/arctic-coastal-cleanup/
___________________________
A southerly wind event and precipitation in Ny Ålesund, Arctic
2022
https://www.sciencedirect.com/science/article/abs/pii/S136468262200044X
___________________________
Contrasting radiation and soil heat fluxes in Arctic shrub and wet sedge tundra
15 Jul 2016
https://bg.copernicus.org/articles/13/4049/2016/
___________________________
WORLD
WAR FREEZE: US & Russia ‘suspicious’ of each other’s Arctic ‘war
games’ as tensions between rivals reach ‘unprecedented’ level
Aug 10 2021
https://www.the-sun.com/news/3446898/us-russia-war-games-arctic-unprecedented-tensions/
___________________________
Climate explained: why is the Arctic warming faster than other parts of the world?
June 1, 2021
https://theconversation.com/climate-explained-why-is-the-arctic-warming-faster-than-other-parts-of-the-world-160614
___________________________
Heatwaves at both of Earth’s poles alarm climate scientists
20 Mar 2022
Antarctic areas reach 40C above normal at same time as north pole regions hit 30C above usual levels
https://www.theguardian.com/environment/2022/mar/20/heatwaves-at-both-of-earth-poles-alarm-climate-scientists
___________________________
Arctic Snow Depth on Sea Ice
https://earth.gsfc.nasa.gov/cryo/data/arctic-snow-depth-sea-ice
___________________________
Russia’s Arctic Development: Problems and Priorities
12 January 2018
https://geohistory.today/russia-arctic-development-power/
___________________________
Winter sea ice in Bering Sea reached lowest levels in millennia: study
September 2, 2020
https://www.reuters.com/article/us-climate-change-arctic-idUSKBN25T2YN
___________________________
High levels of ultraviolet radiation observed by ground-based instruments below the 2011 Arctic ozone hole
2012
https://core.ac.uk/display/30903803
___________________________
Climate Milestone: Earth’s CO2 Level Passes 400 ppm
May 12, 2013
Greenhouse gas highest since the Pliocene, when sea levels were higher and the Earth was warmer.
https://www.nationalgeographic.com/pages/article/130510-earth-co2-milestone-400-ppm
___________________________
Accelerated decline of summer Arctic sea ice during 1850–2017 and the amplified Arctic warming during the recent decades
19 February 2021
https://iopscience.iop.org/article/10.1088/1748-9326/abdb5f
___________________________
Rate of Environmental Damage Increasing Across Planet but Still Time to Reverse Worst Impacts
2016
https://www.un.org/sustainabledevelopment/blog/2016/05/rate-of-environmental-damage-increasing-across-planet-but-still-time-to-reverse-worst-impacts/
___________________________
Aluminum vs Acid is Crazy
2021
https://www.youtube.com/shorts/n4W-3UgN_Hg
___________________________
Alaskan Tundra
https://microbewiki.kenyon.edu/index.php/Alaskan_tundra
___________________________
Permafrost thaw brings major problems to Canada’s Northern Arctic communities
December 2020
https://www.nrcan.gc.ca/simply-science/permafrost-thaw-brings-major-problems-canadas-northern-arctic-communities/23233
___________________________
What's Causing Sea-Level Rise? Land Ice Vs. Sea Ice
https://www.jpl.nasa.gov/edu/teach/activity/whats-causing-sea-level-rise-land-ice-vs-sea-ice/
___________________________
Arctic and Antarctic lakes as optical indicators of global change
20 January 2017
https://www.cambridge.org/core/journals/annals-of-glaciology/article/arctic-and-antarctic-lakes-as-optical-indicators-of-global-change/8F5F9C5967587A80548A625627DB0C1E
___________________________
Are Arctic Sea Ice Melts Causing Sea Levels to Rise?
June 13, 2008
Recent
NASA photos showed the opening of the Northwest Passage and that a
third of the Arctic's sea ice has melted in recent decades. Are sea
levels already starting to rise accordingly? If so, what effect is this
having?
https://www.scientificamerican.com/article/arctic-ice-melts-cause-rising-sea/
___________________________
Living on the dark side? Investigations into under-ice light climate and sympagic amphipods
2022
https://munin.uit.no/handle/10037/25272
___________________________
What is Radiation Heat Transfer – Definition
2019-05-22
https://www.thermal-engineering.org/what-is-radiation-heat-transfer-definition/
____________________________
Blast at Russian missile testing ground leads to jump in radiation levels
08.08.19
https://www.unian.info/world/10645323-blast-at-russian-missile-testing-ground-leads-to-jump-in-radiation-levels.html
____________________________
Canada Has Second-Worst Mining Record in World: UN
Oct. 27, 2017
https://thenarwhal.ca/canada-has-second-worst-mining-record-world-un/
____________________________
How green sand could capture billions of tons of carbon dioxide
June 22, 2020
Scientists
are taking a harder look at using carbon-capturing rocks to counteract
climate change, but lots of uncertainties remain.
https://www.technologyreview.com/2020/06/22/1004218/how-green-sand-could-capture-billions-of-tons-of-carbon-dioxide/
____________________________
Sand mining: the global environmental crisis you’ve probably never heard of
27 Feb 2017
https://www.theguardian.com/cities/2017/feb/27/sand-mining-global-environmental-crisis-never-heard
____________________________
Climate Change
https://inhabitat.com/can-manufacturing-green-sand-beaches-save-our-planet/
____________________________
Who cleans up? No requirements to fix environmental impacts from mining, auditor says
2019
https://www.cbc.ca/news/canada/edmonton/mining-pollution-audit-1.5082511
____________________________
The Effects of Mining on the Canadian Shield
Canada
is very rich in minerals, mostly on the Canadian Shield. The miners
mined for zinc, copper, lead, nickel, iron, cobalt, gold, antimony, and
tin. These minerals are found in the metal mining sector and when the
excess dirt has been dug up, the miners don't care, and throw the dirt
into the waters, polluting the waters. These careless actions result in
acidic drainage, mine de-watering, liquid effluents from the milling
proccess, surface water drainage, and seepage from waste ater storage as
showed before.
https://miningincanada.weebly.com/the-effects--mining.html
____________________________
From Canadian Coal Mines, Toxic Pollution That Knows No Borders
April 1, 2019
Massive
open-pit coal mines in British Columbia are leaching high
concentrations of selenium into the Elk River watershed, damaging fish
populations and contaminating drinking water. Now this pollution is
flowing across the Canadian-U.S. border, threatening the quality of U.S.
waters.
https://e360.yale.edu/features/from-canadian-coal-mines-toxic-pollution-that-knows-no-borders
____________________________
Canada Failed at Monitoring Waste Dumps From Mining Companies
2019
https://www.nationalobserver.com/2019/04/02/news/canada-failed-monitoring-waste-dumps-mining-companies
____________________________
10 Threats from the Canadian Tar Sands Industry
August 13, 2015
At every turn, the tar sands invasion would put people and the environment in harm's way.
https://www.nrdc.org/stories/10-threats-canadian-tar-sands-industry
____________________________
Canada sets a world standard for sustainable mining
2021
https://www.tradecommissioner.gc.ca/canadexport/0003604.aspx?lang=eng
____________________________
Sand mining: the environmental challenge you’ve probably never heard of
Jun 30, 2022
https://www.weforum.org/agenda/2022/06/global-sand-mining-demand-impacting-environment/
____________________________
The Dirty Fight Over Canadian Tar Sands Oil
December 31, 2015
Dredging up oil from under Canada’s boreal forest and piping it through the United States is a lose-lose proposition.
https://www.nrdc.org/stories/dirty-fight-over-canadian-tar-sands-oil
____________________________
Yukon wetlands pushed to tipping point by placer mining, First Nation and conservationists say
Dec. 11, 2020
https://www.thestar.com/news/canada/2020/12/11/yukon-wetlands-pushed-to-tipping-point-by-placer-mining-first-nation-and-conservationists-say.html
____________________________
Unprecedented 32.5C in the Arctic Circle during month of smashed global temperature records
2 July 2022
Climate
change projections say that global warming will make these events more
likely, with heatwaves growing more intense, more frequent and
longer-lasting.
https://news.sky.com/story/unprecedented-32-5c-in-the-arctic-circle-during-month-of-smashed-global-temperature-records-12643828
___________________________
What caused massive Arctic ozone hole in 2020? This study has some answers
Sep 24, 2021
https://www.wionews.com/science/what-caused-massive-arctic-ozone-hole-in-2020-this-study-has-some-answers-415279
___________________________
Arctic ozone depletion reached record level
1 May 2020
https://public.wmo.int/en/media/news/arctic-ozone-depletion-reached-record-level
___________________________
UN agency confirms 2020 Arctic heat record
14 Dec 2021
An
Arctic temperature record of more than 100 Fahrenheit (38 Celsius) was
reached in a Siberian town last year during a prolonged heatwave that
caused widespread alarm about the intensity of global warming, a UN
agency confirmed on Tuesday.
https://bdnews24.com/environment/2021/12/14/un-agency-confirms-2020-arctic-heat-record
___________________________
The Arctic fails its annual health check as global warming brings more ills to the region
December 14, 2021
https://www.cnn.com/2021/12/14/world/noaa-climate-change-arctic-report/index.html
___________________________
Arctic warming three times faster than the planet, report warns
May 20, 2021
https://phys.org/news/2021-05-arctic-faster-planet.html
___________________________
Arctic sea ice thinning twice as fast as thought, study finds
4 Jun 2021
Less ice means more global heating, a vicious cycle that also leaves the region open to new oil extraction
https://www.theguardian.com/world/2021/jun/04/arctic-sea-ice-thinning-twice-as-fast-as-thought-study-finds
___________________________
SPECIAL REPORT: ‘On thin ice: Rising tensions in the Arctic’
Jul 8, 2022
https://www.youtube.com/watch?v=kXI_EzOBnOs
___________________________
Melting Arctic ice will have catastrophic effects on the world, experts say. Here's how.
December 24, 2021
https://abcnews.go.com/International/melting-arctic-ice-catastrophic-effects-world-experts/story?id=81588333
___________________________
Arctic methane release due to melting ice is likely to happen again
March 22, 2021
https://www.sciencedaily.com/releases/2021/03/210322135221.htm
___________________________
NASA: 2021 Arctic Sea Ice Maximum Extent Ranks Seventh-Lowest on Record
June 7, 2021
https://scitechdaily.com/nasa-2021-arctic-sea-ice-maximum-extent-ranks-seventh-lowest-on-record/
___________________________
Arctic sea ice maximum: Crisis as ice melts and risks rise
Mar 28, 2025
___________________________
Quiz: Which 2021 Arctic Council report should you read based on your interests?
25 October 2021
https://www.arctic-council.org/news/quiz-which-2021-arctic-council-report-should-you-read/
___________________________
NASA Finds 2021 Arctic Summer Sea Ice 12th Lowest on Record
September 22, 2021
https://climate.nasa.gov/news/3114/nasa-finds-2021-arctic-summer-sea-ice-12th-lowest-on-record/
___________________________
Arctic Ice Coverage Is Up Substantially—So Media Ignores It
September 29, 2021
https://www.climatedepot.com/2021/09/29/arctic-ice-coverage-is-up-substantially-so-media-ignores-it/
___________________________
Polar vortex to unleash frigid Arctic blast
February 10, 2021
https://www.cbsnews.com/news/polar-vortex-weather-news-cold-arctic-blast/
___________________________
The US is suffering through a polar vortex.
Paradoxically, we may have global warming to thank for that.
2019
___________________________
Beaufort Sea fractured ice due to strong Beaufort Gyre action – not early melt
May 12, 2016
The Canadian Ice Service has a cool NASA animated video showing the Beaufort Gyre in action – you can actually see the solid mass of ice crack and swirl west and north under the pressure of the massive corkscrew current – see original here (tips on getting yourself oriented in the video below the screencap) and view below, for Apri 4- May 3, 2016:
The big ‘bite” of ice being torn out to the south of Banks Island is the Amundsen Gulf.
The caption for the NASA video says this (my bold):
“MODIS Terra imagery taken between April 4 and May 3, 2016 of the Beaufort Sea. The animation highlights the gradual ice breakup due to the Beaufort gyre.”
So, early breakup here is due to Beaufort Gyre action – not early seasonal melt.
A simplified graphic of the Beaufort Gyre in relation to Arctic circulation (from Athropolis):
Two maps from the US Naval Research Lab shows how ice thickness has changed between early April (7 April, below) and early May (11 May 2016, follows). The fracturing of the ice is evident in the most recent image and makes it clear it is not only thin ice that is breaking – there is fracturing in 3.5-4.0 m and even 5.0 m thick ice as well as in the thinner (see more maps at the WUWT Sea Ice Page):
As I pointed out in my last post, open water at this time of year is generally good news for polar bears because it’s good news for seals, which I discussed last year in relation to open water in spring:
“…here is what marine mammal biologists Ian Stirling and colleagues had to say about polar bears and the Cape Bathurst polynya in spring (Stirling et al. 1981:49):
“Polar bears prey mainly upon ringed seals and, to a lesser degree, on bearded seals. Polar bears appear to be more abundant in polynya areas and along shoreleads, probably because the densities of seals are greater and they are more assessable. For example, between March and June in the Beaufort Sea from 1971 through 1975, 87% of the sightings of polar bears were made adjacent to floe edges or in unstable areas of 9/10 or 10/10 ice cover with intermittent patches of young ice.” [my bold]
Later, they discussed why these areas of open water can be so important in the Southern Beaufort area (Stirling et al. 1981:54):
“One useful approach is to ask what would happen if the polynya was not there? Obviously this is impossible to evaluate on an experimental basis, but by examining the consequences or natural seasonal variation, some useful insights can be gained. For example, the influence of rapidly changing ice conditions on the availability of open water, and consequently on populations of seals and polar bears, has been observed in the western Arctic. Apparently in response to severe ice conditions in the Beaufort Sea during winter 1973-74, and to a lesser degree in winter 1974-75, numbers of ringed and bearded seals dropped by about 50% and productivity by about 90%. Concomitantly, numbers and productivity of polar bears declined markedly because of the reduction in the abundance of their prey species. …If the shoreleads of the western Arctic or Hudson Bay ceased opening during winter and spring, the effect on marine mammals would be devastating.”[my bold]
In other words, Stirling and colleagues suggested in 1981 that the marked declines in ringed seal, bearded seal and polar bear numbers in the mid-1970s (discussed many times on this blog – most recently here) was due primarily to the fact that the Cape Bathurst polynya did not develop as usual because thick ice conditions prevented it.
Polynya references cited above are in that post (Tracking polar bears in the Beaufort Sea in April 2016 and early polyna formation).
It’s possible the kind of open water we’re seeing this spring is good for seals but not so good for polar bears but that remains to be seen. As far as I know, this is a new situation that has not previously been witnessed with this kind of precision – it doesn’t mean it has never happened before, just that we have never been able to watch it happen.
But if it’s bad news for polar bears, it will only serve to emphasize how critical spring conditions are for the bears – if more individuals than usual cannot feed as intensively as they need to, they will have trouble making it through the summer and winter later in the year. However, conditions would have to be exceedingly bad to be more harmful to polar bears than thick spring ice conditions, such as occurred in 1974-76 and 2004-2006, when many, many bears died of starvation.
___________________________
Dominant inflation of the Arctic Ocean’s Beaufort Gyre in a warming climate
20 January 2025
Abstract
The Arctic Ocean’s Beaufort Gyre, the largest Arctic freshwater reservoir, plays a crucial role for climate and marine ecosystems. Understanding how it changes in a warming climate is therefore essential. Here, using high-resolution simulations and Coupled Model Intercomparison Project phase 6 data, we find that the Beaufort Gyre will increasingly accumulate freshwater, elevate sea level, and spin up its circulation as the climate warms. These changes, collectively referred to as inflation, are more pronounced in the Beaufort Gyre region than in other Arctic areas, amplifying the spatial asymmetry of the Arctic Ocean. The inflation is driven by increased surface freshwater fluxes and intensified surface stress from wind strengthening and sea ice decline. Current climate models tend to underestimate this inflation, which could be alleviated by high-resolution ocean models and improved atmospheric circulation simulations. The inflation of the Beaufort Gyre underscores its growing importance in a warming climate.
Introduction
The Arctic Ocean, a critical component of Earth’s climate system, is undergoing rapid changes1,2,3,4. Among various Arctic regions, the large, clockwise-rotating Beaufort Gyre in the Arctic Ocean’s Canada Basin stands out as one of the most prominent features5. The Beaufort Gyre serves as a vast reservoir of freshwater, accumulating input from river runoff, precipitation, melting sea ice, and low-salinity water from the Pacific6,7,8,9. In the central Beaufort Gyre, surface salinity fell below 27 during the summer months in recent years10,11, and the isohaline corresponding to the Arctic mean salinity of 34.812 is located at approximately 400 meters depth.
Arctic freshwater storage is crucial for upper ocean stratification, influencing ocean stability, vertical heat flux and thus sea ice melting13,14,15. Sea ice retreat can amplify Arctic warming and climate change16. Furthermore, the release of freshwater from the Beaufort Gyre into the North Atlantic can affect upper ocean stratification and wintertime deep convection in regions of dense water formation, thereby impacting the Atlantic Meridional Overturning Circulation (AMOC)17,18,19,20, a key player in regulating global climate. Moreover, the gyre’s ability to retain and release freshwater has strong implications for the Arctic Ocean’s salinity and density gradients, influencing the broad circulation pattern in the Arctic Ocean21. Importantly, changes in the Beaufort Gyre circulation and stratification can also modify local concentration of dissolved oxygen and acidified water, with profound impacts on marine ecosystems22,23.
During the past two decades, the Beaufort Gyre has experienced notable changes. These changes are marked by increases in the gyre’s sea level and circulation strength24, the volume of freshwater it retains25,26,27, and mesoscale eddy activity28, induced by factors such as sea ice decline and atmospheric circulation changes29,30,31,32. In particular, the amount of freshwater stored in the Beaufort Gyre reached an unprecedented high in the late 2010s3,11,33,34. Part of the anomalous freshwater from the Beaufort Gyre, released over the past few years, has accumulated in a buffer zone north of Greenland and the Canadian Arctic Archipelago35. As the Arctic continues to lose sea ice, the state of the Beaufort Gyre is expected to shift, potentially leading to substantial changes in the Arctic Ocean’s physical and biogeochemical environment.
The Beaufort Gyre’s importance for climate and marine ecosystems points to the need for a better understanding of how it will evolve in a warming climate. Predicting future ocean changes relies on coupled climate model projections, but simulating the Arctic Ocean and the Beaufort Gyre faces challenges. Current climate models often struggle with adequately representing salinity, temperature and stratification in the Arctic Ocean36,37,38,39. In particular, most Coupled Model Intercomparison Projects (CMIP) models exhibit a fresh bias in the Arctic halocline37 and simulate an oversized Beaufort Gyre38. Ocean-sea ice model simulations forced by prescribed atmospheric reanalysis fields tend to have similar model biases40,41. It was found that increasing horizontal resolution can help reduce model biases in simulated Arctic hydrography42,43. The recent 6th phase of CMIP (CMIP6) does not demonstrate clear improvements in simulating Arctic hydrography compared with previous CMIP phases37,41, likely due to the continued use of coarse resolutions in most CMIP6 simulations. To improve the fidelity of future projections for the Arctic Ocean, efforts are needed to reduce model biases.
This paper utilizes CMIP6 dataset and dedicated high-resolution ocean-sea ice model simulations to elucidate future changes in Arctic Ocean freshwater and circulation (see Methods). We find that the Beaufort Gyre will increasingly accumulate freshwater in a warming climate, playing a dominant role in shaping the Arctic Ocean’s circulation pattern. High-resolution simulations predict a much stronger spin-up of the Arctic Ocean circulation compared to CMIP6 models. Correcting a severe, common model bias in atmospheric circulation considerably intensifies projected increases in freshwater content, sea surface height, ocean current speeds, and eddy activity in the Beaufort Gyre region, further underscoring the dominance of the Beaufort Gyre inflation in future Arctic Ocean changes.
https://www.nature.com/articles/s43247-025-02028-3
___________________________
Sediment trap-derived particulate matter fluxes in the oligotrophic subtropical gyre of the South Indian Ocean
___________________________
Recent changes in sea ice area flux through the Beaufort Sea during the summer
22 March 2016
Abstract
Over the annual cycle, sea ice is sequestered from the Canadian Basin and transported through the Beaufort Sea toward the Chukchi Sea. In recent years, the Beaufort Sea has experienced considerable ice loss during the summer, which may be indicative of recent changes to this process. In order to investigate this, we quantify the sea ice area flux using RADARSAT from 1997 to 2014 at three gates in Beaufort Sea: the Canadian Basin (entrance), mid-Beaufort (midpoint), and Chukchi (exit). There was a mean annual flux of 42 ± 56 × 103 km2 at the Canadian Basin gate, 94 ± 92 × 103 km2 at the mid-Beaufort gate and −83 ± 68 × 103 km2 at the Chukchi gate (positive and negative flux signs correspond to ice inflow and outflow, respectively). The majority of ice transport in Beaufort Sea was found to occur from October to May providing replenishment for ice lost during the summer months. The cross-strait gradient in sea level pressure explains ∼40% of the variance in the ice area flux at the gates. Remarkably, the mean July–October net sea ice area flux at the Chukchi gate decreased by ∼80% from 2008 to 2014 relative to 1997–2007 and became virtually ice-free every year since 2008. This reduction was associated with younger (thinner) ice that was unable to survive the summer melt season when either being sequestered from the Canadian Basin and transported through Beaufort Sea during the melt season (2008–2011) or remaining immobile and present in the vicinity of the Chukchi gate during the melt season (2012–2014).
https://agupubs.onlinelibrary.wiley.com/doi/full/10.1002/2015JC011464
___________________________
Salinity and Temperature Regimes in Eastern Alaskan Beaufort Sea Lagoons in Relation to Source Water Contributions
01 August 2016
Abstract
Shallow estuarine lagoons characterize >70 % of the eastern Alaskan Beaufort Sea coastline and, like temperate and tropical lagoons, support diverse and productive biological communities. These lagoons experience large variations in temperature (−2 to 14 °C) and salinity (0 to >45) throughout the year. Unlike lower latitude coastal systems, transitions between seasons are physically extreme and event-driven. On Arctic coastlines, a brief summer open-water period is followed by a 9-month ice-covered period that concludes with a late-spring sea ice breakup and intense freshwater run-off. From 2011 to 2014, we examined interannual variations in water column physical structure (temperature, salinity, and δ18O) in five lagoons that differ with respect to their degree of exchange with adjacent marine waters and magnitude of freshwater inputs. Temperature, salinity, and source water composition (calculated using a salinity and δ18O mixing model) were variable in space and time. During sea ice breakup in June, water column δ18O and salinity measurements showed that low salinity waters originated from meteoric inputs (50–80 %; which include river inputs and direct precipitation) and sea ice melt (18–51 %). Following breakup, polar marine waters became prevalent within a mixed water column over the summer open-water period within all five lagoons (26–63 %). At the peak of ice-cover extent and thickness in April, marine water sources dominated (75–87 %) and hypersaline conditions developed in some lagoons. Seasonal runoff dynamics and differences in lagoon geomorphology (i.e., connectivity to the Beaufort Sea) are considered key potential drivers of observed salinity and source water variations.
https://link.springer.com/article/10.1007/s12237-016-0123-z
___________________________
Gyres, jets and waves in the Earth’s core
Abstract
Turbulent motions of liquid metal in Earth’s outer core generate the geomagnetic field. Magnetic field observations from low-Earth-orbit satellites, together with advanced numerical simulations, indicate that present-day core motions are dominated by a planetary-scale gyre, a jet in the northern polar region and waves involving the magnetic field. In this Review, we explore the dynamics of core gyres, jets and waves and discuss their impact on the magnetism and rotation of the Earth. The planetary gyre is anticyclonic, offset from the rotation axis towards low latitudes under the Atlantic hemisphere and involves flow speeds of 15–50 km yr−1 that are fastest in a focused westward jet under the Bering Strait. A quasi-geostrophic, Magnetic–Archimedes–Coriolis force balance is thought to control the dynamics of the planetary gyre and high latitude jet. Waves in the core flow with periods ~7 years have been detected at low latitudes, that are consistent with an interplay among magnetic, Coriolis and inertial effects. The arrival of wave energy at the core surface accounts for many of the characteristics of interannual geomagnetic field variations. Fluctuations in outer core flow patterns, including the planetary gyre, account for decadal changes in Earth’s length of day, while interannual changes are well explained by wave processes. Systematic investigations of core–mantle coupling mechanisms in models that include wave dynamics promise new insights on poorly constrained physical properties, including deep mantle conductivity. Long-term satellite monitoring of changes in the Earth’s magnetic field is essential if further progress is to be made in understanding core dynamics, as the high-resolution magnetic record remains short compared with the timescales of waves and convection in the core.
Key points
-
Since 1999, satellite observations have provided a reliable global picture of how Earth’s magnetic field is changing on interannual-to-decadal timescales. The most intense changes are found at mid-to-low latitudes under the Atlantic hemisphere and under Alaska and Siberia at high northern latitudes.
-
Global knowledge of geomagnetic field changes, together with an understanding of the motional induction process in the core, enables the general circulation of liquid metal in the outer core to be inferred.
-
Key features of the core flow include a planetary-scale, eccentric, anticyclonic gyre with an intense jet-like concentration under the Bering Strait and waves at low latitudes.
-
Numerical simulations of core dynamics are now approaching conditions relevant to Earth. These demonstrate that a combination of core convection and hydromagnetic waves can account for the observed field variations.
-
Recorded changes in the length of day on interannual and decadal periods over the past century are well explained by changes in the axisymmetric part of the core flow inferred from geomagnetic observations.
___________________________
Evolution of the Arctic Ocean boundary current north of the Siberian shelves
2000
https://www.sciencedirect.com/science/article/abs/pii/S0924796300000099
___________________________
Driftwood reveals ancient Arctic currents and sea-ice levels
December 28, 2017
Arctic driftwood up to 12,000 years old is giving scientists a better understanding of how ocean currents and sea ice in the far north have changed through the Holocene. In a new study, published in the Journal of Geophysical Research: Oceans, scientists at the University of Oxford in England studied more than 900 pieces of driftwood collected from Arctic shorelines since the 1950s to investigate how shifting Arctic Ocean currents help melt or fortify sea ice.
The trees from which the driftwood samples came grew in different parts of the Arctic throughout the Holocene, which began about 11,700 years ago. Picked up from the forest floor by wind or rain, tree branches and other pieces of wood can find their way into rivers that flow into the Arctic Ocean. The wood can then be incorporated into sea ice as it freezes and float — as passengers in the ice — along with ocean currents. When the ice melts, the wood is then washed ashore on Arctic beaches, where the lack of vegetation and seasonally limited sunlight slow its decay, making Arctic driftwood ideal for radiocarbon dating.
All of the specimens considered in the new study had previously been radiocarbon dated by other teams, but the Oxford researchers, geologists Georgia Hole and Marc Macias-Fauria, are the first to use the wood as a proxy for past sea-ice coverage and ocean currents. Using driftwood as a proxy can provide better resolution than ocean sediment cores, says Hole, lead author of the new study. “When you look at ocean cores, you are seeing resolution at 1,000 years. We can see changes in climate on a scale of 200 to 500 years.”
By studying differences in tree-ring patterns and the presence of fungi within the driftwood specimens, the team was able to identify wood from tree species from the genera Larix, Picea, and Pinus that are unique to parts of Canada, Eurasia and Siberia. Once the researchers knew where the driftwood came from, where it was found, and how old it was, they could identify the route the wood took through the ocean, which let them know how the prevailing currents flowed when each piece of driftwood was making its trip across the Arctic Ocean.
There are two large-scale, controlling currents in the Arctic: the Beaufort Gyre (BG), a counterclockwise current that is known to promote sea-ice preservation, and the Transpolar Drift (TPD), a current that exports sea ice and expedites melting. The TPD directs ice and its driftwood passengers from Siberia west, through the Fram Strait, to Greenland and Svalbard. The Beaufort Gyre, however, traps sea ice in the Arctic. When there’s a high concentration of sea ice in the Arctic, less melting occurs, and the wood is trapped, frozen within the ice. When sea-ice extent is low, more ice melts and, in turn, less ice blocks the coast, so the driftwood can float onto shorelines. Based on the ages of the driftwood, where the wood samples were collected, and how many samples were found during different periods of the Holocene, the team was able to deduce how sea-ice cover fluctuated throughout the 12,000 years studied.
The researchers found that during the early Holocene, from about 12,000 to 8,000 years ago, the BG dominated in the Arctic Ocean, and the sea-ice concentration was high while driftwood deposition was low. Temperatures rose from 8,000 to 4,000 years ago, and the extent of sea ice and shore-fast ice decreased as the TPD melted sea-ice and washed driftwood ashore. Then, 4,000 years ago temperatures cooled and the BG allowed the sea-ice extent to increase again. The two currents alternated dominating the Arctic on roughly 100-year timescales for most of the past 2,000 years, although recently the currents have alternated even more rapidly — on annual to decadal scales.
With warming temperatures, recent decades have also seen dramatic declines in Arctic sea ice: Ice volume has decreased 75 percent since the 1980s, and the annual maximum winter sea-ice extent last March was the lowest ever recorded in the Arctic, according to the National Snow and Ice Data Center. Bright-white sea ice regulates heat absorption in the Arctic by reflecting sunlight back into space. With less ice, there are more areas of dark open ocean to absorb heat and contribute to further warming.
The connections among increasing air and sea-surface temperatures, ocean current dominance and sea-ice preservation in the Arctic today, however, are not entirely clear. Josefino Comiso, emeritus scientist at NASA’s Cryospheric Sciences Laboratory who was part of the first global sea-ice mapping research project, says that although this study gives us insight into how ice cover has changed in the past, “it’s challenging to make conclusions in the present using proxy data, especially on issues that are so important.” Comiso says he wants to see more studies quantify Arctic sea-ice exports: “What volume of ice goes through the Fram Strait every year? So far, there’s no trend that is consistent with the decrease we’ve seen in sea-ice cover.”
But, identifying physical processes like the BG and the TPD, which have
melted and fortified sea ice in the past, allows scientists to zero in
on what physical and chemical processes are causing sea-ice loss today.
“We know the Arctic is a controlling system for the overall [global]
climate,” Hole says. “Seeing what sea-ice conditions were in the past,
and how they changed is important. It gives us insight into how Arctic
systems respond to temperature change.”
https://www.earthmagazine.org/article/driftwood-reveals-ancient-arctic-currents-and-sea-ice-levels
___________________________
Stratigraphic distribution of the radiolarian Spongodiscus biconcavus Haeckel at IODP Site U1340 in the Bering Sea and its paleoceanographic significance
March 2014
Abstract and Figures
___________________________
North Atlantic Gyre
https://en.wikipedia.org/wiki/Ocean_gyre
The North Atlantic Gyre of the Atlantic Ocean is one of five great oceanic gyres. It is a circular ocean current, with offshoot eddies and sub-gyres, across the North Atlantic from the Intertropical Convergence Zone (calms or doldrums) to the part south of Iceland, and from the east coasts of North America to the west coasts of Europe and Africa.
In turn it is chiefly subdivided into the Gulf Stream flowing northward along the west; its often conflated continuation, the North Atlantic Current across the north; the Canary Current flowing southward along the east; and the Atlantic's North Equatorial Current in the south. The gyre has a pronounced thermohaline circulation, bringing salty water west from the Mediterranean Sea and then north to form the North Atlantic Deep Water.
The gyre traps anthropogenic (human-made) marine debris in its natural garbage or flotsam patch, in the same way the North Pacific Gyre has the Great Pacific Garbage Patch.[1]
At the heart of the gyre is the Sargasso Sea, noted for its still waters and quite dense seaweed accumulations.
Garbage Patch
The North Atlantic garbage patch is a garbage patch of man-made marine debris found floating within the North Atlantic Gyre, originally documented in 1972.[22] A 22-year research study conducted by the Sea Education Association estimates the patch to be hundreds of kilometers across, with a density of more than 200,000 pieces of debris per square kilometer.[23][24][25][26] The garbage originates from human-created waste traveling from rivers into the ocean and mainly consists of microplastics.[27] The garbage patch is a large risk to wildlife (and to humans) through plastic consumption and entanglement.[28]
There have only been a few awareness and clean-up efforts for the North Atlantic garbage patch, such as The Garbage Patch State at UNESCO and The Ocean Cleanup, as most of the research and cleanup efforts have been focused on the Great Pacific Garbage Patch, a similar garbage patch in the north Pacific.
https://en.wikipedia.org/wiki/North_Atlantic_Gyre
___________________________
Ocean gyre
In oceanography, a gyre (/ˈdʒaɪər/) is any large system of ocean surface currents moving in a circular fashion driven by wind movements. Gyres are caused by the Coriolis effect; planetary vorticity, horizontal friction and vertical friction determine the circulatory patterns from the wind stress curl (torque).[1]
Gyre can refer to any type of vortex in an atmosphere or a sea,[2] even one that is human-created, but it is most commonly used in terrestrial oceanography to refer to the major ocean systems.
Gyre distribution
Subtropical gyres
There are five major subtropical gyres across the world's oceans: the North Atlantic Gyre, the South Atlantic Gyre, the Indian Ocean Gyre, the North Pacific Gyre, and the South Pacific Gyre. All subtropical gyres are anticyclonic, meaning that in the northern hemisphere they rotate clockwise, while the gyres in the southern hemisphere rotate counterclockwise. This is due to the Coriolis force. Subtropical gyres typically consist of four currents: a westward flowing equatorial current, a poleward flowing, narrow, and strong western boundary current, an eastward flowing current in the midlatitudes, and an equatorward flowing, weaker, and broader eastern boundary current.
North Atlantic Gyre
The North Atlantic Gyre is located in the northern hemisphere in the Atlantic Ocean, between the Intertropical Convergence Zone (ITCZ) in the south and Iceland in the north. The North Equatorial Current brings warm waters west towards the Caribbean and defines the southern edge of the North Atlantic Gyre. Once these waters reach the Caribbean they join the warm waters in the Gulf of Mexico and form the Gulf Stream, a western boundary current. This current then heads north and east towards Europe, forming the North Atlantic Current. The Canary Current flows south along the western coast of Europe and north Africa, completing the gyre circulation. The center of the gyre is the Sargasso Sea, which is characterized by the dense accumulation of Sargassum seaweed.[12]
South Atlantic Gyre
The South Atlantic Gyre is located in the southern hemisphere in the Atlantic Ocean, between the Intertropical Convergence Zone in the north and the Antarctic Circumpolar Current to the south. The South Equatorial Current brings water west towards South America, forming the northern boundary of the South Atlantic gyre. Here, the water moves south in the Brazil Current, the western boundary current of the South Atlantic Gyre. The Antarctic Circumpolar Current forms both the southern boundary of the gyre and the eastward component of the gyre circulation. Eventually, the water reaches the west coast of Africa, where it is brought north along the coast as a part of the eastern boundary Benguela Current, completing the gyre circulation. The Benguela Current experiences the Benguela Niño event, an Atlantic Ocean analogue to the Pacific Ocean's El Niño, and is correlated with a reduction in primary productivity in the Benguela upwelling zone.[13]
Indian Ocean Gyre
The Indian Ocean Gyre, located in the Indian Ocean, is, like the South Atlantic Gyre, bordered by the Intertropical Convergence Zone in the north and the Antarctic Circumpolar Current to the south. The South Equatorial Current forms the northern boundary of the Indian Ocean Gyre as it flows west along the equator towards the east coast of Africa. At the coast of Africa, the South Equatorial Current is split by Madagascar into the Mozambique Current, flowing south through the Mozambique Channel, and the East Madagascar Current, flowing south along the east coast of Madagascar, both of which are western boundary currents. South of Madagascar the two currents join to form the Agulhas Current.[14] The Agulhas Current flows south until it joins the Antarctic Circumpolar Current, which flows east at the southern edge of the Indian Ocean Gyre. Due to the African continent not extending as far south as the Indian Ocean Gyre, some of the water in the Agulhas Current "leaks" into the Atlantic Ocean, with potentially important effects for global thermohaline circulation.[15] The gyre circulation is completed by the north flowing West Australian Current, which forms the eastern boundary of the gyre.
North Pacific Gyre
The North Pacific Gyre, one of the largest ecosystems on Earth,[16] is bordered to the south by the Intertropical Convergence Zone and extending north to roughly 50°N. At the southern boundary of the North Pacific Gyre, the North Equatorial Current flows west along the equator towards southeast Asia. The Kuroshio Current is the western boundary current of the North Pacific Gyre, flowing northeast along the coast of Japan. At roughly 50°N, the flow turns east and becomes the North Pacific Current. The North Pacific Current flows east, eventually bifurcating near the west coast of North America into the northward flowing Alaska Current and the southward flowing California Current.[17] The Alaska Current is the eastern boundary current of the subpolar Alaska Gyre,[18] while the California Current is the eastern boundary current that completes the North Pacific Gyre circulation. Within the North Pacific Gyre is the Great Pacific Garbage Patch, an area of increased plastic waste concentration.[19]
South Pacific Gyre
The South Pacific Gyre, like its northern counterpart, is one of the largest ecosystems on Earth with an area that accounts for around 10% of the global ocean surface area.[20] Within this massive area is Point Nemo, the location on Earth that is farthest away from all continental landmass (2,688 km away from the closest land).[21] The remoteness of this gyre complicates sampling, causing this gyre to be historically under sampled in oceanographic datasets.[22][23] At the northern boundary of the South Pacific Gyre, the South Equatorial Current flows west towards southeast Asia and Australia. There, it turns south as it flows in the East Australian Current, a western boundary current. The Antarctic Circumpolar Current again returns the water to the east. The flow turns north along the western coast of South America in the Humboldt Current, the eastern boundary current that completes the South Pacific Gyre circulation. Like the North Pacific Gyre, the South Pacific Gyre has an elevated concentration of plastic waste near the center, termed the South Pacific garbage patch. Unlike the North Pacific garbage patch which was first described in 1988,[19] the South Pacific garbage patch was discovered much more recently in 2016[24] (a testament to the extreme remoteness of the South Pacific Gyre).
Subpolar gyres
Subpolar gyres form at high latitudes (around 60°). Circulation of surface wind and ocean water is cyclonic, counterclockwise in the northern hemisphere and clockwise in the southern hemisphere, around a low-pressure area, such as the persistent Aleutian Low and the Icelandic Low. The wind stress curl in this region drives the Ekman suction, which creates an upwelling of nutrient-rich water from the lower depths.[25]
Subpolar circulation in the southern hemisphere is dominated by the Antarctic Circumpolar Current, due to the lack of large landmasses breaking up the Southern Ocean. There are minor gyres in the Weddell Sea and the Ross Sea, the Weddell Gyre and Ross Gyre, which circulate in a clockwise direction.
North Atlantic Subpolar Gyre
The North Atlantic Subpolar Gyre, located in the North Atlantic Ocean, is characterized by a counterclockwise rotation of surface waters. It plays a crucial role in the global oceanic conveyor belt system, influencing climate and marine ecosystems.[26] The gyre is driven by the convergence of warm, salty waters from the south and cold, fresher waters from the north. As these waters meet, the warm, dense water sinks beneath the lighter, colder water, initiating a complex circulation pattern. The North Atlantic Subpolar Gyre has significant implications for climate regulation, as it helps redistribute heat and nutrients throughout the North Atlantic, influencing weather patterns and supporting diverse marine life. Additionally, changes in the gyre's strength and circulation can impact regional climate variability and may be influenced by broader climate change trends.[26]
The Atlantic Meridional Overturning Circulation (AMOC) is a key component of the global climate system through its transport of heat and freshwater.[26] The North Atlantic Subpolar Gyre is in a region where the AMOC is actively developed and shaped through mixing and water mass transformation. It is a region where large amounts of heat transported northward by the ocean are released into the atmosphere, thereby modifying the climate of northwest Europe.[27] The North Atlantic Subpolar Gyre has a complex topography with a series of basins in which the large-scale circulation is characterized by cyclonic boundary currents and interior recirculation. The North Atlantic Current develops out of the Gulf Stream extension and turns eastward, crossing the Atlantic in a wide band between about 45°N and 55°N creating the southern border of the North Atlantic Subpolar Gyre. There are several branches of the North Atlantic Current, and they flow into an eastern intergyral region in the Bay of Biscay, the Rockall Trough, the Iceland Basin, and the Irminger Sea. Part of the North Atlantic Current flows into the Norwegian Sea, and some recirculate within the boundary currents of the subpolar gyre.[26]
Ross Gyre
The Ross Gyre is located in the Southern Ocean surrounding Antarctica, just outside of the Ross Sea. This gyre is characterized by a clockwise rotation of surface waters, driven by the combined influence of wind, the Earth's rotation, and the shape of the seafloor. The gyre plays a crucial role in the transport of heat, nutrients, and marine life in the Southern Ocean, affecting the distribution of sea ice and influencing regional climate patterns.
The Ross Sea, Antarctica, is a region where the mixing of distinct water masses and complex interactions with the cryosphere lead to the production and export of dense water, with global-scale impacts.[28] which controls the proximity of the warm waters of the Antarctic Circumpolar Current to the Ross Sea continental shelf, where they may drive ice shelf melting and increase sea level.[29] The deepening of sea level pressures over the Southeast Pacific/Amundsen-Bellingshausen Seas generates a cyclonic circulation cell that reduces sea surface heights north of the Ross Gyre via Ekman suction. The relative reduction of sea surface heights to the north facilitates a northeastward expansion of the outer boundary of the Ross Gyre. Further, the gyre is intensified by a westward ocean stress anomaly over its southern boundary. The ensuing southward Ekman transport anomaly raises sea surface heights over the continental shelf and accelerates the westward throughflow by increasing the cross-slope pressure gradient. The sea level pressure center may have a greater impact on the Ross Gyre transport or the throughflow, depending on its location and strength. This gyre has significant effects on interactions in the Southern Ocean between waters of the Antarctic margin, the Antarctic Circumpolar Current, and intervening gyres with a strong seasonal sea ice cover play a major role in the climate system.[30]
The Ross Sea is the southernmost sea on Earth and holds the United States' McMurdo Station and Italian Zuchelli Station. Even though this gyre is located nearby two of the most prominent research stations in the world for Antarctic study, the Ross Gyre remains one of the least sampled gyres in the world.
Weddell Gyre
The Weddell Gyre is located in the Southern Ocean surrounding Antarctica, just outside of the Weddell Sea. It is characterized by a clockwise rotation of surface waters, influenced by the combined effects of winds, the Earth's rotation, and the seafloor's topography.[32] Like the Ross Gyre, the Weddell Gyre plays a critical role in the movement of heat, nutrients, and marine life in the Southern Ocean. Insights into the behavior and variability of the Weddell Gyre are crucial for comprehending the interaction between ocean processes in the southern hemisphere and their implications for the global climate system.[32]
This gyre is formed by interactions between the Antarctic Circumpolar Current and the Antarctic Continental Shelf.[33] The Weddell Gyre (WG) is one of the main oceanographic features of the Southern Ocean south of the Antarctic Circumpolar Current which plays an influential role in global ocean circulation as well as gas exchange with the atmosphere.[33] The WG is situated in the Atlantic sector of the Southern Ocean, south of 55–60°S and roughly between 60°W and 30°E (Deacon, 1979). It stretches over the Weddell abyssal plain, where the Weddell Sea is situated, and extends east into the Enderby abyssal plain.
Beaufort Sea Gyre
The anti-cyclonic Beaufort Gyre is the dominant circulation of the Canada Basin and the largest freshwater reservoir in the Arctic Ocean's western and northern sectors.[34] The Gyre is characterized by a large-scale, quasi-permanent, counterclockwise rotation of surface waters within the Beaufort Sea. This gyre functions as a critical mechanism for the transport of heat, nutrients, and sea ice within the Arctic region, thus influencing the physical and biological characteristics of the marine environment. Negative wind stress curl over the region, mediated by the sea ice pack, leads to Ekman pumping, downwelling of isopycnal surfaces, and storage of ~20,000 km3 of freshwater in the upper few hundred meters of the ocean.[35] The gyre gains energy from winds in the south and loses energy in the north over a mean annual cycle. The strong atmospheric circulation in the autumn, combined with significant areas of open water, demonstrates the effect that wind stress has directly on the surface geostrophic currents.[36] The Beaufort Gyre and the Transpolar Drift are interconnected due to their relationship in their role in transporting sea ice across the Arctic Ocean. Their influence on the distribution of freshwater has broad impacts for global sea level rise and climate dynamics.
Pollution
A garbage patch is a gyre of marine debris particles caused by the effects of ocean currents and increasing plastic pollution by human populations. These human-caused collections of plastic and other debris are responsible for ecosystem and environmental problems that affect marine life, contaminate oceans with toxic chemicals, and contribute to greenhouse gas emissions. Once waterborne, marine debris becomes mobile. Flotsam can be blown by the wind, or follow the flow of ocean currents, often ending up in the middle of oceanic gyres where currents are weakest.
Within garbage patches, the waste is not compact, and although most of it is near the surface of the ocean, it can be found up to more than 30 metres (100 ft) deep in the water.[75] Patches contain plastics and debris in a range of sizes from microplastics and small scale plastic pellet pollution, to large objects such as fishing nets and consumer goods and appliances lost from flood and shipping loss.
Garbage patches grow because of widespread loss of plastic from human trash collection systems. The United Nations Environmental Program estimated that "for every square mile of ocean" there are about "46,000 pieces of plastic".[76] The 10 largest emitters of oceanic plastic pollution worldwide are, from the most to the least, China, Indonesia, Philippines, Vietnam, Sri Lanka, Thailand, Egypt, Malaysia, Nigeria, and Bangladesh,[77] largely through the rivers Yangtze, Indus, Yellow, Hai, Nile, Ganges, Pearl, Amur, Niger, and the Mekong, and accounting for "90 percent of all the plastic that reaches the world's oceans".[78][79] Asia was the leading source of mismanaged plastic waste, with China alone accounting for 2.4 million metric tons.[80]
The best known of these is the Great Pacific Garbage Patch which has the highest density of marine debris and plastic. The Pacific Garbage patch has two mass buildups: the western garbage patch and the eastern garbage patch, the former off the coast of Japan and the latter between California and Hawaii. These garbage patches contain 90 million tonnes (100 million short tons) of debris.[75] Other identified patches include the North Atlantic garbage patch between North America and Africa, the South Atlantic garbage patch located between eastern South America and the tip of Africa, the South Pacific garbage patch located west of South America, and the Indian Ocean garbage patch found east of South Africa listed in order of decreasing size.___________________________
Ocean current
https://en.wikipedia.org/wiki/Ocean_current
___________________________
Upwelling
https://en.wikipedia.org/wiki/Upwelling
Upwelling is an oceanographic phenomenon that involves wind-driven motion of dense, cooler, and usually nutrient-rich water from deep water towards the ocean surface. It replaces the warmer and usually nutrient-depleted surface water. The nutrient-rich upwelled water stimulates the growth and reproduction of primary producers such as phytoplankton. The biomass of phytoplankton and the presence of cool water in those regions allow upwelling zones to be identified by cool sea surface temperatures (SST) and high concentrations of chlorophyll a.[2][3]
The increased availability of nutrients in upwelling regions results in high levels of primary production and thus fishery production. Approximately 25% of the total global marine fish catches come from five upwellings, which occupy only 5% of the total ocean area.[4] Upwellings that are driven by coastal currents or diverging open ocean have the greatest impact on nutrient-enriched waters and global fishery yields.
Southern Ocean
Large-scale upwelling is also found in the Southern Ocean. Here, strong westerly (eastward) winds blow around Antarctica, driving a significant flow of water northwards. This is actually a type of coastal upwelling. Since there are no continents in a band of open latitudes between South America and the tip of the Antarctic Peninsula, some of this water is drawn up from great depths. In many numerical models and observational syntheses, the Southern Ocean upwelling represents the primary means by which deep dense water is brought to the surface. In some regions of Antarctica, wind-driven upwelling near the coast pulls relatively warm Circumpolar deep water onto the continental shelf, where it can enhance ice shelf melt and influence ice sheet stability.[14] Shallower, wind-driven upwelling is also found in off the west coasts of North and South America, northwest and southwest Africa, and southwest and south Australia, all associated with oceanic subtropical high pressure circulations (see coastal upwelling above).
Some models of the ocean circulation suggest that broad-scale upwelling occurs in the tropics, as pressure driven flows converge water toward the low latitudes where it is diffusively warmed from above. The required diffusion coefficients, however, appear to be larger than are observed in the real ocean. Nonetheless, some diffusive upwelling does probably occur.
Threats to upwelling ecosystems
A major threat to both this crucial intermediate trophic level and the entire upwelling trophic ecosystem is the problem of commercial fishing. Since upwelling regions are the most productive and species rich areas in the world, they attract a high number of commercial fishers and fisheries. On one hand, this is another benefit of the upwelling process as it serves as a viable source of food and income for so many people and nations besides marine animals. However, just as in any ecosystem, the consequences of over-fishing from a population could be detrimental to that population and the ecosystem as a whole. In upwelling ecosystems, every species present plays a vital role in the functioning of that ecosystem. If one species is significantly depleted, that will have an effect throughout the rest of the trophic levels. For example, if a popular prey species is targeted by fisheries, fishermen may collect hundreds of thousands of individuals of this species just by casting their nets into the upwelling waters. As these fish are depleted, the food source for those who preyed on these fish is depleted. Therefore, the predators of the targeted fish will begin to die off, and there will not be as many of them to feed the predators above them. This system continues throughout the entire food chain, resulting in a possible collapse of the ecosystem. It is possible that the ecosystem may be restored over time, but not all species can recover from events such as these. Even if the species can adapt, there may be a delay in the reconstruction of this upwelling community.[13]
The possibility of such an ecosystem collapse is the very danger of fisheries in upwelling regions. Fisheries may target a variety of different species, and therefore they are a direct threat to many species in the ecosystem, however they pose the highest threat to the intermediate pelagic fish. Since these fish form the crux of the entire trophic process of upwelling ecosystems, they are highly represented throughout the ecosystem (even if there is only one species present). Unfortunately, these fish tend to be the most popular targets of fisheries as about 64 percent of their entire catch consists of pelagic fish. Among those, the six main species that usually form the intermediate trophic layer represent over half of the catch.
Besides directly causing the collapse of the ecosystem due to their absence, this can create problems in the ecosystem through a variety of other methods as well. The animals higher in the trophic levels may not completely starve to death and die off, but the decreased food supply could still hurt the populations. If animals do not get enough food, it will decrease their reproductive viability meaning that they will not breed as often or as successfully as usual. This can lead to a decreasing population, especially in species that do not breed often under normal circumstances or become reproductively mature late in life. Another problem is that the decrease in the population of a species due to fisheries can lead to a decrease in genetic diversity, resulting in a decrease in biodiversity of a species. If the species diversity is decreased significantly, this could cause problems for the species in an environment that is so variable and quick-changing; they may not be able to adapt, which could result in a collapse of the population or ecosystem.[13]
Another threat to the productivity and ecosystems of upwelling regions is El Niño-Southern Oscillation (ENSO) system, or more specifically El Niño events. During the normal period and La Niña events, the easterly trade winds are still strong, which continues to drive the process of upwelling. However, during El Niño events, trade winds are weaker, causing decreased upwelling in the equatorial regions as the divergence of water north and south of the equator is not as strong or as prevalent. The coastal upwelling zones diminish as well since they are wind driven systems, and the wind is no longer a very strong driving force in these areas. As a result, global upwelling drastically decreases, causing a decrease in productivity as the waters are no longer receiving nutrient-rich water. Without these nutrients, the rest of the trophic pyramid cannot be sustained, and the rich upwelling ecosystem will collapse.
Effect on climate
___________________________
Downwelling
https://en.wikipedia.org/wiki/Downwelling
Downwelling is the downward movement of a fluid parcel and its properties (e.g., salinity, temperature, pH) within a larger fluid. It is closely related to upwelling, the upward movement of fluid.
While downwelling is most commonly used to describe an oceanic process, it's also used to describe a variety of Earth phenomena. This includes mantle dynamics, air movement, and movement in freshwater systems (e.g., large lakes). This article will focus on oceanic downwelling and its important implications for ocean circulation and biogeochemical cycles. Two primary mechanisms transport water downward: buoyancy forcing and wind-driven Ekman transport (i.e., Ekman pumping).[1][2]
Downwelling has important implications for marine life. Surface water generally has a lower nutrient content compared to deep water due to primary production using nutrients in the photic zone. Surface water is, however, high in oxygen compared to the deep ocean due to photosynthesis and air-sea gas exchange. When water is moved downwards, oxygen is pumped below the surface, where it is used by decaying organisms.[3] Downwelling events are accompanied by low primary production in the surface ocean due to a lack of nutrient supply from below.
Mechanisms
Buoyancy
Buoyancy-forced downwelling, often termed convection, is the deepening of a water parcel due to a change in the density of that parcel. Density changes in the surface ocean are primarily the result of evaporation, precipitation, heating, cooling, or the introduction and mixing of an alternate water or salinity source, such as river input or brine rejection. Notably, convection is the driving force behind global thermohaline circulation. For a water parcel to move downward, the density of that parcel must increase; therefore, evaporation, cooling, and brine rejection are the processes that control buoyancy-forced downwelling.[1]
Wind-driven Ekman transport
Buoyancy-forced downwelling
Buoyancy is lost through cooling, evaporation, and brine rejection through sea ice formation. Buoyancy loss occurs on many spatial and temporal scales.
In the open ocean, there are regions where cooling and mixed layer deepening occurs at night, and the ocean re-stratifies during the day. On annual cycles, widespread cooling begins in the fall, and convective mixed layer deepening can reach hundreds of meters into the ocean interior. In comparison, the wind-driven mixed layer depth is limited to 150 m.
Large evaporation events can cause convection; however, latent heat loss associated with evaporation is usually dominant and in the winter, this process drives Mediterranean Sea deep water formation. In select locations - Greenland Sea, Labrador Sea, Weddell Sea, and Ross Sea - deep convection (>1000 m) ventilates (oxygenates) most of the deep water of the global ocean and drives the thermohaline circulation.
Langmuir circulation
Meso- (>10-100's km) and submesoscale (<1-10 km) eddies are ubiquitous features of the upper ocean. Eddies have either a cyclonic (cold-core) or anticyclonic (warm-core) rotation. Warm-core eddies are characterized by anticyclonic rotation that directs surface waters inward, creating high sea surface temperature and height.[7] The high central hydrostatic pressure maintained by this rotation causes the downwelling of water and the depression of isopycnals - surfaces of constant density (see Eddy pumping) at scales of hundreds of meters per year.[8] The typical result is a deeper surface layer of warm water often characterized by low primary production.[9][10]
Warm-core eddies play multiple important roles in biogeochemical cycling and air-sea interactions. For example, these eddies are seen to decrease ice formation in the Southern Ocean due to their high sea surface temperatures.[11] It has also been observed that air-sea fluxes of carbon dioxide decrease at the center of these eddies and that temperature was the leading cause of this inhibited flux.[12] Warm-core eddies transport oxygen into the ocean interior (below the photic zone) which supports respiration.[13] Although compounds such as oxygen are transported into the deep ocean, there is an observed decrease in carbon export in warm-core eddies due to intensified stratification at their center.[14] Such stratification inhibits the mixing of nutrient-rich waters to the surface where they could fuel primary production. In this case, since primary production stays low, carbon export potential remains low.
Variability
Downwelling trends differ between latitudes and can be associated with variations in wind strength and changing seasons. In some areas, coastal downwelling is a seasonal event pushing nutrient-depleted waters towards the shore. The relaxation or reversal of upwelling-favorable winds creates periods of downwelling as waters pile up along the coast.[20]
Temperature differences and wind patterns are seasonal in temperate latitudes, creating highly variable upwelling and downwelling conditions.[20] For example, in fall and winter along the Pacific Northwest coast in the United States, southerly winds in the Gulf of Alaska and California Current system create downwelling-favorable conditions, transporting offshore water from the south and west towards the coast. These downwelling events tend to last for days and can be associated with winter storms and contribute to low levels of primary production observed during fall and winter.[21] In contrast, during the "spring transition" at the end of the downwelling season and the beginning of the upwelling season is marked by the presence of cold, nutrient-rich, upwelled water at the coast, which stimulates high levels of primary production.[22] In contrast to seasonally variable temperate regions, downwelling is relatively steady at the poles as cold air decreases the temperature of salty water transported by gyres from the tropics.[23]
During the neutral and La Niña phases of the El Niño Southern Oscillation (ENSO), steady easterly trade winds in equatorial regions can cause water to pile up in the western Pacific. A weakening of these trade winds can create downwelling Kelvin waves, which propagate along the equator in the eastern Pacific.[24] Series of Kelvin waves associated with anomalously warm sea surface temperatures in the eastern Pacific can be a predecessor to an El Niño event.[25] During the El Niño phase of ENSO, the disruption of trade winds causes ocean water to pile up off the western coast of South America. This shift is associated with a decrease in upwelling and may enhance coastal downwelling.
Effects on ocean biogeochemistry
Biogeochemical cycling related to downwelling is constrained by the location and frequency at which this process occurs. The majority of downwelling, as described above, occurs in polar regions as deep and bottom water formation or in the center of subtropical gyres. Bottom and deep water formation in the Southern Ocean (Weddell Sea) and North Atlantic Ocean (Greenland, Labrador, Norwegian, and Mediterranean Seas) is a major contributor towards the removal and sequestration of anthropogenic carbon dioxide, dissolved organic carbon (DOC), and dissolved oxygen.[27][28][29] Dissolved gas solubility is greater in cold water allowing for increased gas concentrations.[29]
The Southern Ocean alone has been shown to be the most important high-latitude region controlling pre-industrial atmospheric carbon dioxide by general circulation model simulations. Circulation of water into the Antarctic deep-water formation region is one of the main factors drawing carbon dioxide into the surface oceans. The other is the biological pump, which is typically limited by iron in the Southern Ocean in areas with high nutrients and low chlorophyll (HNLC). DOC can become entrained during bottom and deep water formation which is a large portion of biogenic carbon export. It is thought that the export of DOC is up to 30% of the biogenic carbon that makes it into the deep ocean. The intensity of the DOC flux to depth relies on the strength of winter convection, which also affects the microbial food web, causing variations in the DOC exported to depth. Dissolved oxygen is also downwelled at bottom and deep water formation sites, contributing to elevated dissolved oxygen concentrations below 1000 meters.
Subtropical gyres are typically limited in macro and micro nutrients such as nitrogen, phosphorus, and iron; resulting in picophytoplankton communities that have low nutrient requirements. This is in part due to consistent downwelling, which transports nutrients away from the photic zone. These oligotrophic areas are thought to be sustained by rapid nutrient cycling which could leave little carbon remaining that could be sequestered. The dynamics of picophytoplankton's role in carbon cycling in subtropical gyres is poorly understood and is being actively researched.
Areas with the highest primary productivity play significant roles in biogeochemical cycling of carbon and nitrogen. Downwelling can either alleviate or induce anoxic conditions, depending on the initial conditions and location. Sustained periods of upwelling can cause deoxygenation which is relieved by a downwelling event transporting dissolved oxygen back down to depths. Anoxic conditions can also result from persistent downwelling after an algal bloom of high-biomass dinoflagellates. The accumulation of dinoflagellates and other forms of biomass nearshore due to downwelling will eventually cause nutrient depletion and mortality of organisms. As the biomass decays, oxygen becomes depleted by heterotrophic bacteria, inducing anoxic conditions.
___________________________
Thermohaline circulation
https://en.wikipedia.org/wiki/Thermohaline_circulation
Thermohaline circulation (THC) is a part of the large-scale ocean circulation driven by global density gradients formed by surface heat and freshwater fluxes.[1][2] The name thermohaline is derived from thermo-, referring to temperature, and haline, referring to salt content—factors which together determine the density of sea water.
Wind-driven surface currents (such as the Gulf Stream) travel polewards from the equatorial Atlantic Ocean, cooling and sinking en-route to higher latitudes - eventually becoming part of the North Atlantic Deep Water - before flowing into the ocean basins.[3] While the bulk of thermohaline water upwells in the Southern Ocean, the oldest waters (with a transit time of approximately 1000 years) upwell in the North Pacific;[4] extensive mixing takes place between the ocean basins, reducing the difference in their densities, forming the Earth's oceans a global system.[3] The water in these circuits transport energy - as heat - and mass - as dissolved solids and gases - around the globe. Consequently, the state of the circulation greatly impacts the climate of Earth.
The thermohaline circulation is often referred to as the ocean conveyor belt, great ocean conveyor, or "global conveyor belt" - a term coined by climate scientist, Wallace Smith Broecker.[5][6] It is also known as the meridional overturning circulation, or MOC; a name used to signify that circulation patterns caused by temperature and salinity gradients are not necessarily part of a single global circulation. This is due, in part, to the difficulty in separating parts of the circulation driven by temperature and salinity from those affected by factors such as wind and tidal force.[7]
This global circulation comprises two major "limbs;" the Atlantic meridional overturning circulation (AMOC) centered in the north Atlantic Ocean, and the Southern Ocean overturning circulation, or Southern Ocean meridional circulation (SMOC) located near Antarctica. Since 90% of the human population occupies the Northern Hemisphere,[8] more extensive research has been undertaken on the AMOC, however the SMOC is of equal importance to the global climate. Evidence suggests both circulations are slowing due to climate change in line with increasing rates of dilution from melting ice sheets - critically affecting the salinity of Antarctic bottom water.[9][10] In addition, the potential for outright collapse of either circulation to a much weaker state exemplifies tipping points in the climate system. If either hemisphere experiences collapse of its circulation, the likelihood of proplonged dry spells and droughts would increase as precipitation decreases, while the other hemisphere will become wetter. Marine ecosystems are then more likely to receive fewer nutrients and experience greater ocean deoxygenation. In the Northern Hemisphere, the collapse of AMOC would lead to substantially lower temperatures in many European countries, while the east coast of North America is predicted to see accelerated sea level rise. The collapse of these circulations is generally accepted to be more than a century away, and may only occur in the event of rapid and high sea-temperature increases. However, these projections are marked by significant uncertainty.
Effects on global climate
The thermohaline circulation plays an important role in supplying heat to the polar regions, and thus in regulating the amount of sea ice in these regions, although poleward heat transport outside the tropics is considerably larger in the atmosphere than in the ocean.[30] Changes in the thermohaline circulation are thought to have significant impacts on the Earth's radiation budget.
Large influxes of low-density meltwater from Lake Agassiz and deglaciation in North America are thought to have led to a shifting of deep water formation and subsidence in the extreme North Atlantic and caused the climate period in Europe known as the Younger Dryas.
Slowdown or collapse of AMOC
In 2021, the IPCC Sixth Assessment Report again said the AMOC is "very likely" to decline within the 21st century and that there was a "high confidence" changes to it would be reversible within centuries if warming was reversed.[32]: 19 Unlike the Fifth Assessment Report, it had only "medium confidence" rather than "high confidence" in the AMOC avoiding a collapse before the end of the 21st century. This reduction in confidence was likely influenced by several review studies that draw attention to the circulation stability bias within general circulation models,[33][34] and simplified ocean-modelling studies suggesting the AMOC may be more vulnerable to abrupt change than larger-scale models suggest.[35]
The synthesis report of the IPCC Sixth Assessment Report summarized the scientific consensus as follows: "The Atlantic Meridional Overturning Circulation is very likely to weaken over the 21st century for all considered scenarios (high confidence), however an abrupt collapse is not expected before 2100 (medium confidence). If such a low probability event were to occur, it would very likely cause abrupt shifts in regional weather patterns and water cycle, such as a southward shift in the tropical rain belt, and large impacts on ecosystems and human activities."[36]
As of 2024, there is no consensus on whether a consistent slowing of the AMOC circulation has occurred but there is little doubt it will occur in the event of continued climate change.[37] According to the IPCC, the most-likely effects of future AMOC decline are reduced precipitation in mid-latitudes, changing patterns of strong precipitation in the tropics and Europe, and strengthening storms that follow the North Atlantic track.[37] In 2020, research found a weakened AMOC would slow the decline in Arctic sea ice.[38] and result in atmospheric trends similar to those that likely occurred during the Younger Dryas,[39] such as a southward displacement of Intertropical Convergence Zone. Changes in precipitation under high-emissions scenarios would be far larger.[38]
A decline in the AMOC would be accompanied by an acceleration of sea level rise along the U.S. East Coast;[37] at least one such event has been connected to a temporary slowing of the AMOC.[40] This effect would be caused by increased warming and thermal expansion of coastal waters, which would transfer less of their heat toward Europe; it is one of the reasons sea level rise along the U.S. East Coast is estimated to be three-to-four times higher than the global average.[41][42][43]
Slowdown or collapse of SMOC
Additionally, the main controlling pattern of the extratropical Southern Hemisphere's climate is the Southern Annular Mode (SAM), which has been spending more and more years in its positive phase due to climate change (as well as the aftermath of ozone depletion), which means more warming and more precipitation over the ocean due to stronger westerlies, freshening the Southern Ocean further.[44][45]: 1240 Climate models currently disagree on whether the Southern Ocean circulation would continue to respond to changes in SAM the way it does now, or if it will eventually adjust to them. As of early 2020s, their best, limited-confidence estimate is that the lower cell would continue to weaken, while the upper cell may strengthen by around 20% over the 21st century.[45] A key reason for the uncertainty is the poor and inconsistent representation of ocean stratification in even the CMIP6 models – the most advanced generation available as of early 2020s.[46] Furthermore, the largest long-term role in the state of the circulation is played by Antarctic meltwater,[47] and Antarctic ice loss had been the least-certain aspect of future sea level rise projections for a long time.[48]
Similar processes are taking place with Atlantic meridional overturning circulation (AMOC), which is also affected by the ocean warming and by meltwater flows from the declining Greenland ice sheet.[49] It is possible that both circulations may not simply continue to weaken in response to increased warming and freshening, but eventually collapse to a much weaker state outright, in a way which would be difficult to reverse and constitute an example of tipping points in the climate system.[50] There is paleoclimate evidence for the overturning circulation being substantially weaker than now during past periods that were both warmer and colder than now.[51] However, Southern Hemisphere is only inhabited by 10% of the world's population, and the Southern Ocean overturning circulation has historically received much less attention than the AMOC. Consequently, while multiple studies have set out to estimate the exact level of global warming which could result in AMOC collapsing, the timeframe over which such collapse may occur, and the regional impacts it would cause, much less equivalent research exists for the Southern Ocean overturning circulation as of the early 2020s. There has been a suggestion that its collapse may occur between 1.7 °C (3.1 °F) and 3 °C (5.4 °F), but this estimate is much less certain than for many other tipping points.
___________________________
Atlantic multidecadal oscillation
https://en.wikipedia.org/wiki/Atlantic_multidecadal_oscillation
The Atlantic Multidecadal Oscillation (AMO), also known as Atlantic Multidecadal Variability (AMV),[1] is the theorized variability of the sea surface temperature (SST) of the North Atlantic Ocean on the timescale of several decades.[2]
While there is some support for this mode in models and in historical observations, controversy exists with regard to its amplitude, and whether it has a typical timescale and can be classified as an oscillation. There is also discussion on the attribution of sea surface temperature change to natural or anthropogenic causes, especially in tropical Atlantic areas important for hurricane development.[3] The Atlantic multidecadal oscillation is also connected with shifts in hurricane activity, rainfall patterns and intensity, and changes in fish populations.[4]
Definition and history
Evidence for a multidecadal climate oscillation centered in the North Atlantic began to emerge in 1980s work by Folland and colleagues, seen in Fig. 2.d.A.[5] That oscillation was the sole focus of Schlesinger and Ramankutty in 1994,[6] but the actual term Atlantic Multidecadal Oscillation (AMO) was coined by Michael Mann in a 2000 telephone interview with Richard Kerr,[7] as recounted by Mann, p. 30 in The Hockey Stick and the Climate Wars: Dispatches from the Front Lines (2012).
The AMO signal is usually defined from the patterns of SST variability in the North Atlantic once any linear trend has been removed. This detrending is intended to remove the influence of greenhouse gas-induced global warming from the analysis. However, if the global warming signal is significantly non-linear in time (i.e. not just a smooth linear increase), variations in the forced signal will leak into the AMO definition. Consequently, correlations with the AMO index may mask effects of global warming, as per Mann, Steinman and Miller,[8] which also provides a more detailed history of the science development.
AMO index
Several methods have been proposed to remove the global trend and El Niño-Southern Oscillation (ENSO) influence over the North Atlantic SST. Trenberth and Shea, assuming that the effect of global forcing over the North Atlantic is similar to the global ocean, subtracted the global (60°N-60°S) mean SST from the North Atlantic SST to derive a revised AMO index.[9]
Ting et al. however argue that the forced SST pattern is not globally uniform; they separated the forced and internally generated variability using signal to noise maximizing EOF analysis.[3]
Van Oldenborgh et al. derived an AMO index as the SST averaged over the extra-tropical North Atlantic (to remove the influence of ENSO that is greater at tropical latitude) minus the regression on global mean temperature.[10]
Guan and Nigam removed the non stationary global trend and Pacific natural variability before applying an EOF analysis to the residual North Atlantic SST.[11]
The linearly detrended index suggests that the North Atlantic SST anomaly at the end of the twentieth century is equally divided between the externally forced component and internally generated variability, and that the current peak is similar to middle twentieth century; by contrast the others methodology suggest that a large portion of the North Atlantic anomaly at the end of the twentieth century is externally forced.[3]
Frajka-Williams et al. 2017 pointed out that recent changes in cooling of the subpolar gyre, warm temperatures in the subtropics and cool anomalies over the tropics, increased the spatial distribution of meridional gradient in sea surface temperatures, which is not captured by the AMO Index.[4]
Mechanisms
Based on the about 150-year instrumental record a quasi-periodicity of about 70 years, with a few distinct warmer phases between ca. 1930–1965 and after 1995, and cool between 1900–1930 and 1965–1995 has been identified.[12] In models, AMO-like variability is associated with small changes in the North Atlantic branch of the Thermohaline Circulation.[13] However, historical oceanic observations are not sufficient to associate the derived AMO index to present-day circulation anomalies.[citation needed] Models and observations indicate that changes in atmospheric circulation, which induce changes in clouds, atmospheric dust and surface heat flux, are largely responsible for the tropical portion of the AMO.[14][15]
The Atlantic Multidecadal Oscillation (AMO) is important for how external forcings are linked with North Atlantic SSTs.[16]
Climate impacts worldwide
The AMO is correlated to air temperatures and rainfall over much of the Northern Hemisphere, in particular in the summer climate in North America and Europe.[17][18] Through changes in atmospheric circulation, the AMO can also modulate spring snowfall over the Alps[19] and glaciers' mass variability.[20] Rainfall patterns are affected in North Eastern Brazilian and African Sahel. It is also associated with changes in the frequency of North American droughts and is reflected in the frequency of severe Atlantic hurricane activity.[9]
Recent research suggests that the AMO is related to the past occurrence of major droughts in the US Midwest and the Southwest. When the AMO is in its warm phase, these droughts tend to be more frequent or prolonged. Two of the most severe droughts of the 20th century occurred during the positive AMO between 1925 and 1965: The Dust Bowl of the 1930s and the 1950s drought. Florida and the Pacific Northwest tend to be the opposite—warm AMO, more rainfall.[21]
Climate models suggest that a warm phase of the AMO strengthens the summer rainfall over India and Sahel and the North Atlantic tropical cyclone activity.[22] Paleoclimatologic studies have confirmed this pattern—increased rainfall in AMO warmphase, decreased in cold phase—for the Sahel over the past 3,000 years.
Relation to Atlantic hurricanes
A 2008 study correlated the Atlantic Multidecadal Mode (AMM), with HURDAT data (1851–2007), and noted a positive linear trend for minor hurricanes (category 1 and 2), but removed when the authors adjusted their model for undercounted storms, and stated "If there is an increase in hurricane activity connected to a greenhouse gas induced global warming, it is currently obscured by the 60 year quasi-periodic cycle."[24] With full consideration of meteorological science, the number of tropical storms that can mature into severe hurricanes is much greater during warm phases of the AMO than during cool phases, at least twice as many; the AMO is reflected in the frequency of severe Atlantic hurricanes.[21] Based on the typical duration of negative and positive phases of the AMO, the current warm regime is expected to persist at least until 2015 and possibly as late as 2035. Enfield et al. assume a peak around 2020.[25]
However, Mann and Emanuel had found in 2006 that "anthropogenic factors are responsible for long-term trends in tropic Atlantic warmth and tropical cyclone activity" and "There is no apparent role of the AMO."[26]
In 2014 Mann, Steinman and Miller[8] showed that warming (and therefore any effects on hurricanes) were not caused by the AMO, writing: "certain procedures used in past studies to estimate internal variability, and in particular, an internal multidecadal oscillation termed the "Atlantic Multidecadal Oscillation" or "AMO", fail to isolate the true internal variability when it is a priori known. Such procedures yield an AMO signal with an inflated amplitude and biased phase, attributing some of the recent NH mean temperature rise to the AMO. The true AMO signal, instead, appears likely to have been in a cooling phase in recent decades, offsetting some of the anthropogenic warming."
Periodicity and prediction of AMO shifts
There are only about 130–150 years of data based on instrument data, which are too few samples for conventional statistical approaches. With the aid of multi-century proxy reconstruction, a longer period of 424 years was used by Enfield and Cid–Serrano as an illustration of an approach as described in their paper called "The Probabilistic Projection of Climate Risk".[27] Their histogram of zero crossing intervals from a set of five re-sampled and smoothed version of Gray et al. (2004) index together with the maximum likelihood estimate gamma distribution fit to the histogram, showed that the largest frequency of regime interval was around 10–20 year. The cumulative probability for all intervals 20 years or less was about 70%.[citation needed]
There is no demonstrated predictability for when the AMO will switch, in any deterministic sense. Computer models, such as those that predict El Niño, are far from being able to do this. Enfield and colleagues have calculated the probability that a change in the AMO will occur within a given future time frame, assuming that historical variability persists. Probabilistic projections of this kind may prove to be useful for long-term planning in climate sensitive applications, such as water management.
A 2017 study predicts a continued cooling shift beginning 2014, and the authors note, "..unlike the last cold period in the Atlantic, the spatial pattern of sea surface temperature anomalies in the Atlantic is not uniformly cool, but instead has anomalously cold temperatures in the subpolar gyre, warm temperatures in the subtropics and cool anomalies over the tropics. The tripole pattern of anomalies has increased the subpolar to subtropical meridional gradient in SSTs, which are not represented by the AMO index value, but which may lead to increased atmospheric baroclinicity and storminess."[4]
Criticism
___________________________
Arctic sea ice circulation and drift speed: Decadal trends and ocean currents
09 April 2013
https://agupubs.onlinelibrary.wiley.com/doi/full/10.1002/jgrc.20191
___________________________
The dirtiest fuel
Heavy fuel oil (HFO) is the residue and the heaviest elements from making refined oil. It is thick and sticky and breaks down very slowly, particularly in polar conditions. Dr. Sian Prior says it is environmentally destructive and should be banned from use in the Arctic.
Dr Sian Prior is an expert in ocean governance and marine policy development. This article originally appeared in The Circle 03.16. See all issues here.
The grounding of the Norwegian tanker Champion Ebony off Nunivak Island in the Bering Sea in June 2016 is a stark reminder that the Arctic, adjacent seas and coastal communities need to be safeguarded from the risks of shipping in remote northern waters. The tanker was carrying over 14 million gallons of petroleum fuel to villages in the region. If ruptured, it could have devastated local resources, placing the community on the front line of an oil spill with virtually no capacity to handle a disaster of that magnitude.
HFO spills in the Arctic threaten the four million people living there, particularly the food security of people in Indigenous communities. The International Tanker Owners Pollution Federation (ITOPF) found that the consequences of heavy fuel oils can be more prolonged because of the persistent nature of the product, with the threat to vulnerable marine life such as seabirds as well as economically sensitive resources on occasion lasting longer in the event of a heavy fuel oil spill. In frozen waters, oil could be trapped in ice allowing it to persist even longer, and travel greater distances.
The Arctic Marine Shipping Assessment (AMSA) also found that the most significant threat from ships to the Arctic marine environment is the release of oil through accidental or illegal discharge. HFO spills are notoriously difficult to clean up and slow to disperse. The Arctic Council’s Protection of the Arctic Marine Environment working group (PAME) says this risk can be greatly reduced “if the onboard oil type is of distillate type rather than HFO”.
The evidence against using and transporting HFO continues to grow. A new report to the European Climate Foundation investigates the ecological, economic and social costs of marine/coastal spills of fuel oils. It concludes that the cost per tonne of oil spilled, the cost per tonne of oily waste recovered from sea surface and shoreline, and the cost per kilometre of coastline clean up strongly indicates that polar and sub-polar HFO spills are more expensive in terms of response and impact, than those occurring in environments which are neither remote nor polar/sub-polar. The report also concludes that polar and sub-polar HFO spills, by virtue of their remoteness, the extreme weather and sea state conditions, and the relative lack of data, are very difficult to respond to and may result in high levels of environmental and socio-economic impacts.
HFO also produces harmful and significantly higher emissions of sulphur and nitrogen oxides and black carbon (BC) than other fuels. Black carbon is transported according to regional meteorological conditions and strongly absorbs visible light. When it falls on light-coloured surfaces, such as Arctic snow and ice, the amount of sunlight reflected back into space is reduced and thus contributes to accelerated snow and ice melt. One study estimated that in 2010 Arctic shipping BC emissions amounted to 1,230 tonnes and would double by 2030 based on business as usual and high growth scenarios. Emissions from HFO use also impact human health: inhaling BC nanoparticles is associated with heart and lung disease and death. Burning HFO also produces other toxins such as polycyclic aromatic hydrocarbons (PAHs) and heavy metals.
The Arctic Monitoring and Assessment Programme’s (AMAP) latest report on BC says “shipping currently accounts for about 5% of black carbon emissions [in the Arctic], but could double by 2030 and quadruple by 2050 under some projections of Arctic vessel traffic.” At the same time, emissions from landbased sources are expected to fall due to stricter controls, increasing the relative importance of addressing emissions from shipping. Switching from HFO fuels to alternatives, such as low-sulphur distillate fuel will not eliminate BC emissions but is expected to reduce BC emission levels by about 30% and possibly up to 80%.
More than a decade ago, the use of HFO in the Antarctic was prohibited due to conditions such as icebergs, sea ice and uncharted waters, and the high potential of environmental impacts associated with a spill. The resolution prohibits the use or carriage as fuel (or cargo) of HFO in the Antarctic area. The new measure took effect in August 2011, however an unforeseen loophole came to light in April 2013, when a Chineseflagged vessel fishing for krill in the Southern Ocean, caught fire and sank off the Antarctic coast. It had been carrying HFO as ballast! An amendment was made and since March 2016, the presence of heavy fuel oil (HFO) on ships operating in the Antarctic or Southern Ocean has been prohibited.
Surely a similar approach should be adopted for the Arctic, where not only is there a risk of spills but the threat of emissions to air, and in particular the deposition of black carbon, is also a major concern.
During the development of the Polar Code, which takes effect January 2017, the Arctic and Antarctic protection measures for discharges of ships’ wastes (oil, sewage, garbage, etc) were aligned. The Code however, failed to include mandatory requirements to address HFO in Arctic waters, although it recommends that Arctic shipping applies the same measures with respect to HFO as Antarctic shipping. Support for a ban on HFO in the Arctic was felt to be premature. The risks and threat to polar ecosystems and wildlife is similar but the nature of shipping in the two polar regions is very different. In Antarctica, shipping is largely comprised of passenger ships, fishing boats and government research vessels, whereas in the Arctic there are also cargo vessels servicing coastal communities in the Arctic and increasingly transiting the Northern Sea Route and Northwest Passage as summer sea ice recedes.
There has been some progress. Earlier this year the PAME Working Group invited proposals for mitigating the risks associated with the use and carriage of HFO by vessels in the Arctic. In March in the U.S.-Canada Joint Statement on Climate, Energy and Arctic Leadership, President Obama and Prime Minister Trudeau committed to “determine with Arctic partners how best to address the risks posed by heavy fuel oil use and black carbon emissions from Arctic shipping”. In May, the U.S.–Nordic Leaders’ Summit issued a Joint Statement which committed to working towards “the highest global standards, best international practice, and a precautionary approach, when considering new and existing commercial activities in the Arctic…” It could certainly be argued that “best international practice” with respect to HFO, is to ban its use and carriage, as has been done in the Antarctic.
The governments of Norway, Sweden and France have also indicated their desire to ban HFO use in the Arctic. The ultimate goal is an HFO-free Arctic. However, until communities can move away from household dependence on this dirtiest of fuels, a tailored approach may be necessary. This could involve strict routing measures and mandatory reporting, to address the carriage of HFO cargoes, however the first milestone towards an HFO-free Arctic must be a ban on the use and carriage of HFO as a shipping fuel by 2020.
http://arctic.blogs.panda.org/default/the-dirtiest-fuel/
___________________________
The Breach in the Earth’s Radiation Shield
11 July 2017
Abstract
The Earth’s atmosphere and magnetic field constitute radiation shields which absorb and deflect high-energy radiation from the solar wind and cosmic rays, protecting the critical DNA and RNA biomolecules which form the basis of life from “genetic damage (Lomax 2013). The mining of Uranium, enrichment of Uranium-235 and the production of the artificial Plutonium-238 and 240 isotopes have opened a source of radioactive radiation released to the Earth’s atmosphere, water and soil, as recorded as a distinct anthropogenic radioactive layer in the deep oceans. Nuclear tests in remote parts of the Earth have already commenced a nuclear war against indigenous people, including in Japan, Marshall Islands, Novaya Zemlya, Kazakhstan, Polynesia and the Sahara and Gobi Deserts. Despite the above, proponents of nuclear energy, assuming responsible human handling of fissile materials in the future, propose nuclear energy replaces carbon-based combustion systems. However, the fallibility of the nuclear industry has already been demonstrated by major nuclear accidents, such as in Chernobyl and Fukushima, as well as radioactive spills. Nuclear energy facilities have facilitated lateral proliferation of nuclear weapons. Extrapolating from ~500 megaton tests and release of plutonium from satellite accident, radiation levels from a 1000 and a 10,000 megaton war would reach a scale of 4.2 × 10¹¹ Curies and 4.2 × 10¹² Curies, respectively. Consequent proliferation of radiation hot spots around the world and triggered nuclear winter conditions arising from global smoke and soot released from burnt cities would result in a loss of life on the scale of more than one billion. The longer term consequences of a nuclear conflict are difficult to evaluate. Given the history of the atomic age, H. sapiens can hardly be trusted to limit the destructive potential of the splitting of the atom.
https://link.springer.com/chapter/10.1007/978-3-319-57237-6_2
___________________________
RADIONUCLIDES IN THE OCEANS - Inputs and Inventories.
1996
This book is a collection of papers given on the first day of the
international symposium Radionuclides in the Oceans (RADOC 96-97). This
symposium was organized by the Nuclear Safety and Protection Institute
(irsn) and the Ministry of Agriculture, Fisheries and Food (MAFF). It
was divided into two parts. The first part, « Inventories, Behaviour and
Processes », took place at Octeville Cherbourg, France (7-11 October
1996) and dealt with the same themes as the 1987 Cherbourg symposium
(Radionuclides as a tool for oceanography) and the 1991 Norwich
symposium (Radionuclides in the study of marine processes). The second
part, « Impacts on Man and the environment », will take place at Norwich
and Lowestoft (7-11 April 1997), and will cover the themes of
radiological and environmental protection and modelling. Ten years after
Chernobyl, after the French decision to end nuclear weapon testing in
the Pacific Ocean, after the end of the OECD-NEA Coordinated Research
and Environmental Surveillance Programme related to low-level waste
dumping in deep sea, and one hundred years after the discovery of
radioactivity, irsn has considered it useful to assemble the available
information on artificial radioactivity levels in the seas and oceans.
The objective is to address scientific and public concerns about the use
of the sea as a « waste repository », and to answer regarding the
radioactive contamination of the seas and oceans. Therefore,
international experts have been invited to describe and quantify, during
the first day of the symposium (Part 1), the inputs and inventories of
artificial radionuclides released in seas and oceans by civil and
military activities. In the different chapters of this book,
radionuclides are studied in geographical areas of different size, and
varying physical and biological features. Therefore, some presentations
deal with oceans taken as a whole (Atlantic, Pacific and Indian oceans).
Some sources of radionuclides, such as atmospheric fallout, both before
and after Chernobyl, have a large scale impact, whereas others, such as
marine dumping sites, sites for nuclear weapon tests, and damaged
submarines provide more localised inputs of artificial radionuclides.
Others presentations focus on of particular interest seas from the point
of view of specific radionuclide sources and the particular processes
which govern radionuclide behaviour. The Channel, the North Sea and the
Irish Sea are quite shallow and receive, directly or indirectly a small
fraction of the wastes released by reprocessing plant wastes. The Baltic
Sea has been strongly affected by Chernobyl, and is subject to a high
salinity pressure gradient. The Black Sea has also been marked by
Chernobyl and is s1trongly anoxic. The Mediterranean Sea receives an
input of radionuclides from the Rhone River outflow into the western
basin and has exchanges with the Atlantic Ocean. Dumped radioactive
wastes, radionuclide inputs from the Ob and Yenisei river basins,
radionuclides from European reprocessing plants transported by ocean
currents, and radionuclide transport by ice must be considered in the
Arctic, Barents, Kara and Laptev Seas. It appears that such a
comprehensive review of all the available data has not been made in
recent years and it is the aim of this book to provide it. The
production of this book was made possible by the collaborative efforts
of the international experts in providing, within a tight schedule, the
inputs requested by irsn; they deserve our gratitude. We are very
grateful to the Minister of the Environment, Mrs Corinne Lepage, who has
accepted to open the session devoted to inputs and inventories of
radionuclides in seas and oceans.
https://www.irsn.fr/page/radionuclides-oceans-inputs-and-inventories
___________________________
Radium Isotopes Across the Arctic Ocean Show Time Scales of Water Mass Ventilation and Increasing Shelf Inputs
1 July 2018
The
first full transarctic section of 228Ra in surface waters measured
during GEOTRACES cruises PS94 and HLY1502 (2015) shows a consistent
distribution with maximum activities in the Transpolar Drift. Activities
in the central Arctic have increased from 2007 through 2011 to 2015.
The increased 228Ra input is attributed to stronger wave action on
shelves resulting from a longer ice‐free season. A concomitant decrease
in the 228Th/228Ra ratio likely results from more rapid transit of
surface waters depleted in 228Th by scavenging over the shelf.
The 228Ra activities observed in intermediate waters (< 1500m) in the
Amundsen Basin are explained by ventilation with shelf water on a time
scale of about 15‐18 years, in good agreement with estimates based on
SF6 and 129I/236U.
The 228Th excess below the mixed layer up to 1500m depth can complement
234Th and 210Po as tracers of export production, after correction for
the inherent excess resulting from the similarity of 228Ra and 228Th
decay times. We show with a Th/Ra profile model that the 228Th/228Ra
ratio below 1500m is inappropriate for this purpose because it is a
delicate balance between horizontal supply of 228Ra and vertical flux of
particulate 228Th.
The accumulation of 226Ra in the deep Makarov Basin is not associated
with an accumulation of Ba and can therefore be attributed to supply
from decay of 230Th in the bottom sediment. We estimate a ventilation
time of 480 years for the deep Makarov‐Canada Basin, in good agreement
with previous estimates using other tracers.
https://www.semanticscholar.org/paper/Radium-Isotopes-Across-the-Arctic-Ocean-Show-Time-Loeff-Kipp/98003261eec17d21902b1b1a241d11a3586e20a7
___________________________
Arctic warming interrupts the Transpolar Drift and affects long-range transport of sea ice and ice-rafted matter.
Abstract
Sea ice is an important transport vehicle for gaseous, dissolved and
particulate matter in the Arctic Ocean. Due to the recently observed
acceleration in sea ice drift, it has been assumed that more matter is
advected by the Transpolar Drift from shallow shelf waters to the
central Arctic Ocean and beyond. However, this study provides first
evidence that intensified melt in the marginal zones of the Arctic Ocean
interrupts the transarctic conveyor belt and has led to a reduction of
the survival rates of sea ice exported from the shallow Siberian shelves
(-15% per decade). As a consequence, less and less ice formed in
shallow water areas (<30 m) has reached Fram Strait (-17% per
decade), and more ice and ice-rafted material is released in the
northern Laptev Sea and central Arctic Ocean. Decreasing survival rates
of first-year ice are visible all along the Russian shelves, but
significant only in the Kara Sea, East Siberian Sea and western Laptev
Sea. Identified changes affect biogeochemical fluxes and ecological
processes in the central Arctic: A reduced long-range transport of sea
ice alters transport and redistribution of climate relevant gases, and
increases accumulation of sediments and contaminates in the central
Arctic Ocean, with consequences for primary production, and the
biodiversity of the Arctic Ocean.
https://europepmc.org/article/MED/30940829
___________________________
Increased fluxes of shelf-derived materials to the central Arctic Ocean.
03 Jan 2018
Abstract
Rising temperatures in the Arctic Ocean region are responsible for
changes such as reduced ice cover, permafrost thawing, and increased
river discharge, which, together, alter nutrient and carbon cycles over
the vast Arctic continental shelf. We show that the concentration of
radium-228, sourced to seawater through sediment-water exchange
processes, has increased substantially in surface waters of the central
Arctic Ocean over the past decade. A mass balance model for 228Ra
suggests that this increase is due to an intensification of
shelf-derived material inputs to the central basin, a source that would
also carry elevated concentrations of dissolved organic carbon and
nutrients. Therefore, we suggest that significant changes in the
nutrient, carbon, and trace metal balances of the Arctic Ocean are
underway, with the potential to affect biological productivity and
species assemblages in Arctic surface waters.
https://europepmc.org/article/MED/29326980
___________________________
Methanogenic communities in permafrost-affected soils of the Laptev Sea coast, Siberian Arctic, characterized by 16S rRNA gene fingerprints
2 February 2007
Abstract
Permafrost environments in the Arctic are characterized by extreme environmental conditions that demand a specific resistance from microorganisms to enable them to survive. In order to understand the carbon dynamics in the climate-sensitive Arctic permafrost environments, the activity and diversity of methanogenic communities were studied in three different permafrost soils of the Siberian Laptev Sea coast. The effect of temperature and the availability of methanogenic substrates on CH4 production was analysed. In addition, the diversity of methanogens was analysed by PCR with specific methanogenic primers and by denaturing gradient gel electrophoresis (DGGE) followed by sequencing of DGGE bands reamplified from the gel. Our results demonstrated methanogenesis with a distinct vertical profile in each investigated permafrost soil. The soils on Samoylov Island showed at least two optima of CH4 production activity, which indicated a shift in the methanogenic community from mesophilic to psychrotolerant methanogens with increasing soil depth. Furthermore, it was shown that CH4 production in permafrost soils is substrate-limited, although these soils are characterized by the accumulation of organic matter. Sequence analyses revealed a distinct diversity of methanogenic archaea affiliated to Methanomicrobiaceae, Methanosarcinaceae and Methanosaetaceae. However, a relationship between the activity and diversity of methanogens in permafrost soils could not be shown.
https://academic.oup.com/femsec/article/59/2/476/553776?login=false
___________________________
Episodic warming of near-bottom waters under the Arctic sea ice on the central Laptev Sea shelf
20 December 2015
Abstract
A multiyear mooring record (2007–2014) and satellite imagery highlight the strong temperature variability and unique hydrographic nature of the Laptev Sea. This Arctic shelf is a key region for river discharge and sea ice formation and export and includes submarine permafrost and methane deposits, which emphasizes the need to understand the thermal variability near the seafloor. Recent years were characterized by early ice retreat and a warming near-shore environment. However, warming was not observed on the deeper shelf until year-round under-ice measurements recorded unprecedented warm near-bottom waters of +0.6°C in winter 2012/2013, just after the Arctic sea ice extent featured a record minimum. In the Laptev Sea, early ice retreat in 2012 combined with Lena River heat and solar radiation produced anomalously warm summer surface waters, which were vertically mixed, trapped in the pycnocline, and subsequently transferred toward the bottom until the water column cooled when brine rejection eroded stratification.
https://agupubs.onlinelibrary.wiley.com/doi/full/10.1002/2015GL066565
___________________________
The Arctic wasteland: a perspective on Arctic pollution
27 October 2009
___________________________
Polar marine ecosystems: major threats and future change
March 2003
https://www.jstor.org/stable/44521810
___________________________
Grain size separation and sediment mixing in Arctic Ocean sediments: evidence from the strontium isotope systematic
1999
https://www.sciencedirect.com/science/article/abs/pii/S0009254199000261
___________________________
The Role of Ice Cover in the Formation of Bottom Sediment Chemical Composition on the East Siberian Shelf
17 June 2021
https://link.springer.com/article/10.1134/S0016702921050025
___________________________
Impacts of metals and nutrients released from melting multiyear Arctic sea ice
03 July 2010
Abstract
[1] Nutrients (C, N, and P) and metals (iron, molybdenum, nickel, zinc, vanadium, copper, and cobalt) were determined in water and multiyear ice sampled along the Greenland current and Fram Strait in July 2007. Total metal and nutrient concentrations in ice varied fivefold to tenfold, for most elements, across the area sampled. Data show that some nutrients (i.e., NH4+) and metals (i.e., Fe, Zn, V, Cu, Ni, Mo, and Co) are enriched in Arctic ice relative to surface seawaters, suggesting that ice melting is a significant source of metals to the receiving seawaters, particularly Fe and Zn whose concentrations were significantly (t test, P < 0.05) more than 2 orders of magnitude higher in ice than in surface seawater.
1. Introduction
[2] Atmospheric deposition is a major source of biogenic elements to the ocean [Duce et al., 1991; Duce and Tindale, 1991; Jickells, 1995]. In polar regions, the flux of atmospheric materials into the ocean is precluded by the presence of an ice cover, where materials may accumulate [Maenhaut et al., 1996; Granskog et al., 2003]. Other predominant inputs of materials to the sea ice in the Arctic are from suspended sediment incorporated into newly formed ice through the suspension freezing, river discharges, runoff from land and oceanic water mass exchange [Yeats and Westerlund, 1991; Thomas and Dieckmann, 2002], Melting of this ice cover may lead to the abrupt release of these materials into the ocean, where they may contribute to trace metals concentration of surface water [Campbell and Yeats, 1982] and affect biological activity [Pfirman et al., 1995; Ritterhoff and Zauke, 1997].
[3] Recent evidence for accelerated rates of multiyear ice loss in the Arctic [Rigor and Wallace, 2004; Nghiem et al., 2007] has prompted interest in the possible biological consequences of the shift from an ice-covered to an open water Arctic Ocean [Aguilar-Islas et al., 2008; Wassmann, 2008; Wassmann et al., 2008]. Most analyses have focused on the increased deep irradiance associated with ice loss and the ensuing increase in photosynthetic rates, as supported from evidence of increased primary production with reduced Arctic ice cover derived using remote sensing [e.g., Arrigo et al., 2008; Wassmann et al., 2008]. These reports argue that nutrient limitation may set a limit to the biological response on reduced ice cover [e.g., Arrigo et al., 2008]. However, these studies have not yet considered the role of melting of multiyear Arctic ice as a potential vector of nutrient inputs into the Arctic Ocean, potentially amplifying biological responses to reduced ice cover. The reason for this gap in the discussion of possible impacts of ice melting on plankton communities may be the current paucity of data on the load of biogenic elements in multiyear Arctic ice.
[4] Here we report concentrations of biogenic elements in multiyear ice sampled along the Greenland current and Fram Strait. We examine concentrations of nitrogen, phosphorus and organic carbon, as well as those of trace metals incorporated by biological systems and used for a range of processes, from photosynthesis to nitrogen fixation (i.e., iron, molybdenum, nickel, zinc, vanadium, copper and cobalt).
https://agupubs.onlinelibrary.wiley.com/doi/full/10.1029/2009JC005685
___________________________
Holocene sea-ice conditions and circulation at the Chukchi-Alaskan margin, Arctic Ocean, inferred from biomarker proxies
June 23, 2016
https://journals.sagepub.com/doi/10.1177/0959683616645939
___________________________
Limited contribution of ancient methane to surface waters of the U.S. Beaufort Sea shelf
17 Jan 2018
https://www.science.org/doi/10.1126/sciadv.aao4842
___________________________
Study Finds Strong Marine Heatwaves in the Arctic
January 25, 2022
https://www.ncei.noaa.gov/news/study-finds-strong-marine-heatwaves-arctic
___________________________
Arctic Report Card 2021: Sea ice changes, rain on Greenland ice sheet among dramatic changes in North
December 14, 2021
https://www.rcinet.ca/eye-on-the-arctic/2021/12/14/arctic-report-card-2021-sea-ice-changes-rain-on-greenland-ice-sheet-among-dramatic-changes-in-north/
___________________________
Oil spill in Canadian Arctic could be devastating for environment and indigenous peoples, study finds
July 7, 2021
https://www.sciencedaily.com/releases/2021/07/210707112247.htm
___________________________
More lightning in the Arctic is bad news for the planet
4/11/2021
https://arstechnica.com/science/2021/04/more-lightning-in-the-arctic-is-bad-news-for-the-planet/
___________________________
A spike in Arctic lightning strikes may be linked to climate change
April 6, 2021
Arctic lightning has gotten way more frequent over the last decade amid rising global temperatures, study finds

Lightning crackles during a storm in northwestern Alaska. A global network of lightning sensors indicates that thunderstorms in the Arctic may be getting more common as the world warms.
https://www.sciencenews.org/article/arctic-lightning-climate-change-global-warming
___________________________
Britain offers Canadian military help to defend the Arctic
Sep 24, 2021
https://www.cbc.ca/news/politics/britain-uk-canada-arctic-defence-submarines-russia-china-1.6187347
___________________________
Britain to boost military presence in Arctic
March 29, 2022yclutch or kick
https://www.reuters.com/world/uk/britain-boost-military-presence-arctic-2022-03-29/
___________________________
Russia Calls Increased NATO Military Activity in the Arctic Worrying, Warns of 'Unintended Incidents'
17 April 2022
https://www.newsmax.com/newsfront/russia-nato-arctic-warning/2022/04/17/id/1066015/
___________________________
Is It Possible to Continue Cooperating with Russia in the Arctic Council?
June 29, 2022
https://gjia.georgetown.edu/2022/06/29/is-it-possible-to-continue-cooperating-with-russia-in-the-arctic-council/
___________________________
Tensions will likely grow as China seeks bigger role in the Arctic
May 20 2021
https://www.cnbc.com/2021/05/20/tensions-likely-to-grow-as-china-seeks-a-bigger-role-in-the-arctic.html
___________________________
Arctic: Norway does not violate treaty by blocking Russian cargo to Svalbard, says Oslo
6/29/2022
https://newsrnd.com/business/2022-06-29-arctic--norway-does-not-violate-treaty-by-blocking-russian-cargo-to-svalbard--says-oslo.H1WS7oV99c.html
___________________________
Russia accuses Norway of Arctic blockade and threatens reprisals
30/06/2022
https://www.euronews.com/2022/06/29/russia-accuses-norway-of-arctic-blockade-and-threatens-reprisals
___________________________
Why the space community should care about Arctic geopolitics
January 8, 2025
https://spacenews.com/why-the-space-community-should-care-about-arctic-geopolitics/
___________________________
Report: Russia Encroaching on Arctic Region
February 3, 2025
https://washingtonstand.com/news/report-russia-encroaching-on-arctic-region-
___________________________
Warming US-Russia ties could put China’s Arctic ambitions on ice, experts warn
16 Mar 2025
Beijing has relied on Moscow for access to the far north but a geopolitical realignment is under way that could see it frozen out
___________________________
Melting Arctic Ice Could Transform International Shipping Routes -Study
June 27, 2022
https://www.marinelink.com/news/melting-arctic-ice-transform-497627
___________________________
Biden predicts ‘potential conflict’ between US, Russia over melting Arctic
June 1, 2022
https://nypost.com/2022/06/01/biden-predicts-potential-conflict-between-us-russia-over-melting-arctic/
___________________________
Arctic science crumbles with Russia’s invasion of Ukraine
April 1st 2022
https://www.nationalobserver.com/2022/04/01/news/arctic-science-crumbles-russias-invasion-ukraine
___________________________
Arctic police make sure far north doesn't go too Wild West
June 30, 2022
https://news.kisspr.com/2022/06/30/arctic-police-make-sure-far-north-doesnt-go-too-wild-west_306065.html
___________________________
Trudeau hints Arctic will be part of defence spending increase
April 6th 2022
https://www.nationalobserver.com/2022/04/06/news/trudeau-hints-arctic-defence-spending-increase
___________________________
Plutonium: The legacy of Sellafield
2001
https://www.sciencedirect.com/science/article/abs/pii/S1569486001800218
___________________________
Scientists are racing to save the Last Ice Area, an Arctic Noah’s Ark
November 15, 2021
The goal to preserve summer sea ice, and the creatures that depend on it, is ambitious

Scientists are pinning
their hopes on building a sanctuary for Arctic species in the Last Ice
Area (seen here), the region of the Arctic where summer sea ice will
last longest.
https://www.sciencenews.org/article/arctic-last-ice-area-climate-change
___________________________
What the ‘Blue Arctic’ Means for the US Pacific Military Presence
August 21, 2021
Melting
sea ice in the Arctic increases accessibility between the Atlantic and
the Pacific Oceans and mitigates a geographic disadvantage for the U.S.
Navy.
https://thediplomat.com/2021/08/what-the-blue-arctic-means-for-the-us-pacific-military-presence/
___________________________
Gigantic Moon Eclipsing the Sun in 'Arctic' is Fake. Here's the Truth Behind It
May 27, 2021
https://www.news18.com/news/buzz/gigantic-moon-eclipsing-the-sun-in-arctic-is-fake-viral-video-debunked-3782429.html
___________________________
Measurements and modeling of airborne plutonium in Subarctic Finland between 1965 and 2011
14 May 2020
https://acp.copernicus.org/articles/20/5759/2020/
___________________________
Natural
radionuclides and plutonium in sediments from the western Arctic Ocean:
Sedimentation rates and pathways of radionuclides
1997
https://www.semanticscholar.org/paper/Natural-radionuclides-and-plutonium-in-sediments-of-Huh-Pisias/717ed8ffb610c06b8886a4a91cc207b4fe38b6f3
___________________________
Freshly Made Plutonium From Outer Space Found On Ocean Floor
May 14, 2021
Something went boom in outer space and sent radioactive stardust our way, and it's just been found at the bottom of the ocean.
Traces
of rare forms of iron and plutonium have been found at the bottom of
the Pacific Ocean, after some kind of cataclysm in outer space created
this radioactive stuff and sent it raining down on our planet.
The
extraterrestrial debris arrived on Earth within the last 10 million
years, according to a report in the journal Science. Once it hit the
Pacific Ocean and settled to the bottom, nearly a mile down, the
material got incorporated into layers of a rock that was later hauled up
by a Japanese oil exploration company and donated to researchers.
"Just
knowing that there's plutonium there is amazing," says Brian Fields, an
astronomer at the University of Illinois at Urbana-Champaign who was
not part of the research team. "Now we only have tiny amounts of
material — after all, we're talking about hundreds of atoms here. But we
should be grateful for that, because they are freshly made from
exploding stars."
Freshly made specimens like these could help
scientists understand how the universe forged elements heavier than
iron, such as gold, platinum, uranium and plutonium. "These are the
elements where we are still in a mystery," says Anton Wallner, a
physicist with the Australian National University in Canberra who led
the international team that did the new work. "We do not know exactly
where they are produced and how much is produced in different sites."
https://www.wlrn.org/news/2021-05-14/freshly-made-plutonium-from-outer-space-found-on-ocean-floor
___________________________
Transport of plutonium in surface and sub-surface waters from the Arctic shelf to the North Pole via the Lomonosov Ridge
2002
https://www.sciencedirect.com/science/article/abs/pii/S0265931X01000972
___________________________
UN weather agency confirms Arctic heat record in Siberia
December 14, 2021
Average temperatures were 10 degrees higher than normal
https://www.foxnews.com/world/un-weather-agency-confirms-arctic-heat-record-siberia
___________________________
Navigating beneath the Arctic ice
April 23, 2021
A
team of MIT engineers has developed a navigational method for
autonomous vehicles to navigate accurately in the Arctic Ocean without
GPS.
https://news.mit.edu/2021/navigating-beneath-arctic-ice-0423
___________________________
“Arctic air freezes Permian shale fields”… Fake news?
2/16/2021
https://wattsupwiththat.com/2021/02/18/arctic-air-freezes-permian-shale-fields-fake-news/
___________________________
Putin Fires Back at U.S. Arctic Concerns: ‘We Will Knock Out Everyone’s Teeth’
May 20, 2021
Thinly
veiled threats from the Russian leader came moments after Secretary of
State Antony Blinken called on Russia to abide by ‘the rule of law’ in
the hotly contentious region.
https://www.usnews.com/news/world-report/articles/2021-05-20/putin-fires-back-at-us-arctic-concerns-we-will-knock-out-everyones-teeth
___________________________
The Arctic is burning like never before — and that’s bad news for climate change
10 September 2020
Fires
are releasing record levels of carbon dioxide, partly because they are
burning ancient peatlands that have been a carbon sink.
https://www.nature.com/articles/d41586-020-02568-y
___________________________
Norilsk Nickel pays $2.5 billion to Russia over massive Arctic oil spill
10 Mar 2021
https://www.abc.net.au/news/2021-03-11/nornickel-pays-2.5-billion-dollars-over-russian-oil-spill/13236186
___________________________
Arctic Ocean started to warm decades earlier than scientists thought
Nov. 24, 2021
Nov.
24 (UPI) -- The Arctic Ocean has been warming since the beginning of
the 20th century, fueled by a process known as Atlantification,
according to a study published Wednesday in the journal Science
Advances.
The new research highlights the connection between the
North Atlantic and Arctic between Greenland and Svalbard, a region known
was Fram Strait, where warmer, saltier water from the south has been
steadily infiltrating northern waters.
"Pinpointing the exact
timing of the onset of Atlantification in the Arctic can give us some
important clues as to the exact driving mechanisms behind this
phenomenon," study co-lead author Francesco Muschitiello told UPI in an
email.
A more precise Arctic warming timeline will also allow
scientists to compare the history of climate change in the Arctic to
changes in volcanism, solar activity, freshwater, greenhouse gases,
aerosols and more...
https://www.upi.com/Science_News/2021/11/24/arctic-warming-atlantification/2141637764455/
___________________________
Remobilization of dormant carbon from Siberian-Arctic permafrost during three past warming events
16 Oct 2020
https://www.science.org/doi/10.1126/sciadv.abb6546
___________________________
Massive
Russian oil spill said to threaten sea life in Arctic 'We are talking
about dead fish, polluted plumage of birds and poisoned animals' --
Sergey Verkhovets, coordinator of Arctic projects for WWF Russia...
June 5, 2020
https://www.undercurrentnews.com/2020/06/05/massive-russian-oil-spill-said-to-threaten-sea-life-in-arctic/
___________________________
This robot is going to map uncharted kelp forests in the Arctic–and the impact of climate change
2021
https://news.northeastern.edu/2021/07/21/this-robot-is-going-to-map-uncharted-kelp-forests-in-the-arctic/
___________________________
Ships Traveling the Thawing Arctic Are Leaving Garbage in Their Wake, Scientists Warn
Dec. 14, 2021
https://www.usnews.com/news/world/articles/2021-12-14/u-n-agency-confirms-2020-arctic-heat-record
___________________________
Arctic Drilling Plan in Alaska Hits Roadblock
21 February 2021
https://www.newsmax.com/newsfront/oil-arctic-drilling-polar/2021/02/21/id/1010864/
___________________________
Underneath the Arctic ice lies a political bloodbath
January 3, 2021
https://thetempest.co/2021/01/03/news/underneath-the-arctic-ice-lies-a-political-bloodbath/
___________________________
*Arctic
Sea Ice* reaches the 2021 minimum, with more ice left than in the past
seven years, due to cooler weather conditions in the western Arctic
28/09/2021
https://www.severe-weather.eu/global-weather/arctic-sea-ice-melt-minimum-2021-fa/
___________________________
Arctic sea ice hits record low for its usual peak growth period
March 28, 2025
https://phys.org/news/2025-03-arctic-sea-ice-usual-peak.html
___________________________
World's sea ice cover hits record low in February
March 6, 2025
https://phys.org/news/2025-03-global-sea-ice-february-world.html
___________________________
Arctic sea ice hits lowest peak in satellite record, says US agency
March 27, 2025
https://phys.org/news/2025-03-arctic-sea-ice-lowest-peak.html
___________________________
World's glacier mass shrank again in 2024, UN says
March 21, 2025
https://phys.org/news/2025-03-world-glacier-mass-shrank.html
___________________________
Himalayan snow at 23-year low, threatening 2 billion people: report
April 21, 2025
https://phys.org/news/2025-04-himalayan-year-threatening-billion-people.html
___________________________
Indigenous knowledge to help identify sustainable Arctic fish
May 26th 2021
https://www.nationalobserver.com/2021/05/26/news/indigenous-knowledge-help-identify-sustainable-arctic-fish
___________________________
U.S. study: Record highs, rain and beaver damage in Arctic
Dec 14, 2021
https://www.newspressnow.com/u-s-study-record-highs-rain-and-beaver-damage-in-arctic/article_910ee528-5d52-11ec-8242-dbf21b1f2123.html
___________________________
The Arctic Threat That Must Not be Named
January 28, 2021
https://warontherocks.com/2021/01/the-arctic-threat-that-must-not-be-named/
___________________________
Mysterious bacteria found in the Arctic can break down oil and diesel
20/08/2021
Ocean bacteria in the Canadian Arctic is capable of biodegrading diesel and oil, according to a new study.
Scientists
at the University of Calgary found “unexpected” microbes in the icy
waters of the Arctic which they say would respond well to an oil spill
in the region. The study’s findings were published in the Applied and
Environmental Microbiology journal.
Paraperlucidibaca,
Cycloclasticus, and Zhongshania, types of bacteria which live in the
Labrador Sea, are able to break down the fossil fuels present. They
clear up the ocean, ensuring that it remains a vital resource for
surrounding Indigenous communities.
https://www.euronews.com/green/2021/08/16/mysterious-bacteria-found-in-the-arctic-can-break-down-oil-and-diesel
___________________________
Antarctic microbe produces potential cancer-fighting drug
April 18, 2022
Researchers map the genetic machinery behind a natural anti-cancer compound from Antarctica for the first time
https://antarcticsun.usap.gov/science/4719/
___________________________
Northern expedition: China’s Arctic activities and ambitions
April 2021
https://www.brookings.edu/research/northern-expedition-chinas-arctic-activities-and-ambitions/
___________________________
China in the Canadian Arctic: Context, Issues, and Considerations for 2021 and Beyond
12 January 2021
https://www.ualberta.ca/china-institute/research/analysis-briefs/2021/arctic_analysis_brief.html
___________________________
Bellona urges the Arctic Council to tackle sunken radiation hazards
May 21, 2021
As
Russia begins its two-year chairmanship of the Arctic Council, Bellona
supports an international response to raising nuclear submarines and
other radioactive debris scuttled by the Soviet Union in Arctic seas.
https://bellona.org/news/arctic/2021-05-bellona-urges-the-arctic-council-to-tackle-sunken-radioactive-waste
___________________________
More Rain Than Snow Predicted for Arctic
December 1, 2021
https://consortiumnews.com/2021/12/01/more-rain-than-snow-predicted-for-arctic/
___________________________
Blinken Accuses Russia of Making ‘Unlawful’ Claims in the Arctic
2021
https://news.antiwar.com/2021/05/18/blinken-accuses-russia-of-making-unlawful-claims-in-the-arctic/
___________________________
Snowed in: Research team finds Arctic was dinosaur nursery
June 24, 2021
https://news.fsu.edu/news/science-technology/2021/06/24/snowed-in-research-team-finds-arctic-was-dinosaur-nursery/
___________________________
Scientists stunned by rare Arctic lightning storms north of Alaska
July 17, 2021
https://www.reuters.com/world/scientists-stunned-by-rare-arctic-lightning-storms-north-alaska-2021-07-16/
___________________________
Arctic fires, thawing permafrost pose growing threat to climate -study
May 17, 2021
https://www.reuters.com/business/environment/arctic-fires-thawing-permafrost-pose-growing-threat-climate-study-2021-05-17/
___________________________
Thawing permafrost dots Siberia with rash of mounds
April 30, 2025

The rapid thaw of the permafrost is cracking houses and releasing greenhouse gases.

Russia is the world's fifth biggest global emitter of greenhouse gases.
https://phys.org/news/2025-04-permafrost-dots-siberia-rash-mounds.html
___________________________
VIKING SETTLEMENTS IN ICELAND AND GREENLAND
2019
https://www.encyclopedia.com/humanities/encyclopedias-almanacs-transcripts-and-maps/viking-settlements-iceland-and-greenland
___________________________
Vikings grew barley in Greenland
2012
A
sensational find at the bottom of an ancient rubbish heap in Greenland
suggests that Vikings grew barley on the island 1,000 years ago.
https://sciencenordic.com/agriculture-archaeology-denmark/vikings-grew-barley-in-greenland/1447746
___________________________
Soil Frozen For 2.7 Million Years Shows 'Greenland Was Green'
04/17/14
https://www.ibtimes.co.uk/soil-frozen-2-7-million-years-shows-greenland-was-green-1445267
___________________________
Bacterial community composition and diversity of five different permafrost-affected soils of Northeast Greenland
13 May 2014
https://onlinelibrary.wiley.com/doi/abs/10.1111/1574-6941.12352
___________________________
Rates and processes of aeolian soil erosion in West Greenland
January 18, 2017
https://journals.sagepub.com/doi/full/10.1177/0959683616687381
___________________________
New Map Finally Reveals What's Hidden Under Greenland's Vast Ice Sheets
15 December 2017
https://www.sciencealert.com/map-underneath-greenland-ice-shows-sea-level-rises
___________________________
Presence of psychrotolerant phenanthrene-mineralizing bacterial populations in contaminated soils from the Greenland High Arctic
2010 Feb 3
https://pubmed.ncbi.nlm.nih.gov/20199573/
___________________________
Ancient Landscape Is Found Under 2 Miles Of Ice In Greenland
April 19, 2014
https://www.npr.org/sections/thetwo-way/2014/04/19/304914190/ancient-landscape-is-found-under-two-miles-of-ice-in-greenland
___________________________
When Greenland was green in warmer times
2014
https://wattsupwiththat.com/2014/04/17/when-greenland-was-green-in-warmer-times/
___________________________
Scientists discover ‘world’s northernmost island’ off Greenland’s coast
27 Aug 2021
Researchers say the tiny island in Greenland – roughly 30 metres across – was exposed by shifting pack ice
https://www.theguardian.com/world/2021/aug/28/scientists-discover-worlds-northernmost-island-off-greenlands-coast
___________________________
6 mysterious structures hidden beneath the Greenland ice sheet
August 27, 2021
Nearly 2 miles thick in places, the ice sheet hides a landscape of canyons, mountains, fjords and gem-like lakes.


Ice seems to go on forever at Humboldt Glacier in northwest Greenland.

The blue rivers and splotches are Greenland's surface meltwaters.
https://www.livescience.com/landscapes-hidden-greenland-ice-sheet.html
___________________________
Greenland ice sheet's winds driving tundra soil erosion, study finds
August 12, 2015
https://www.sciencedaily.com/releases/2015/08/150812131922.htm
___________________________
The Role of Biological Soil Crusts in Nitrogen Cycling and Soil Stabilization in Kangerlussuaq, West Greenland
04 June 2018
https://link.springer.com/article/10.1007/s10021-018-0267-8
___________________________
A
multimillion-year-old record of Greenland vegetation and glacial
history preserved in sediment beneath 1.4 km of ice at Camp Century
March 15, 2021
https://www.pnas.org/doi/10.1073/pnas.2021442118
___________________________
Generating seamless global daily AMSR2 soil moisture (SGD-SM) long-term products for the years 2013–2019
31 Mar 2021
https://essd.copernicus.org/articles/13/1385/2021/
___________________________
A top-secret Cold War project unearthed ancient fossils buried deep under the Greenland ice sheet
Mar 17, 2021
https://www.businessinsider.com/cold-war-project-greenland-ice-sheet-plant-fossils-2021-3?op=1
___________________________
Soil–air phase characteristics: Response to texture, density, and land use in Greenland and Denmark
05 June 2021
https://acsess.onlinelibrary.wiley.com/doi/10.1002/saj2.20284
___________________________
Gas diffusion characteristics of agricultural soils from South Greenland
10 June 2020
https://acsess.onlinelibrary.wiley.com/doi/10.1002/saj2.20114
___________________________
Net regional methane sink in High Arctic soils of northeast Greenland
08 December 2014
https://www.nature.com/articles/ngeo2305
___________________________
Massive meteor crater discovered beneath Greenland's ice is much older than thought
March 9, 2022
https://www.cnn.com/2022/03/09/world/crater-greenland-age-scn/index.html
___________________________
Researchers Find 3-million-year-old Landscape Beneath Greenland Ice Sheet
April 18, 2014
https://www.nasa.gov/content/goddard/researchers-find-3-million-year-old-landscape-beneath-greenland-ice-sheet/
___________________________
Viking History Is Melting Away in Greenland
July 11, 2019
Climate change is already rotting archaeological sites in the Arctic, and Norse Viking-era settlements are at high risk
https://www.scientificamerican.com/article/viking-history-is-melting-away-in-greenland/
___________________________
Viking bones and DNA will decay quickly as Greenland thaws
The ground is thawing.
2019
https://mashable.com/article/viking-greenland-remains-decay
___________________________
Soil organic carbon stocks in permafrost-affected soils in West Greenland
2016
https://www.sciencedirect.com/science/article/abs/pii/S0016706116302695
___________________________
Microscopic fungi enhance soil carbon storage in new landscapes created by shrinking Arctic glaciers
July 1, 2024
https://phys.org/news/2024-07-microscopic-fungi-soil-carbon-storage.html
___________________________
Arctic Ocean may absorb less CO₂ than projected due to coastal erosion
August 12, 2024
https://phys.org/news/2024-08-arctic-ocean-absorb-co8322-due.html
___________________________
How plant coverage is affecting the Arctic carbon cycle
September 4, 2024
https://phys.org/news/2024-09-coverage-affecting-arctic-carbon.html
___________________________
After millennia as CO₂ sink, more than one-third of Arctic-boreal region is now a source
January 21, 2025
After millennia as a carbon deep-freezer for the planet, regional hotspots and increasingly frequent wildfires in the northern latitudes have nearly canceled out that critical storage capacity in the permafrost region, according to a study published in Nature Climate Change.
An international team led by Woodwell Climate Research Center found that a third (34%) of the Arctic-boreal zone (ABZ)—the treeless tundra, boreal forests, and wetlands that make up Earth's northern latitudes—is now a source of carbon to the atmosphere. That balance sheet is made up of carbon dioxide (CO2) uptake from plant photosynthesis and CO2 released to the atmosphere through microbial and plant respiration.
When emissions from fire were added, the percentage grew to 40%.
The findings represent the most current and comprehensive assessment of carbon fluxes in the ABZ to date. Drawing on a library of CO₂ data four times as large as earlier upscaling efforts gathered from 200 study sites from 1990–2020, the analysis captures both year-round dynamics and important recent shifts in climate and northern fire regimes that have altered the carbon balance in the north.
https://phys.org/news/2025-01-millennia-arctic-boreal-region-source.html
___________________________
The Flora of Greenland
Greenland
is much greener than most people think. Colourful flowers, lush meadows
and hardy plants spring up when the summer's mild winds blow.
https://visitgreenland.com/about-greenland/flora-greenland/
___________________________
What a mile-deep soil sample can teach us about climate change
Mar 22, 2021
https://www.weforum.org/agenda/2021/03/preserved-sample-greenland-glacier-climate-change/
___________________________
Ancient leaves preserved under a mile of Greenland's ice – and lost in a freezer for years – hold lessons about climate change
April 16, 2022
https://news.yahoo.com/ancient-leaves-preserved-under-mile-190707994.html
___________________________
Ancient Soil Found Under Greenland Ice Sheet Dates Back 2.7 Million Years
Dec 6, 2017
Landscape Predating Human Beings Found Under Ice
https://www.huffpost.com/entry/ancient-soil-greenland-ice-sheet_n_5173503
___________________________
Greenland: A land of ice and... Other stuff
September 8, 2017
https://www.climate.gov/news-features/event-tracker/greenland-land-ice-andother-stuff
___________________________
A 2500 year record of natural and anthropogenic soil erosion in South Greenland
7 May 2020
https://hal.archives-ouvertes.fr/hal-00648503/document
___________________________
Greenland ice loss in 2020 was below the record but above average
December 8, 2020
https://www.climate.gov/news-features/featured-images/greenland-ice-loss-2020-was-below-record-above-average
___________________________
Greenland News
https://www.newsnow.com/us/World/Europe/Northern+Europe/Greenland
___________________________
The hidden meltdown of Greenland
September 21, 2015
https://climate.nasa.gov/news/2342/the-hidden-meltdown-of-greenland/
___________________________
Greenland’s Nearing a Climate Tipping Point. How Long Warming Lasts Will Decide Its Fate, Study Says
December 23, 2019
Past
meltdowns occurred with temperatures only slightly higher than today's,
suggesting the world is overestimating the ice sheet's stability,
scientists say.
https://insideclimatenews.org/news/23122019/greenland-ice-sheet-climate-tipping-point-temperature-duration-sea-level-rise-pnas-study/
___________________________
It Rained at the Summit of Greenland. That's Never Happened Before
2021
https://www.nytimes.com/2021/08/20/climate/greenland-rain-ice-sheet.html
___________________________
Greenland is crying — can it be saved from mining and climate change?
2021
https://thehill.com/changing-america/opinion/584953-greenland-is-crying-can-it-be-saved-from-mining-and-climate-change/
___________________________
Iceland Rises as Its Glaciers Melt From Climate Change
With
the country's glaciers melting faster, the crust near the glaciers is
rebounding at an accelerated rate, according to a UA-led team of
geoscientists.
Jan. 29, 2015
https://news.arizona.edu/story/iceland-rises-as-its-glaciers-melt-from-climate-change
___________________________
Another Climate Alarmist Admits Real Motive Behind Warming Scare
03/29/2016
https://www.investors.com/politics/editorials/another-climate-alarmist-admits-real-motive-behind-warming-scare/
___________________________
Slate Exclusive: Why Greenland’s “Dark Snow” Should Worry You
Sept 16, 2014
https://slate.com/technology/2014/09/jason-box-s-research-into-greenland-s-dark-snow-raises-more-concerns-about-climate-change.html
___________________________
In Greenland, a climate change mystery with clues written in water and stone
January 25, 2016
https://www.whoi.edu/press-room/whoi-in-the-news/in-greenland-a-climate-change-mystery-with-clues-written-in-water-and-stone/
___________________________
Greenland ice more resistant to climate change than feared, study shows
August 10, 2012
https://www.naturalnews.com/036760_Greenland_climate_change_ice_melting.html
___________________________
Greenland ice melt caused by more sunny days, not catastrophic climate change, scientists discover
July 10, 2017
https://naturalnews.com/2017-07-10-greenland-ice-melt-caused-by-more-sunny-days-not-catastrophic-climate-change-scientists-discover.html
___________________________
Climate
change hoax collapses as Michael Mann’s bogus “hockey stick” graph
defamation lawsuit dismissed by the Supreme Court of British Columbia
08/26/2019
https://climate.news/2019-08-26-climate-change-hoax-collapses-as-michael-mann-bogus-hockey-stick-graph.html
___________________________
Accelerating melt rate makes Greenland Ice Sheet world's largest 'dam'
February 21, 2022

Water flowing into a moulin and down to the bed of Store Glacier, Greenland.

Tents with supraglacial lake on Store Glacier, Greenland.

Science camp on Store Glacier near supraglacial lake on Store Glacier, Greenland.
https://phys.org/news/2022-02-greenland-ice-sheet-world-largest.html
___________________________
Greenland ice cap loses enough water in 20 years to cover US: study
February 1, 2022
https://phys.org/news/2022-02-greenland-ice-cap-years.html
___________________________
Lakes on Greenland Ice Sheet can drain huge amounts of water, even in winter
March 31, 2021
https://phys.org/news/2021-03-lakes-greenland-ice-sheet-huge.html
___________________________
Heatwave causes massive melt of Greenland ice sheet
July 31, 2021
https://phys.org/news/2021-07-heatwave-massive-greenland-ice-sheet.html
___________________________
Why is Greenland Melting?
June 1, 2017
https://www.pbs.org/wgbh/frontline/article/why-is-greenland-melting/
___________________________
Greenland Is Melting at Some of the Fastest Rates in 12,000 Years
October 1, 2020
If greenhouse gas emissions do not decline, melt rates could quadruple and further add to sea level rise
https://www.scientificamerican.com/article/greenland-is-melting-at-some-of-the-fastest-rates-in-12-000-years/
___________________________
Greenland, Antarctica Melting Six Times Faster Than in the 1990s
Mar 16, 2020
https://www.nasa.gov/feature/jpl/greenland-antarctica-melting-six-times-faster-than-in-the-1990s
___________________________
Greenland is melting and it even looks bad from space
Aug. 2, 2019
NASA satellite images tell a sobering story of the impact of extreme weather on Greenland's ice.
https://www.cnet.com/science/greenland-is-melting-and-it-even-looks-bad-from-space/
___________________________
'Massive melting event' sinks billions of tons of Greenland ice amid heat wave
August 6, 2021

'Massive melting event' sinks billions of tons of Greenland ice amid heat wave
https://news.yahoo.com/massive-melting-event-sinks-billions-150618666.html
___________________________
Greenland's ice melted away at least once in last million years
March 17, 2021
The
ice sheet atop Greenland —which holds enough frozen water to swamp
coastal cities worldwide—has melted to the ground at least once in the
last million years despite CO2 levels far lower than today, stunned
scientists have reported.
The surprise discovery of plant fossils
in soil samples extracted in the 1960s by US army engineers from
beneath two kilometres of ice is smoking-gun proof that Greenland—three
times the size of Texas—was covered with lichen, moss and perhaps trees
in the not-so-distant past.
It is also a red flag for the accelerating impact of climate change.
"Our
findings tell us the Greenland ice sheet is vulnerable," Paul Bierman, a
geologist at the University of Vermont and lead author of a study this
week in the Proceedings of the National Academy, told AFP.
Until
the late 1990s, Greenland's ice sheet was roughly in balance, gaining as
much mass through snowfall as it lost in summer from crumbling glaciers
and melt-off.
But over the last two decades, the gathering pace of global warming has upended that balance.
In
2019, Greenland cast off more than half-a-trillion tonnes of ice and
meltwater, accounting for 40 percent of total sea level rise that
year....
https://phys.org/news/2021-03-greenland-ice-million-years.html
___________________________
‘Massive melting event’ torpedoes billions of tons of ice the whole world depends on
Aug. 9, 2021
https://thehill.com/changing-america/sustainability/climate-change/566950-massive-melting-event-torpedoes-billions-of/
___________________________
Greenland’s Microbial Melt-Down
01/22/2021
https://www.sciencefriday.com/segments/greenland-melting-microbes/
___________________________
Melting of Greenland glacier generating its own heat and accelerating thaw from base, says study
February 22, 2022
https://www.rcinet.ca/eye-on-the-arctic/2022/02/22/melting-of-greenland-glacier-generating-its-own-heat-and-accelerating-thaw-from-base-says-study/
___________________________
Is vanishing sea ice causing Greenland to melt?
March 29th, 2016
Researchers
have discovered a link between disappearing Arctic sea ice and dogged
weather systems that are rapidly melting the surface of Greenland.
During
Greenland summers, melting Arctic sea ice favors stronger and more
frequent “blocking-high” pressure systems, which spin clockwise, stay
largely in place, and can block cold, dry Canadian air from reaching the
island.
https://www.futurity.org/greenland-sea-ice-1126682-2/
___________________________
Greenland melting likely increased by bacteria in sediment
January 14, 2021
Microbes in meltwater stream sediment may help boost island's contribution to sea-level rise
https://www.sciencedaily.com/releases/2021/01/210114163858.htm
___________________________
Crater under Greenland points to climate-altering impact in the time of humans
2018
https://news.ycombinator.com/item?id=18458138
___________________________
Greenland ice sheet witnessed historic rain in 2021. Scientists reveal why the bizarre event happened
May 26, 2022
https://www.indiatoday.in/science/story/climate-change-greenland-ice-sheet-rain-global-warming-heatwave-1954351-2022-05-26
___________________________
Warming Seas Are Accelerating Greenland's Glacier Retreat
January 25, 2021
Greenland’s melting glaciers, which plunge into Arctic waters via steep-sided inlets, or fjords, are among the main contributors to global sea level rise in response to climate change. Gaining a better understanding of how warming ocean water affects these glaciers will help improve predictions of their fate. Such predictions could in turn be used by communities around the world to better prepare for flooding and mitigate coastal ecosystem damage.
But researchers have long lacked measurements of the depths of the fjords along Greenland’s craggy coast. Without this information, it’s extremely difficult to arrive at a precise assessment of how much ocean water is being allowed into the fjords and how that affects glacier melt. By measuring their fjords one by one, a new study published in Science Advances has quantified, for the first time, how the warming coastal waters are impacting Greenland’s glaciers.
For the past five years, scientists with the Oceans Melting Greenland (OMG) mission have been studying these marine-terminating glaciers from the air and by ship. They found that of the 226 glaciers surveyed, 74 in deep fjords accounted for nearly half of the total ice loss (as previously monitored by satellites) from Greenland between 1992 and 2017. These glaciers exhibited the most undercutting, which is when a layer of warm, salty water at the bottom of a fjord melts the base of a glacier, causing the ice above to break apart. In contrast, the 51 glaciers that extend into shallow fjords or onto shallow ridges experienced the least undercutting and contributed only 15% of the total ice loss.
“I was surprised by how lopsided these findings were. The biggest and deepest glaciers are undercut much faster than the smaller glaciers in shallow water,” said lead author Michael Wood, a post-doctoral researcher at NASA’s Jet Propulsion Laboratory in Southern California, who began this research as a doctoral student at the University of California, Irvine. “In other words, the biggest glaciers are the most sensitive to the warming waters, and those are the ones really driving Greenland’s ice loss.”
In the case of Greenland’s glaciers, the bigger they are, the faster they melt. And the culprit is the depth of the fjord they occupy: Deeper fjords allow in more warm ocean water than shallow fjords, hastening the undercutting process...
https://sealevel.nasa.gov/news/211/warming-seas-are-accelerating-greenlands-glacier-retreat
___________________________
A recent reversal in the response of western Greenland's ice caps to climate change
September 9, 2021
Greenland
may be best known for its enormous continental scale ice sheet that
soars up to 3,000 meters above sea level, whose rapid melting is a
leading contributor to global sea level rise. But surrounding this
massive ice sheet, which covers 79% of the world's largest island, is
Greenland's rugged coastline dotted with ice capped mountainous peaks.
These peripheral glaciers and ice caps are now also undergoing severe
melting due to anthropogenic (human-caused) warming. However, climate
warming and the loss of these ice caps may not have always gone
hand-in-hand.
New collaborative research from the Woods Hole
Oceanographic Institution and five partner institutions (University of
Arizona, University of Washington, Pennsylvania State University, Desert
Research Institute and University of Bergen), published today in Nature
Geoscience, reveals that during past periods, glaciers and ice caps in
coastal west Greenland experienced climate conditions much different
than the interior of Greenland. Over the past 2,000 years, these ice
caps endured periods of warming during which they grew larger rather
than shrinking.
This novel study breaks down the climate history
displayed in a core taken from an ice cap off Greenland's western
coast. According to the study's researchers, while ice core drilling has
been ongoing in Greenland since the mid-20th century, coastal ice core
studies remain extremely limited, and these new findings are providing a
new perspective on climate change compared to what scientists
previously understood by using ice cores from the interior portions of
the Greenland ice sheet alone.
"Glaciers and ice caps are unique
high-resolution repositories of Earth's climate history, and ice core
analysis allows scientists to examine how environmental changes—like
shifts in precipitation patterns and global warming—affect rates of
snowfall, melting, and in turn influence ice cap growth and retreat,"
said Sarah Das, Associate Scientist of Geology and Geophysics at WHOI.
"Looking at differences in climate change recorded across several ice
core records allows us to compare and contrast the climate history and
ice response across different regions of the Arctic." However, during
the course of this study, it also became clear that many of these
coastal ice caps are now melting so substantially that these incredible
archives are in great peril of disappearing forever.
Due to the
challenging nature of studying and accessing these ice caps, this team
was the first to do such work, centering their study, which began in
2015, around a core collected from the Nuussuaq Peninsula in Greenland.
This single core offers insight into how coastal climate conditions and
ice cap changes covaried during the last 2,000 years, due to tracked
changes in its chemical composition and the amount of snowfall archived
year after year in the core. Through their analysis, investigators found
that during periods of past warming, ice caps were growing rather than
melting, contradicting what we see in the present day.
https://phys.org/news/2021-09-reversal-response-western-greenland-ice.html
___________________________
A recent reversal in the response of western Greenland’s ice caps to climate change
September 9, 2021
Research suggests some ice caps grew during past periods of warming
https://www.sciencedaily.com/releases/2021/09/210909162229.htm
___________________________
The Media Is Lying About Greenland and Climate Change
September 13, 2021
https://alethonews.com/2021/09/15/the-media-is-lying-about-greenland-and-climate-change/
___________________________
Greenland ice sheet loses 11 billion tons of water in one day amid historic heat
August 2, 2019
The rapid melt -- unlike levels ever seen before -- has alarmed scientists.
https://abcnews.go.com/Politics/amid-historic-heat-greenland-ice-sheet-loses-11/story?id=64737944
___________________________
Ancient leaves preserved under a mile of Greenland's ice hold lessons about climate change
March 16, 2021
Secret military bases and Danish freezers
The story of the ice core begins during the Cold War with a military mission dubbed Project Iceworm. Starting around 1959, the U.S. Army hauled hundreds of soldiers, heavy equipment and even a nuclear reactor across the ice sheet in northwest Greenland and dug a base of tunnels inside the ice. They called it Camp Century.
It was part of a secret plan to hide nuclear weapons from the Soviets. The public knew it as an Arctic research laboratory. Walter Cronkite even paid a visit and filed a report.
Camp Century didn't last long. The snow and ice began slowly crushing the buildings inside the tunnels below, forcing the military to abandon it in 1966. During its short life, however, scientists were able to extract the ice core and begin analyzing Greenland's climate history. As ice builds up year by year, it captures layers of volcanic ash and changes in precipitation over time, and it traps air bubbles that reveal the past composition of the atmosphere.
https://sciencex.com/news/2021-03-ancient-mile-greenland-ice-lessons.html
___________________________
When Greenland was green: rapid global warming 55 million years ago shows us what the future may hold (Debated)
August 23, 2021
https://theconversation.com/when-greenland-was-green-rapid-global-warming-55-million-years-ago-shows-us-what-the-future-may-hold-166342
___________________________
Northward
dispersal of dinosaurs from Gondwana to Greenland at the mid-Norian
(215–212 Ma, Late Triassic) dip in atmospheric pCO2
February 15, 2021
Significance
Abstract
The earliest dinosaurs (theropods and sauropodomorphs) are found in
fossiliferous early Late Triassic strata dated to about 230 million
years ago (Ma), mainly in northwestern Argentina and southern Brazil in
the Southern Hemisphere temperate belt of what was Gondwana in Pangea.
Sauropodomorphs, which are not known for the entire Triassic in then
tropical North America, eventually appear 15 million years later in the
Northern Hemisphere temperate belt of Laurasia. The Pangea
supercontinent was traversable in principle by terrestrial vertebrates,
so the main barrier to be surmounted for dispersal between hemispheres
was likely to be climatic; in particular, the intense aridity of
tropical desert belts and unstable climate in the equatorial humid belt
accompanying high atmospheric pCO2 that characterized
the Late Triassic. We revisited the chronostratigraphy of the
dinosaur-bearing Fleming Fjord Group of central East Greenland and, with
additional data, produced a correlation of a detailed
magnetostratigraphy from more than 325 m of composite section from two
field areas to the age-calibrated astrochronostratigraphic polarity time
scale. This age model places the earliest occurrence of sauropodomorphs
(Plateosaurus) in their northernmost range to ∼214 Ma. The
timing is within the 215 to 212 Ma (mid-Norian) window of a major,
robust dip in atmospheric pCO2 of uncertain origin but
which may have resulted in sufficiently lowered climate barriers that
facilitated the initial major dispersal of the herbivorous
sauropodomorphs to the temperate belt of the Northern Hemisphere.
Indications are that carnivorous theropods may have had dispersals that
were less subject to the same climate constraints.
https://www.pnas.org/doi/10.1073/pnas.2020778118
___________________________
Moon dust: Greenland's recipe for saving Planet Earth
October 14, 2021
Among
the glaciers and turquoise fjords of southwestern Greenland, a mining
company is betting rock similar to the one the Apollo missions brought
back from the moon can address some of Planet Earth's climate change
problems.
"This rock was created in the early days in the
formation of our planet," says geologist Anders Norby-Lie, who began
exploring anorthosite at the remote mountain landscape in Greenland nine
years ago.
More recently, it has excited mining companies and
investors hoping to sell it as a relatively sustainable source of
aluminium as well as an ingredient to make fibreglass.
The
government elected in April has placed it at the centre of its efforts
to promote Greenland as environmentally responsible and even the U.S.
space agency NASA has taken note.
The mineral-rich island has
become a hot prospect for miners seeking anything from copper and
titanium to platinum and rare earth minerals, which are needed for
electric vehicle motors.
That could appear an easy solution to
Greenland's challenge of how to grow its tiny economy so it can realise
its long-term goal of independence from Denmark, but the government
campaigned on an environmental platform and needs to honour that.
"Not
all money is worth earning," Greenland's mineral resources minister
Naaja Nathanielsen told Reuters in an interview in the capital Nuuk. "We
have a greener profile, and we've been willing to make some decisions
on it pretty quickly."
Already the government has banned future oil and gas exploration and wants to reinstate a ban on uranium mining.
That
would halt development of one of the world's biggest rare earth
deposits, named Kuannersuit in Greenlandic and Kvanefjeld in Danish
because the deposit also contains uranium.
Kuannersuit, whose
operator was in the final stages of securing a permit to mine, was a
flashpoint issue in April's election because locals fear the uranium it
contains could harm the country's fragile environment.
"As far as
we are concerned, uranium is a political issue which is being driven by
exaggerated and misleading claims," licence holder Greenland Minerals
(GGG.AX) CEO John Mair told Reuters.
The mine could bring in royalties of around 1.5 billion Danish crowns ($233 million) each year, the government has said.
By
contrast, revenue from two small mines operating in the country is
negligible, and Nathanielsen says the government's budget plans do not
assume any mining revenue.
https://www.reuters.com/business/sustainable-business/moon-dust-greenlands-recipe-saving-planet-earth-2021-10-14/
___________________________
Subpopulation of Greenland Polar Bears Found by NASA-Funded Study
June 23, 2022
https://climate.nasa.gov/news/3196/subpopulation-of-greenland-polar-bears-found-by-nasa-funded-study/
___________________________
Epic sea level rise drove Vikings out of Greenland (Debated)
December 16, 2021
https://www.livescience.com/agu-floods-drove-vikings-from-greenland
___________________________
Greenland Pummeled By Snow One Month After Its Summit Saw Rain For The First Time
September 12, 2021
https://www.npr.org/2021/09/12/1036452138/greenland-pummeled-by-snow-one-month-after-its-summit-saw-rain-for-the-first-tim
___________________________
Dust in the Wind Could Speed Greenland's Ice Melt
June 8, 2014
Despite
it’s name, Greenland is predominantly white, as snow and ice cover the
majority of the country. New research indicates that Greenland’s main
color may be starting to fade and in fact darken, though, thanks to a
widespread increase of dust across the ice sheets. That darkening could
speed up surface melt, and with it, sea level rise around the globe.
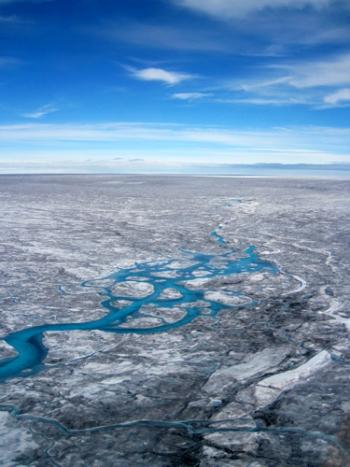
Meltwater channels run along the ice in Greenland. Soot, dust and microbes that live in the ice all contribute to its darkening.
https://www.climatecentral.org/news/dust-soot-greenland-ice-sheet-17533
___________________________
Greenland's Most Important Glacier is Growing Again, but Scientists Warn Change Is Likely Temporary
March 26, 2019
https://weather.com/news/climate/news/2019-03-25-greenland-jakobshavn-glacier-growing-climate-change
___________________________
CO2 Dip May Have Helped Dinosaurs Walk From South America to Greenland
February 15, 2021
https://news.climate.columbia.edu/2021/02/15/co2-dip-dinosaurs-greenland/
___________________________
Greenland's rapid melt will mean more flooding
December 11, 2019

The Greenland Ice Sheet, seen here in Oct. 2018, is melting at a rapidly accelerating rate because of Earth's warming climate. As the ice melts into the ocean, it raises the sea level around the world, causing flooding and other damage to coastal communities.
https://sealevel.nasa.gov/news/178/greenlands-rapid-melt-will-mean-more-flooding
___________________________
Is Greenland gaining or losing ice?
https://skepticalscience.com/greenland-cooling-gaining-ice.htm
___________________________
Is Iceland Really Green and Greenland Really Icy?
June 30, 2016
A longstanding rumor claims the names are a bait and switch.
https://www.nationalgeographic.com/science/article/iceland-greenland-name-swap
___________________________
NASA Discovers a New Mode of Ice Loss in Greenland
May 25, 2017
https://www.nasa.gov/feature/jpl/nasa-discovers-a-new-mode-of-ice-loss-in-greenland
___________________________
Climate crisis could still be affecting size of Greenland ice sheet in thousands of years
21 January 2022
After thousands of years of expansion, Greenland’s ice sheet has been retreating since the 1980s
https://www.independent.co.uk/climate-change/news/greenland-ice-sheet-melting-oceans-b1996539.html?_hsenc=p2ANqtz--VEfizwz1ZKzLutdKbVRxFTr9y8e15rkDFONKepusEiXZq1ONOIzMahls03YRq5t-FbPgs
___________________________
JM Cheers on Climate Scientist as She Traverses Greenland
June 30, 2022
https://www.rooferscoffeeshop.com/post/jm-cheers-on-climate-scientist-as-she-traverses-greenland
___________________________
Greenland Ice Cores show warmer climate 4000 years ago
2022
Greenland Ice Cores Show Temps Were Much Warmer 4,000 Years Ago
https://nexusnewsfeed.com/article/climate-ecology/greenland-ice-cores-show-warmer-climate-4000-years-ago/
___________________________
The hidden melting of the most important ice on Earth, explained
Feb 21, 2022
The future of sea level rise is being written underneath Antarctica and Greenland.
https://www.vox.com/22939545/antarctica-greenland-ice-sheet-shelf-glacier-melt-climate-sea-level-rise
___________________________
New climate models suggest faster melting of the Greenland Ice Sheet
15 December 2020
https://www.carbonbrief.org/new-climate-models-suggest-faster-melting-of-the-greenland-ice-sheet/
___________________________
Greenland ice core points to rapid climate change
https://cordis.europa.eu/article/id/29576-greenland-ice-core-points-to-rapid-climate-change
___________________________
Ice cores show pollution's impact on Arctic atmosphere
September 25, 2024
https://phys.org/news/2024-09-ice-cores-pollution-impact-arctic.html
___________________________
Fossils in a Forgotten Ice Core Rewrite Greenland’s Icy Past
Mar 20, 2021
A secret Cold War project led to signs of ancient life—and a new warning about the future of the climate.
https://www.wired.com/story/fossils-in-a-forgotten-ice-core-rewrite-greenlands-icy-past/
___________________________
Ancient Greenland Cave Sediments Contain a Climate Change Warning
3/24/21
https://gizmodo.com/ancient-greenland-cave-sediments-contain-a-climate-chan-1846544689
___________________________
Aerial photos show Greenland deltas growing due to climate change
October 5, 2017
https://www.zmescience.com/science/news-science/greenland-delta-climate-change-05102017/
___________________________
Massive impact crater beneath Greenland could explain Ice Age climate swing
November 14, 2018
The
serendipitous discovery may just be the best evidence yet of a
meteorite causing the mysterious, 1,000-year period known as Younger
Dryas.
https://www.astronomy.com/news/2018/11/massive-impact-crater-beneath-greenland-could-explain-ice-age-climate-swing
___________________________
A huge meteorite gouged a Greenland crater 58 million years ago, study finds
March 10, 2022

The site of field work at the edge of the Greenland Ice Sheet where scientists studied the age of the 19-mile-wide (31- kilometer-wide) Hiawatha impact crater that is buried under ice six-tenths of a mile (1 kilometer) thick is seen in 2019. (Pierre Beck / Handout via Reuters)
___________________________
Greenland ice sheet shrinks by record amount - climate study
Apr 15 2020
https://news.abs-cbn.com/overseas/04/15/20/greenland-ice-sheet-shrinks-by-record-amount-climate-study
___________________________
Medieval Warm Period
Some
consider the Medieval Warm Period, the Little Ice Age, and part of the
warming since the Little Ice Age (during the last century) to be the
most recent manifestations of the solar cycles.
https://www.sciencedirect.com/topics/earth-and-planetary-sciences/medieval-warm-period
___________________________
Climate Change Skeptic: Greenland More Proof There's No Global Warming
05 June 2015
https://www.newsmax.com/Newsfront/climate-change-greenland-global-warming/2015/06/05/id/649099/
___________________________
NASA Discovered Something Weird About the Earth’s Gravity
2022
https://www.youtube.com/watch?v=MzGjOMlTWbA
___________________________
It Will Totally Destroy Earth Even From 1000 Light Years Away
2022
In
2007, astronomers discovered that potent ultra-short radio signals were
attacking Earth from all sides. These fast radio bursts last only a
millisecond but carry as much energy as the Sun emits in three days!
Some
scientists linked those mysterious bursts to magnetars - the most
powerful and dangerous magnets in the Universe! Their impact on Earth
can be felt even thousands of light-years away. In this video, you’ll
find out: how a crack on a magnetar can cause a mass extinction on
Earth? Why is it necessary to fire a star cannon to form such an object?
And what will happen to us if we get close to a magnetar?
https://www.youtube.com/watch?v=dwaF8vHBhWc
___________________________
Why Did The Earth Totally Freeze For 100 Million Years?
2022
https://www.youtube.com/watch?v=vntVVcazJD4
___________________________
Climate scientists uncover new record-low temperature in Greenland
September 28, 2020
https://www.space.com/coldest-day-ever-northern-hemisphere.html
___________________________
Climate scientists uncover new record-low temperature in Greenland
September 28, 2020
https://www.space.com/coldest-day-ever-northern-hemisphere.html
___________________________
Stanford researchers reveal the long-term impacts of extreme melt on Greenland Ice Sheet
April 20, 2021
Researchers
have deciphered a trove of data that shows one season of extreme melt
can reduce the Greenland Ice Sheet’s capacity to store future meltwater –
and increase the likelihood of future melt raising sea levels.
https://news.stanford.edu/2021/04/20/can-extreme-melt-destabilize-ice-sheets/
___________________________
Why a massive Greenland glacier is melting from below
2015
To
better understand future sea level rise, NASA and university
researchers are working together to produce models of underwater glacier
valleys in Greenland.

Surface melt water rushes along the surface of the Greenland Ice Sheet through a supra glacial stream channel, Southwest of Ilulissat, Greenland, July 4, 2012.
https://www.csmonitor.com/Science/2015/1117/Why-a-massive-Greenland-glacier-is-melting-from-below
___________________________
Greenland’s melting ice sheet: a breakthrough in understanding?
2016
https://www.csmonitor.com/Science/2016/0113/Greenland-s-melting-ice-sheet-a-breakthrough-in-understanding
___________________________
Rapid basal melting of the Greenland Ice Sheet from surface meltwater drainage
February 22, 2022
Significance
Subglacial
drainage systems control ice sheet flow and the quantity of ice
discharged into the ocean. However, these systems are currently poorly
characterized, from a lack of direct observations. This shortcoming is
problematic, as changes in drainage systems can result in a markedly
differently ice sheet response. Here, we present a radar-derived record
of basal melt rates with colocated borehole observations, showing
unexpectedly warm subglacial conditions beneath a large outlet glacier
in West Greenland. The record is unprecedented because the observed
basal melt rates are several orders of magnitude higher than predictions
and previous estimates. Our observations show that the effect of
viscous dissipation from surface meltwater input is by far the largest
heat source beneath the Greenland Ice Sheet.
https://www.pnas.org/doi/10.1073/pnas.2116036119
___________________________
The fastest-melting Greenland glacier has made a temporary U-turn
Mar 26, 2019
https://www.axios.com/2019/03/26/fastest-melting-greenland-glacier-abruptly-slows-melt-rate
___________________________
Melting Ice In Greenland Could Expose Serious Pollutants From Buried Army Base
Aug 5, 2016
https://wamu.org/story/16/08/05/melting_ice_in_greenland_could_expose_serious_pollutants_from_buried_army_base/
___________________________
Flow
of hot rocks rising from the Earth's core beneath central Greenland is
melting the ice from below and contributing to sea-level rise, study
finds
8 December 2020
Experts from Japan mapped the plume of molten rock rising under Greenland
To do this, they analysed the speed of seismic waves travelling beneath the Earth
The plume rises from the core-mantle boundary to around a depth of 255 miles
It also has branched that feed geothermal activity in both Iceland and Jan Mayen
https://www.dailymail.co.uk/sciencetech/article-9029805/Geology-Hot-rock-rising-beneath-central-Greenland-melting-ice-below.html
___________________________
Science Torpedoes Reveal How Greenland Is Melting From Below
2016
Warm, salty currents from the Atlantic Ocean are causing Greenland's ice sheets to melt from the bottom up.
https://www.wired.com/2016/10/science-torpedoes-reveal-greenland-melting/
___________________________
Puzzling Heat from Deep Inside the Earth Is Melting Greenland's Glaciers
1/22/18
https://www.newsweek.com/puzzling-heat-deep-inside-earth-melting-greenlands-glaciers-786943
___________________________
Clouds, like blankets, trap heat and are melting the Greenland Ice Sheet
January 12, 2016
The
Greenland Ice Sheet is the second largest ice sheet in the world and
it’s melting rapidly, likely driving almost a third of global sea level
rise.
A new study shows clouds are playing a larger role in that process than scientists previously believed...
https://news.wisc.edu/clouds-like-blankets-trap-heat-and-are-melting-the-greenland-ice-sheet/
___________________________
Clouds played an important role in the history of climate
2022
Global models show the crucial influence of clouds on changes in Earth’s climate and on conditions for the evolution of life
Were
Earth’s oceans completely covered by ice during the Cryogenian period,
about 700 million years ago, or was there an ice-free belt of open water
around the equator where sponges and other forms of life could survive?
Using global climate models, a team of researchers from Karlsruhe
Institute of Technology (KIT) and the University of Vienna has shown
that a climate allowing a waterbelt is unlikely and thus cannot reliably
explain the survival of life during the Cryogenian. The reason is the
uncertain impact of clouds on the epoch’s climate. The team has
presented the results of its study in the journal Nature Geoscience
(DOI: 10.1038/s41561-022-00950-1)...
https://www.kit.edu/kit/english/pi_2022_053_clouds-played-an-important-role-in-the-history-of-climate.php
___________________________
Satellite gravity measurements confirm accelerated melting of Greenland ice sheet
2006 Aug 10
https://pubmed.ncbi.nlm.nih.gov/16902089/
___________________________
Greenland's ice sheets are melting away in nearly every sector of the island
Jan. 4, 2021
https://www.slashgear.com/greenlands-ice-sheets-are-melting-away-in-nearly-every-sector-of-the-island-04653313
___________________________
'A Tipping Point.' Greenland's Ice Is Melting Much Faster Than Previously Thought, Scientists Say
January 21, 2019
https://time.com/5509148/greenland-ice-melting-four-times-faster/
___________________________
Melt-induced speed-up of Greenland ice sheet offset by efficient subglacial drainage
2011
https://pubmed.ncbi.nlm.nih.gov/21270891/
___________________________
Greenland surface air temperature changes from 1981 to 2019 and implications for ice-sheet melt and mass-balance change
26 July 2020
https://rmets.onlinelibrary.wiley.com/doi/10.1002/joc.6771
___________________________
Scientists find another threat to Greenland's glaciers lurking beneath the ice
February 4, 2020
https://edition.cnn.com/2020/02/03/world/greenland-glaciers-melting-underwater/index.html
___________________________
Climate change and forest fires synergistically drive widespread melt events of the Greenland Ice Sheet
2014
https://www.ncbi.nlm.nih.gov/pmc/articles/PMC4050608/
___________________________
‘Heat Dome’ Linked To Greenland’s Biggest Melt In 30 Years
Jul 25, 2012
https://wamu.org/story/12/07/25/heat_dome_linked_to_greenlands_biggest_melt_in_30_years/
___________________________
The Effects of Melting Permafrost in Greenland
https://legacy.pulitzercenter.org/projects/effects-melting-permafrost-greenland
___________________________
New NASA Maps Have Very Bad News For Greenland
November 1, 2017

Nestled between the Arctic and Atlantic oceans is Greenland, a slab of ice and rock that has caused more controversy than one might expect from the least densely populated country in thew world. For a long time, the Mercator map misrepresented Greenland as a giant land mass almost as big as Africa, but a 1970s reassessment cut it down to size, showing that it’s actually only about one-fourteenth of the continent’s area.
https://www.inverse.com/article/38026-nasa-map-greenland-glacier-melt
___________________________
Climate Change is causing Greenland, Antarctica to melt 6 times faster than in the 1990s
March 18, 2020
https://indianexpress.com/article/technology/science/climate-change-melting-greenland-antarctica-ice-sheets-6-times-faster-6318700/
___________________________
Record melt: Greenland lost 586 billion tons of ice in 2019
August 21, 2020
https://technology.inquirer.net/103296/record-melt-greenland-lost-586-billion-tons-of-ice-in-2019
___________________________
Interruption of two decades of Jakobshavn Isbrae acceleration and thinning as regional ocean cools
25 March 2019
https://www.nature.com/articles/s41561-019-0329-3
___________________________
Melting Greenland Ice Cap Will Expose Military's Cold War-Era Toxic Waste
August 5, 2016
Study
finds that rapidly melting ice will unearth radioactive waste, toxic
PCBs, and raw sewage left behind by secret U.S. military base in the
1960s
https://www.commondreams.org/news/2016/08/05/melting-greenland-ice-cap-will-expose-militarys-cold-war-era-toxic-waste
___________________________
A 'frozen rainforest' of microscopic life is melting Greenland's ice sheet
2020
https://edition.cnn.com/2020/12/14/world/microscopic-life-melting-greenland-ice-sheet-c2e-spc-intl/index.html
___________________________
Greenland to halt all oil exploration as it 'takes climate change seriously'
16/07/2021
https://www.euronews.com/my-europe/2021/07/16/greenland-to-halt-all-oil-exploration-as-it-takes-climate-change-seriously
___________________________
Scientists Discover a Mega-Canyon Beneath the Melting Ice Sheets of Greenland
Aug. 30, 2013
Using
radar and radio, researchers uncovered a previously unknown canyon that
runs down the middle of the frozen continent of Greenland. It could
play a role in the dispersion of melting water from the ice sheet.
https://science.time.com/2013/08/30/scientists-discover-a-mega-canyon-beneath-the-melting-ice-sheets-of-greenland/
___________________________
India’s monsoon at risk from Greenland’s melting ice
02/09/09
https://www.scidev.net/global/news/india-s-monsoon-at-risk-from-greenland-s-melting-i/
___________________________
Qinngua Valley, Greenland’s Only Forest
Feb 25, 2019
https://www.amusingplanet.com/2019/02/qinngua-valley-greenlands-only-forest.html
___________________________
Has Arctic Sea Ice Loss Contributed to Increased Surface Melting of the Greenland Ice Sheet?
01 May 2016
https://journals.ametsoc.org/view/journals/clim/29/9/jcli-d-15-0391.1.xml
___________________________
West Greenland ichthyoplankton and how melting glaciers could allow Arctic cod larvae to survive extreme summer temperatures
14 November 2020
https://cdnsciencepub.com/doi/10.1139/AS-2020-0019
___________________________
Melt in the Greenland EastGRIP ice core reveals Holocene warm events
10 May 2022
https://cp.copernicus.org/articles/18/1011/2022/
___________________________
Mass transport waves amplified by intense Greenland melt and detected in solid Earth deformation
15 May 2017
https://agupubs.onlinelibrary.wiley.com/doi/full/10.1002/2017GL073478
___________________________
Bismuth in recent snow from Central Greenland: Preliminary results
1995
https://www.sciencedirect.com/science/article/abs/pii/1352231095000587
___________________________
What are Bismuth Crystals?
https://www.fleetscience.org/science-blog/bismuth-crystals
___________________________
Bathymetry of Southeast Greenland From Oceans Melting Greenland (OMG) Data
21 August 2019
https://agupubs.onlinelibrary.wiley.com/doi/10.1029/2019GL083953
___________________________
If “Greenland is catastrophically melting”, how do alarmists explain NASA’s growing Greenland glacier?
2019
https://wattsupwiththat.com/2019/06/19/if-greenland-is-catastrophically-melting-how-do-alarmists-explain-nasas-growing-greenland-glacier/
___________________________
Greenland Ice Melt Geothermal, Not Man-made
2014
http://www.plateclimatology.com/greenland-ice-melt-geothermal-not-man-made
___________________________
Algae growth reduces reflectivity, enhances Greenland ice sheet melting
20 December 2017
https://news.agu.org/press-release/algae-growth-reduces-reflectivity-enhances-greenland-ice-sheet-melting/
___________________________
Enough ice melted in Greenland on Tuesday to cover Florida in two inches of water, scientists warn
2021
The
impacts of human-caused climate change are especially pronounced in the
Arctic, which is warming three times faster than the global average.
https://news.sky.com/story/enough-ice-melted-in-greenland-on-tuesday-to-cover-florida-in-two-inches-of-water-scientists-warn-12367747
___________________________
Newly documented population of polar bears in Southeast Greenland sheds light on the species’ future in a warming Arctic
June 16, 2022
https://www.washington.edu/news/2022/06/16/se-greenland-polar-bears/
___________________________
Giant Prehistoric Crater in Greenland May Shed Light Upon Climate After Death of Dinosaurs
2022
https://sputniknews.com/20220314/giant-prehistoric-crater-in-greenland-may-shed-light-upon-climate-after-death-of-dinosaurs-1093847001.html
___________________________
Ancient clues in remote Greenland cave help gauge climate change
2022
How
can humanity understand and prepare for an uncertain future on a warmer
and wetter Earth? Researcher Gina Moseley, a Rolex Awards for
Enterprise Laureate, thinks she has the answer
https://www.timeslive.co.za/sunday-times/lifestyle/2022-04-29-ancient-clues-in-remote-greenland-cave-help-gauge-climate-change/
___________________________
Tracking the Cracks in Greenland's ice Sheet
2011
https://archive.nytimes.com/green.blogs.nytimes.com/2011/09/19/tracking-the-cracks-in-greenlands-ice-sheet/
___________________________
Time will tell if this is a record summer for Greenland ice melt, but the pattern over the past 20 years is clear
2019
http://science.anu.edu.au/news-events/news/time-will-tell-if-record-summer-greenland-ice-melt-pattern-over-past-20-years
___________________________
Roker ‘Thrilled’ By NBC’s Climate Unit, Hypes ‘Crisis’ in Greenland
September 16th, 2019
https://www.newsbusters.org/blogs/nb/kyle-drennen/2019/09/16/roker-thrilled-nbcs-climate-unit-hypes-crisis-greenland
___________________________
The role of an interactive Greenland ice sheet in the coupled climate-ice sheet model EC-Earth-PISM
2022
https://pubag.nal.usda.gov/catalog/7809608
___________________________
'Massive melting event' strikes Greenland after record heat wave
August 02, 2021

Ice receding from a glacier near
Kangerlussuaq, Greenland. This photo was taken during a helicopter tour
of the region with US Secretary of State Antony Blinken in May 2021.
https://www.livescience.com/greenland-massive-melting-event
___________________________
Greenland Is Melting, And A New Model Suggests We've Greatly Underestimated Its Impact
21 November 2020

https://www.sciencealert.com/the-see-could-rise-by-more-than-7-metres-if-greenland-just-keeps-melting
___________________________
Greenland stops oil and gas exploration, climate costs 'too high'
2021
Prospectors
for new oil and gas reserves in Greenland can forget it: The arctic
island government plans to stop issuing new licenses, saying it takes
the "climate crisis seriously."
https://www.dw.com/en/greenland-stops-oil-and-gas-exploration-climate-costs-too-high/a-58294024
___________________________
Greenland's ice is melting from the bottom up -- and far faster than previously thought, study shows
2022

Meltwater on the surface of the ice sheet falls through cracks to the base.
___________________________
How the melting Arctic could lead to huge riches—but also a world war
June 25, 2022
https://nypost.com/2022/06/25/how-the-melting-arctic-could-lead-to-huge-richesand-world-war/
___________________________
Early Archean serpentine mud volcanoes at Isua, Greenland, as a niche for early life.
2011
https://europepmc.org/article/PMC/3203773
___________________________
Is Antarctica Losing Ice or Gaining It?
November 5, 2015
Scientists are wary of new research showing more ice on frozen continent
https://www.scientificamerican.com/article/is-antarctica-losing-ice-or-gaining-it/
___________________________
Ice Gains In Some Parts Of Antarctica Aren't Offsetting Its Losses [Infographic]
2019
In
the past week or so I have been reading a few articles and social media
posts on the subject of Antarctica gaining ice mass. The articles are
talking about information from a study released by NASA in 2015 showing
that snowfall on the Eastern part of the continent is more than enough
to offset the melting of glaciers in the West. The social media posts
have been talking about how this proves that climate change was a hoax
all along. After all, how can sea levels be rising from glaciers melting
if Antarctica is gaining mass year after year? I took some time to
research the issue and read the actual study and today I thought I would
take some time and write a few paragraphs to help set the record
straight on this topic.
The study in question
In 2015 a
study was published by NASA, the lead author was Jay Zwally, a
glaciologist with NASA Goddard Space Flight Center. The study showed
evidence that Antarctica had experienced a net gain of 112 billion tons
of ice annually between 1992 and 2001 and a gain of 82 billion tons
annually between 2003 and 2008. This information was not at all in line
with previous findings on the subject which insisted that Antarctica has
been losing ice mass because of global warming.
These new
findings were based on data that came from studying changes in the
surface height of the Antarctic ice sheet using radar altimeters. The
data was collected using two European Space Agency European Remote
Sensing satellites and NASA’s Ice, Cloud, and land Elevation Satellite.
Basically,
the study shows that gains in snowfall in East Antarctica are more than
enough to offset the losses from melting glaciers on the West side of
the continent. These gains were not just in recent years but had been
the result of increased snowfall over the past 10,000 years or since the
last ice age. The study goes on to say that sea levels cannot be rising
because of glaciers melting in Antarctica because its actually gaining
ice.
Issues with the study
This information came as a bit
of a shock. After all the International Panel on Climate Change had been
releasing reports for a long time stating that Antarctica has been
losing mass and causing sea levels to rise. With this study saying the
opposite it’s clear that somebody had to be wrong. With that in mind,
the scientific community was cautious with this new information.
Since
2015 scientists have had a chance to look over the data and have had
time to do a few follow-up studies and the results are clear.
It
is agreed among scientists studying the situation that the Eastern area
is gaining a lot of ice due to thousands of years of continued snowfall.
However, measuring the size of that gain can be difficult at best. The
major issues with Zwally’s study are that it used altimeter data from
satellites, which is subject to systematic errors such as snowpack
penetration and telling the difference between snow that is on the
ground and snow that is still falling. Also, in order to calibrate their
measurements, Zwally’s team bounced lasers of the Southern Ocean which
may not have been reliable...
https://www.forbes.com/sites/kevinanderton/2019/02/21/ice-gains-in-some-parts-of-antarctica-arent-offsetting-its-losses-infographic/?sh=5dfca5cc7030
___________________________
Synchronous Retreat of Southeast Greenland's Peripheral Glaciers
2022
https://agupubs.onlinelibrary.wiley.com/doi/epdf/10.1029/2022GL097756
___________________________
Climate change: For 25th year in a row, Greenland ice sheet shrinks
7 January 2022
https://news.un.org/en/story/2022/01/1109352
___________________________
New observations from ICESat-2 show remarkable Arctic sea ice thinning in just three years
10 March 2022
https://news.agu.org/press-release/new-observations-from-icesat-2-show-remarkable-arctic-sea-ice-thinning-in-just-three-years/
___________________________
Surprising sea ice thickness across the Arctic is good news for polar bears
May 27, 2021
This year near the end of May the distribution of thickest sea ice
(3.5-5m/11.5-16.4 ft – or more) is a bit surprising, given that the WMO has suggested we may be only five years away from a “dangerous tipping point”
in global temperatures. There is the usual and expected band of thick
ice in the Arctic Ocean across northern Greenland and Canada’s most
northern islands but there are also some patches in the peripheral seas
(especially north of Svalbard, southeast Greenland, Foxe Basin, Hudson
Strait, Chukchi Sea, Laptev Sea). This is plenty of sea ice for polar
bear hunting at this time of year (mating season is pretty much over)
and that thick ice will provide summer habitat for bears that choose to
stay on the ice during the low-ice season: not even close to an emergency for polar bears.
___________________________
Polar Bears Are Mating with Grizzly Bears in Alaska, Creating ‘Pizzly Bears’
April 14, 2021
https://outsider.com/outdoors/polar-bears-mating-grizzly-bears-alaska-creating-pizzly-bears/
___________________________
Prehistoric horses, bison shared diet
2021
Tooth wear offers clues to how diversity of Ice Age mammals coexisted in arctic Alaska
https://www.uc.edu/news/articles/2021/05/why-did-prehistoric-bison-outlast-wild-horses-in-arctic.html
___________________________
Late Pleistocene horse DNA uncovers two-way migrations and climate-linked population declines
May 15, 2025
https://phys.org/news/2025-05-late-pleistocene-horse-dna-uncovers.html
___________________________
Scientists have accidentally discovered a new island in the Arctic
29/08/2021
https://www.euronews.com/2021/08/29/scientists-have-accidentally-discovered-a-new-island-in-the-arctic
___________________________
Eye on the Arctic
https://www.rcinet.ca/eye-on-the-arctic/
___________________________
The Ukraine War Is Dividing Europe’s Arctic Indigenous People
June 27, 2022
It has driven a wedge between Sámi in Russia and those in Nordic countries.
https://foreignpolicy.com/2022/06/27/russia-ukraine-war-saami-indigenous-arctic-people-norway-sweden-finland/
___________________________
New Methane Discharge Discovered in Russia's Arctic – Guardian
Sep. 7, 2021
A
new source of methane discharge has been discovered in the Arctic Ocean
near eastern Siberia, raising concerns of a “new tipping point” that
could speed up the pace of global warming, The Guardian reported
Tuesday.
Scientists found the potent greenhouse gas bubbling
from a depth of 350 meters in the Laptev Sea, with surface-level
concentrations that vent into the atmosphere between four and eight
times the normal amount. One of the six monitoring points showed methane
concentrations 400 times higher than expected under the normal air-sea
equilibrium.
https://www.themoscowtimes.com/2020/10/28/new-methane-discharge-discovered-in-russias-arctic-guardian-a71877
___________________________
Arctic ice shrinks to 2nd lowest level on record
22.09.2020
US
scientists say the world is heading towards a "seasonally ice-free
Arctic Ocean." Germany's research ship Polarstern is on its way home
after even reaching the North Pole through open water patches.
https://www.dw.com/en/arctic-ice-shrinks-to-2nd-lowest-level-on-record/a-55011894
___________________________
Rewilding the Arctic could stop permafrost thaw and reduce climate change risks
27 Jan 2020
https://www.ox.ac.uk/news/2020-01-27-rewilding-arctic-could-stop-permafrost-thaw-and-reduce-climate-change-risks
___________________________
Spring 2020 arctic “ozone hole” likely caused by record-high north pacific sea surface temperatures
20-Sep-2021
https://www.eurekalert.org/news-releases/928901
___________________________
2020 Arctic heat record 'more befitting the Mediterranean,' UN says
2021
https://www.ctvnews.ca/climate-and-environment/2020-arctic-heat-record-more-befitting-the-mediterranean-un-says-1.5706341
___________________________
Why Arctic sea ice has stalled, and what it means for the rest of the world
November 8, 2020
https://earthsky.org/earth/why-arctic-winter-sea-ice-stalled-2020/
___________________________
Arctic Sea ice melts to second-place finish at annual minimum
21 September 2020
https://news.mongabay.com/2020/09/arctic-sea-ice-melts-to-second-place-finish-at-annual-minimum/
___________________________
New global archive logs changes in behavior of Arctic animals
November 5, 2020
https://www.washington.edu/news/2020/11/05/new-global-archive-logs-changes-in-behavior-of-arctic-animals/
___________________________
100.4-Degree Temperature in Siberia in 2020 Is Highest Ever in Arctic: U.N. Weather Agency
12/14/21
https://www.newsweek.com/1004-degree-temperature-siberia-2020-highest-ever-arctic-un-weather-agency-1659400
___________________________
How A Warming Arctic Will Change New England Weather
September 14, 2020
https://www.wbur.org/news/2020/09/14/warming-arctic-weather-q-and-a
___________________________
'Solastalgia': Arctic inhabitants overwhelmed by new form of climate grief
2020
https://www.theguardian.com/us-news/2020/oct/15/arctic-solastalgia-climate-crisis-inuit-indigenous
___________________________
Shift to a Not-So-Frozen North Is Well Underway, Scientists Warn
2020
“There
is no reason to think that in 30 years much of anything will be as it
is today,” one of the editors of a new report on the Arctic climate
said.
https://www.nytimes.com/2020/12/08/climate/arctic-climate-change.html
___________________________
Russia's New Arctic Project Will Be Biggest in Global Oil – Rosneft
Feb. 14, 2020
The project will require over $150 billion in investments and will create 100,000 new jobs, Sechin told Putin.
https://www.themoscowtimes.com/2020/02/14/russias-new-arctic-project-will-be-biggest-in-global-oil-rosneft-a69294
___________________________
MIT oceanographers have an explanation for the Arctic’s puzzling ocean turbulence
December 15, 2020
New study suggests waters will become more turbulent as Arctic loses summertime ice.
https://news.mit.edu/2020/arctics-eddies-ocean-turbulence-1215
___________________________
The moon controls the release of methane in Arctic Ocean
December 14, 2020
Summary:
The moon controls one of the most formidable forces in nature - the
tides that shape our coastlines. Tides, in turn, significantly affect
the intensity of methane emissions from the Arctic Ocean seafloor. High
tides may even counter the potential threat of submarine methane release
from the warming Arctic.
https://www.sciencedaily.com/releases/2020/12/201214104716.htm
___________________________
Why are some rocks on the moon highly magnetic? Scientists may have an answer
May 23, 2025
https://phys.org/news/2025-05-moon-highly-magnetic-scientists.html
___________________________
Arctic heat wave "essentially impossible" without human-caused climate change, study finds
July 15, 2020
https://www.cbsnews.com/news/arctic-heat-wave-human-caused-climate-change/
___________________________
What's a 'zombie fire'? Dangerous underground fires spark record-setting wildfires in Arctic Circle
2020
https://www.usatoday.com/story/news/nation/2020/09/08/zombie-fires-underground-fires-spark-wildfires-arctic-circle/5744379002/
___________________________
Arctic wildfires have emitted 35% more CO2 so far in 2020 than the whole of last year
August 31, 2020
The peak number of active fire observations was approximately 600 in late July, compared with 400 in 2019
https://inews.co.uk/news/environment/arctic-wildfires-2020-co2-emissions-whole-2019-last-year-614180
___________________________
UN weather agency affirms 2020 Arctic heat record in Siberia
December 14, 2021
The
U.N. weather agency has certified a 38-degree Celsius (100.4
Fahrenheit) reading in the Russian town of Verkhoyansk last year as the
highest temperature ever recorded in the Arctic
https://abcnews.go.com/US/wireStory/weather-agency-affirms-2020-arctic-heat-record-siberia-81740726
___________________________
Study suggests great earthquakes cause of Arctic warming
December 23, 2020
https://phys.org/news/2020-12-great-earthquakes-arctic.html
___________________________
The Arctic is burning in a whole new way
September 28, 2020
"Zombie
fires" and burning of fire-resistant vegetation are new features
driving Arctic fires—with strong consequences for the global
climate—warn international fire scientists in a commentary published in
Nature Geoscience.
The 2020 Arctic wildfire season began two months early and was unprecedented in scope.
"It's
not just the amount of burned area that is alarming," said Dr. Merritt
Turetsky, a coauthor of the study who is a fire and permafrost ecologist
at the University of Colorado Boulder. "There are other trends we
noticed in the satellite data that tell us how the Arctic fire regime is
changing and what this spells for our climate future."
The
scientists contend that input and expertise of Indigenous and other
local and communities is essential to understanding and managing this
global issue.
The commentary identifies two new features of
recent Arctic fires. The first is the prevalence of holdover fires, also
called zombie fires. Fire from a previous growing season can smolder in
carbon-rich peat underground over the winter, then re-ignite on the
surface as soon as the weather warms in spring.
"We know little
about the consequences of holdover fires in the Arctic," noted Turetsky,
"except that they represent momentum in the climate system and can mean
that severe fires in one year set the stage for more burning the next
summer."
The second feature is the new occurrence of fire in
fire-resistant landscapes. As tundra in the far north becomes hotter and
drier under the influence of a warmer climate, vegetation types not
typically thought of as fuels are starting to catch fire: dwarf shrubs,
sedges, grass, moss, even surface peats. Wet landscapes like bogs, fens,
and marshes are also becoming vulnerable to burning.
The team
has been tracking fire activity in the Russian Arctic in real time using
a variety of satellite and remote sensing tools. While wildfires on
permafrost in Siberia south of the Arctic are not uncommon, the team
found that 2019 and 2020 stood out as extreme in the satellite record
for burning that occurred well above the Arctic Circle, a region not
normally known to support large wildfires.
As a result, said lead
author Dr. Jessica McCarty, a geographer and fire scientist at Miami
University, "Arctic fires are burning earlier and farther north, in
landscapes previously thought to be fire resistant."
The
consequences of this new fire regime could be significant for the Arctic
landscape and peoples and for the global climate. More than half of the
fires detected in Siberia this year were north of the Arctic Circle on
permafrost with a high percentage of ground ice. This type of permafrost
locks in enormous amounts of carbon from ancient biomass. Climate
models don't account for the rapid thaw of these environments and
resulting release of greenhouse gases, including methane.
On a
more local level, abrupt thawing of ice-rich permafrost in wildfires
causes subsidence, floods, pits and craters, and can submerge large
areas under lakes and wetlands. As well as disrupting the lives and
livelihoods of Arctic residents, these features are associated with more
greenhouse gases moving from where they are trapped in soils into the
atmosphere.
These extensive changes have severe consequences for global climate.
https://phys.org/news/2020-09-arctic.html
___________________________
Zombie fires in the Arctic smolder underground and refuse to die—what's causing them?
May 29, 2024
https://phys.org/news/2024-05-zombie-arctic-smolder-underground-die.html
___________________________
UK peatland fires are supercharging carbon emissions as climate change causes hotter, drier summers
21 Feb 2025
___________________________
Ghost Lights: Why do Will o’ the Wisps Appear Around the World?
February 10, 2022
Scientific Theories
Marsh Gas After All
https://www.historicmysteries.com/unexplained-mysteries/will-o-the-wisp/23362/
___________________________
Marsh gas
Marsh gas, also known as swamp gas or bog gas, is a mixture primarily of methane and smaller amounts of hydrogen sulfide, carbon dioxide, and trace phosphine that is produced naturally within some geographical marshes, swamps, and bogs.
The surface of marshes, swamps, and bogs is initially porous vegetation that rots to form a crust that prevents oxygen from reaching the organic material trapped below. That is the condition that allows anaerobic digestion and fermentation of any plant or animal matter, which then produces methane.
The trapped methane can escape through any of three main pathways: by the diffusion of methane molecules across an air–water interface, by bubbling out of water in a process known as ebullition, or through plant-mediated transport
https://en.wikipedia.org/wiki/Marsh_gas
___________________________
METHANE/NATURAL GAS (MARSH GAS)
October 1, 1991
https://www.fireengineering.com/firefighting/methane-natural-gas-marsh-gas/
___________________________
Hydrogen Sulfide Gas (H²S)
2024-12-20
https://www.nwcg.gov/6mfs/firefighter-health-first-aid/hydrogen-sulfide-gas-h2s
___________________________
Firedamp
Firedamp is any flammable gas found in coal mines, typically coalbed methane.[1] It is particularly found in areas where the coal is bituminous. The gas accumulates in pockets in the coal and adjacent strata and, when they are penetrated, the release of the gas can cause explosions. Historically, if such a pocket was highly pressurized, it was termed a "bag of foulness".
https://en.wikipedia.org/wiki/Firedamp
___________________________
Swamps and Wildfires: A Dangerous Combination
"Know your enemy" is a perfect motto for wildland firefighters. The brave souls who've chosen this line of work understand its many dangers. Forest fires are not their only source of trouble: One of the biggest challenges these men and women can face is an out-of-control peatland swamp fire. Don't let the standing water fool you: Bogs and swamps are fertile terrain for a tenacious, sneaky kind of inferno that smolders underground and might spend years lurking beneath the surface.
___________________________
Reduction of iron-organic carbon associations shifts net greenhouse gas release after initial permafrost thaw
April 2025
https://www.sciencedirect.com/science/article/pii/S0038071725000276
___________________________
Rising Temperatures May Dry Up Peat Bogs, Causing Carbon Release
2008
https://www.nytimes.com/2008/10/14/science/14obpeat.html
___________________________
Northern Bogs May Have Helped Kick-start Past Global Warming
October 13, 2006
https://www.sciencedaily.com/releases/2006/10/061012183530.htm
___________________________
Peatlands: New documentary to explore the secret life of bogs
21 January 2024
https://www.bbc.com/news/uk-northern-ireland-68029982
___________________________
The importance of bog land restoration in NI highlighted
May 30, 2025
https://www.agriland.ie/farming-news/the-importance-of-bog-land-restoration-in-ni-highlighted/
___________________________
Early spring rain boosts methane from thawing permafrost by 30 percent
February 4, 2019
Arctic permafrost is thawing as the Earth warms due to climate change. In some cases, scientists predict that this thawing soil will release increasing amounts of methane, a potent greenhouse gas, that is known to trap more heat in our planet’s atmosphere.
Now a University of Washington-led team has found a new reason behind increased methane emissions from a thawing permafrost bog in Alaska: Early spring rainfall warms up the bog and promotes the growth of plants and methane-producing microbes. The team showed that early precipitation in 2016 warmed the bog about three weeks earlier than usual, and increased the bog’s methane emissions by 30 percent compared to previous years. These results were recently published in Geophysical Research Letters.
“In general, the chance of generating methane goes up with increased rainfall because soils get waterlogged. But what we see here is different,” said corresponding author Rebecca Neumann, an associate professor in the UW Department of Civil & Environmental Engineering. “Early rainfall sent a slog of warm water moving into our bog. We believe microbes in the bog got excited because they were warmed up, so they released nutrients from the soil that allowed more plant growth. Methane production and emission are tightly linked with soil temperature and plant growth.
“Our results emphasize that these permafrost regions are sensitive to the thermal effects of rain, and because we’re anticipating that these environments are going to get wetter in the future, we could be seeing increases in methane emissions that we weren’t expecting...”
https://www.washington.edu/news/2019/02/04/early-rainfall-increases-methane-from-thaw-bog/
___________________________
Importance of peat bogs as CO2 storage
2020
https://wilderness-society.org/importance-of-peat-bogs-as-co2-storage/
___________________________
Rapid Net Carbon Loss From a Whole‐Ecosystem Warmed Peatland
2020
Abstract
To evaluate boreal peatland C losses from warming, novel technologies were used to expose
intact bog plots in northern Minnesota to a range of future temperatures (+0°C to +9°C) with and without elevated CO2 (eCO2 ). After 3 years, warming linearly increased net C loss at a rate of 31.3 gC·m−2 ·year−1 ·°C−1 . Increasing losses were associated with increased decomposition and corroborated by measures of declining peat elevation. Effects of eCO2 were minor. Results indicate a range of C losses from boreal peatlands 4.5 to 18 times faster than historical rates of accumulation, with substantial emissions of CO 2 and CH 4 to the atmosphere. A model of peatland C cycle captured the temperature response dominated by peat decomposition under ambient CO2 , but improvements will be needed to predict the lack of observable responses to elevated CO2 concentrations thus far.
Plain Language Summary
Northern bogs and fens have accumulated carbon in deep deposits of
peat—dead and decaying plant material high in carbon content—for millennia under wet, cold, and acidic conditions. We experimentally warmed and added CO2 to a series of bog plots in northern Minnesota to investigate whether warming and drying would lead to the increased decomposition and loss of carbon from bogs to the atmosphere, where it would contribute further to warming. We found that warming changed the nature of these bogs from carbon accumulators to carbon emitters—where carbon was increasingly lost to the atmosphere in the form of greenhouse gases CO2 and CH 4 as the level of warming increased. This carbon loss was faster than historical rates of carbon accumulation, demonstrating the significant impact of global warming on naturally stored carbon. Improved peatland ecosystem models are capable of capturing the temperature responses but overpredict responses to the elevated CO2 treatments.
https://www.fs.usda.gov/nrs/pubs/jrnl/2020/nrs_2020_hanson_001.pdf
___________________________
Bogs hold a key to climate solutions through carbon sequestration, but many have been drained
Feb 15, 2025
In Illinois alone, more than 90 percent of wetlands have been lost.
Peat bogs sequester a massive amount of the Earth’s carbon dioxide. But even as scientists work to better understand bogs’ sequestration, the wetlands are under threat.
On a cold winter afternoon, naturalist and educator Mary Colwell guided visitors on a chilly tour of the Volo Bog Natural Area in northern Illinois.
Crouching down from a boardwalk that runs through the wetland, Colwell pointed to one of the stars of the tour: sphagnum moss. With her encouragement, the group touched the little branch-like leaves of the pale green moss growing at the base of a nearby tree.
“Then in warmer weather, this is so soft,” Colwell said. “It’s unreal.”
Bog ecosystems are some of the most efficient carbon-storage ecosystems in the world. They cover just 3 percent of the earth’s surface, yet hold up to 30 percent of global carbon...
___________________________
Massive Carbon Sink May Be More Resilient Than Scientists Thought
Oct 30, 2017
___________________________
Climate Change: Potentially Good News on Methane and Peat Carbon
Scientists studying large, ancient carbon deposits in northern peat bogs to see if climate change might push them to emit methane, have discovered that they might not. The surprising result of a new study may be an early indicator that there is one less potentially large source of a powerful greenhouse gas in Earth’s future.
The researchers’ findings are early results from a long-range experiment and will need to stand the test of time and further study.
Scientists from Florida State University, the University of Oregon, the Georgia Institute of Technology, Oak Ridge National Laboratory and the USDA Forest Service Northwest Station published a paper with the findings on Tuesday, December 13, 2016, in the journal Nature Communications.
Nightmarish hypothesis
As global warming progresses, a hypothesis has held that methane may rise into the atmosphere from ancient layers of dead peat in cold, northern bogs to make climate change even worse.
These underground carbon stores have built up for some 10,000 years, and hold about 30 percent of Earth’s total 1,500 billion tons of organic soil carbon. That total is as much carbon as is currently in Earth’s atmosphere.
Scientists have feared climate change may lead microbes to digest the carbon stores and belch out carbon dioxide, and also methane, a particularly potent greenhouse gas that traps about 45 times as much heat as carbon dioxide. That would significantly exacerbate global warming.
But these latest results appear to allay those fears, should the findings hold up over time.
Ecological conditions in boreal peat bogs have helped create these underground carbon stores by allowing peat moss, or Sphagnum, and other plants to absorb more greenhouse gasses from the atmosphere than the rest of the bog ecosystem emits. But that could change, if rising temperatures boost greenhouse gas emissions, and the bogs could switch from sinks to sources or lesser sinks.
Quiet microbes
Kostka, a professor at Georgia Tech’s School of Biological Sciences and School of Earth and Atmospheric Sciences, and postdoctoral assistant Max Kolton also heated samples to check for corresponding activity by microbes called methanogens that are known to produce methane under anaerobic conditions. The results will be submitted for future publication, but they add interesting depth to the current published results.
“We took ancient peat out from different depths, incubated it in the lab, and at one to two meters’ depth, we saw very few changes in microbial activity and little methane coming out,” Kostka said. That concurred with the profiling of methanogen DNA in samples taken on site at SPRUCE in the deep peat, results that were published in the current paper.
But what makes the solid carbon in deep peat in boreal wetlands apparently so stable? Kostka and SPRUCE colleagues are researching to find out.
“Is it mainly because it’s wet, and therefore there’s not much oxygen in the soil? Is it because it’s acidic?” Kostka asked. “Is it because it’s cold? Or is it, in large part, because of organic matter recalcitrance, meaning the type of carbon that is produced by the peat moss actually poisons microbial activity? Right now our hypothesis is it’s the last one.”
https://news.gatech.edu/news/2016/12/13/climate-change-potentially-good-news-methane-and-peat-carbon
___________________________
Hidden Source of Carbon Found at the Arctic Coast
Mar 20, 2020
AUSTIN, Texas — A previously unknown significant source of carbon just discovered in the Arctic has scientists marveling at a once overlooked contributor to local coastal ecosystems – and concerned about what it may mean in an era of climate change.
In a Nature Communications paper released today, aquatic chemists and hydrologists from The University of Texas at Austin’s Marine Science Institute and Jackson School of Geosciences, U.S. Fish and Wildlife Service and Florida State University present evidence of significant, undetected concentrations and fluxes of dissolved organic matter entering Arctic coastal waters, with the source being groundwater flow atop of frozen permafrost. This water moves from land to sea unseen, but researchers now believe it carries significant concentrations of carbon and other nutrients to Arctic coastal food webs.
Groundwater is known globally to be important for delivering carbon and other nutrients to oceans, but in the Arctic, where much water remains trapped in frozen earth, its role has been less clear. Scientists were surprised to learn that groundwater may be contributing an amount of dissolved organic matter to the Alaskan Beaufort Sea that is almost on a par with what comes from neighboring rivers during the summer.
“We have to start thinking differently about groundwater,” said senior author Jim McClelland, professor of marine sciences at UT Austin. “The water that flows from rivers to the Arctic Ocean is pretty well accounted for, but until now the groundwater flowing to this ocean hasn’t been.”
The research community has generally assumed that groundwater inputs from land to sea are small in the Arctic because perennially frozen ground, or permafrost, constrains the flow of water below the tundra surface...
https://news.utexas.edu/2020/03/20/hidden-source-of-carbon-found-at-the-arctic-coast/
___________________________
2020 Arctic air temperatures continue a long-term warming streak
December 8, 2020
https://www.climate.gov/news-features/featured-images/2020-arctic-air-temperatures-continue-long-term-warming-streak
___________________________
Exceptional ozone hole over the Arctic in 2020
2020-04-22
https://www.aeronomie.be/en/news/2020/exceptional-ozone-hole-over-arctic-2020
___________________________
Canada's Volcanoes: The Cradle of Life | Full Documentary | TRACKS
Jan 12, 2022
https://www.youtube.com/watch?v=JJQ1B5I0GMk
___________________________
TRAGIC STORY OF SALOMON ANDREE: How the First Arctic BALLOON Expedition Ended // North Pole 1897
Apr 4, 2022
https://www.youtube.com/watch?v=eYHXLlkhMho&t=4s
___________________________
Research shows need to improve prediction of Arctic melt ponds
July 1, 2022
https://phys.org/news/2022-07-arctic-ponds.html
___________________________
Heavy metals in aerosols over the seas of the Russian Arctic
June 2003
Abstract
A review of the data on heavy metals in aerosols over the seas of the
Russian Arctic is presented. Results of heavy metal studies in aerosols
obtained during 11 research expeditions in summer/autumn period from
1991 to 2000, and at Severnaya Zemlya and Wrangel Island in spring, in
1985-1989 are discussed. Concentrations of most heavy metals in the
atmosphere in the marine boundary layer in the Russian Arctic are nearly
of the same order as literature data from other Arctic areas. The
content of heavy metals in the aerosols over the seas of the Russian
Arctic shows an annual variation with maximal concentrations during the
winter/spring season. In the summer/autumn period increased
concentrations of heavy metals could be explained, in most cases, by
natural processes (generation of sea salt aerosols, etc.). In some
cases, aerosols from Norilsk and Kola Peninsula were detected.
Particular attention was paid to estimation of horizontal and vertical
fluxes of atmospheric heavy metals. We estimated annual variations in
long-range transport of heavy metals into the Russian Arctic in
1986-1995. In winter and spring, up to 50% of the average air pollutant
concentrations in the Russian Arctic are due to the Arctic atmospheric
pollution itself. Moreover, the monthly and annual averaged fluxes of
six anthropogenic chemical elements (arsenic, nickel, lead, vanadium,
zinc and cadmium) onto the surface in the Arctic were estimated, and the
values obtained were in reasonable agreement with the literature data
available.
https://www.researchgate.net/publication/10800584_Heavy_metals_in_aerosols_over_the_seas_of_the_Russian_Arctic
___________________________
Atmosphere–ocean exchange of heavy metals and polycyclic aromatic hydrocarbons in the Russian Arctic Ocean
18 Nov 2019
https://acp.copernicus.org/articles/19/13789/2019/
___________________________
Ebullition and storm-induced methane release from the East Siberian Arctic Shelf
24 November 2013
https://www.nature.com/articles/ngeo2007
___________________________
East Siberian Arctic background and black carbon polluted aerosols at HMO Tiksi
2019
https://repository.library.noaa.gov/view/noaa/33255
___________________________
Metal accumulation in tissues of seabirds from Chaun, northeast Siberia, Russia
1996
https://www.sciencedirect.com/science/article/abs/pii/0269749196000073
___________________________
The Arctic Ports of Russia
https://www.worldatlas.com/articles/the-arctic-ports-of-russia.html
___________________________
Exploring The Treasures Of Russia: The Seven Wonders Of Russia
https://www.worldatlas.com/articles/exploring-the-treasures-of-russia-the-seven-wonders-of-russia.html
___________________________
Exploring Serbia: The Seven Serbian Wonders of Nature
https://www.worldatlas.com/articles/exploring-serbia-the-seven-serbian-wonders-of-nature.html
___________________________
PCBs, PBDEs and pesticides released to the Arctic Ocean by the Russian Rivers Ob and Yenisei
February 2008
https://www.researchgate.net/publication/5501312_PCBs_PBDEs_and_pesticides_released_to_the_Arctic_Ocean_by_the_Russian_Rivers_Ob_and_Yenisei
___________________________
The looming Arctic collapse: more than 40% of north Russian buildings are starting to crumble
June 28, 2021
Previously solid ground is quickly degrading. The melting of the permafrost is about to cause huge damage to buildings and infrastructure across the country, Russia's natural resource minister warns.
https://thebarentsobserver.com/en/climate-crisis/2021/06/looming-arctic-collapse-more-40-north-russian-buildings-are-starting-crumble
___________________________
239,240Pu transport into the Arctic Ocean from underwater nuclear tests in Chernaya Bay, Novaya Zemlya
March 2000
Radionuclide measurements have been conducted on sediment, seawater and
biota samples collected in Chernaya Bay, on the southern coast of Novaya
Zemlya, the site of two underwater nuclear tests conducted in the
1950s. 239,240Pu levels in sediments from the central region
of Chernaya Bay exceed concentrations of 15,000 Bq/kg, and are among the
highest ever reported for the marine environment. It is estimated that
approximately 11 TBq of 239,240Pu from the tests has been retained in the sediments of Chernaya Bay. Plutonium from Chernaya Bay is distinguished by 240Pu/ 239Pu atom ratios of 0.03 that are much lower than ratios of 0.18 typical of global fallout. High levels of 137Cs (Bq/kg) and 60Co
(Bq/kg) were also measured in surface sediments in the central regions
of Chernaya Bay near the presumed epicentre of the explosions.
Applications of a biodiffusion model to excess 210Pb sediment depth profiles indicate that the distribution of 239,240Pu is governed mainly by sediment mixing in this low sedimentation rate (<0.1 cm/yr) regime and, as a result, most of the 239,240Pu has been retained in the upper 20 cm of the sediment column. Elevated levels of 239,240Pu measured in Macoma (104 Bq/kg), Fucus (15 Bq/kg) and polychaete (1292 Bq/kg) from Chernaya Bay, indicate that 239,240Pu levels in the benthos are comparatively high and that significant uptake has occurred in the food chain. Although levels of 239,240Pu in bottom water from Chernaya Bay are high (4.2 Bq/m 3), restricted exchange over the fjord sill limits the present rates of 239,240Pu transport from contaminated sites in Chernaya Bay into the eastern Barents Sea. However, low 240Pu/ 239Pu
atom ratios measured in sediment cores collected throughout the eastern
Barents Sea indicate that significant offshore transport of plutonium
from Chernaya Bay has occurred in the past, probably at the time of the
original nuclear tests. The large difference in end member 240Pu/ 239Pu atom ratios for Chernaya Bay fallout (0.03) and atmospheric fallout (0.18) has been exploited to estimate that 2 TBq of 239,240Pu in Barents Sea sediments was originally derived from Chernaya Bay. Further, a plume of low 240Pu/ 239Pu
ratio plutonium, distributed in a northwestward direction, is evident
in sediments along the southern coastline of Novaya Zemlya, indicating
that an additional quantity of Chernaya Bay plutonium may have been
transported into the Arctic Ocean.
https://ui.adsabs.harvard.edu/abs/2000CSR....20..255S/abstract
___________________________
Russia slashes environmental protections as war rages, economic crisis looms
June 26, 2022
https://thebarentsobserver.com/en/industry-and-energy/2022/06/russia-slashes-environmental-protections-war-rages-economic-crisis-looms
___________________________
Rosneft-sponsored study says Soviet-era eco-impact at Franz Josef Land is ‘insignificant’
August 25, 2022
A three-year study on the impact of the Soviet Union’s oil usage on Franz Josef Land led scientists to conclude that the USSR’s environmental impacts on the archipelago are insignificant.
A three-year long study, that commenced in 2019 and analyzed the effects of oil-contamination caused by the economic activities of the Soviet Union, has just wrapped up on the Franz Josef Land archipelago.
The study’s data had been analyzed by scientists from the Federal Research Center of Biotechnology from the Russian Academy of Sciences and their findings have just been presented by the Russian Arctic national park alongside Rosneft, Russia’s largest oil company.
Rosneft was both sponsor and active participant throughout the project period.
https://thebarentsobserver.com/en/arctic/2022/08/rosneft-sponsored-study-says-soviet-era-eco-impact-franz-josef-land-insignificant
___________________________
Bioaccumulation of PCBs and chlorinated pesticides in seals, fishes and invertebrates from the White Sea, Russia
2002
https://pubmed.ncbi.nlm.nih.gov/12699922/
___________________________
How Norilsk, in the Russian Arctic, became one of the most polluted places on Earth
Nov. 28, 2021
A smelting company has poisoned rivers, killed off forests and belched out more sulfur dioxide than active volcanoes. Now it wants to produce more metal for the “green economy.”
https://www.nbcnews.com/news/world/norilsk-russian-arctic-became-one-polluted-places-earth-rcna6481
___________________________
Benthic communities of Russian Arctic Seas under radioactive pollution condition
January 2009
https://www.researchgate.net/publication/44208242_Benthic_communities_of_Russian_Arctic_Seas_under_radioactive_pollution_condition
___________________________
Marine seabed litter in Siberian Arctic: A first attempt to assess
2021 Aug 18
https://pubmed.ncbi.nlm.nih.gov/34418709/
___________________________
Geographical distribution of organochlorine pesticides (OCPs) in polar bears (Ursus maritimus) in the Norwegian and Russian Arctic
2002
https://www.sciencedirect.com/science/article/abs/pii/S0048969702004904
___________________________
Polar bears in eastern Barents Sea have most chemical pollutants
July 17, 2018
https://www.arctictoday.com/polar-bears-eastern-barents-sea-chemical-pollutants/
___________________________
Riverine fluxes of the persistent organochlorine pesticides hexachlorcyclohexane and DDT in the Russian Federation
2000
https://www.sciencedirect.com/science/article/abs/pii/S0045653599005202
___________________________
Soviet nuclear submarine emitting radiation ‘100,000 times normal level’ into sea, scientists find
10 July 2019
The wreck of a Soviet nuclear submarine which sunk in the Barents Sea after a fire in 1989 is emitting high levels of radiation, a joint Russian and Norwegian investigative team has reported...
https://www.independent.co.uk/news/world/europe/soviet-nuclear-submarine-russia-barents-sea-radiation-komsomolets-wreck-a8998741.html
___________________________
Siberian Arctic black carbon: gas flaring and wildfire impact
2022
https://acp.copernicus.org/articles/22/5983/2022/
___________________________
Russia explores old nuclear waste dumps in Arctic
25 January 2013
https://www.bbc.com/news/world-europe-21119774
___________________________
Pollution of Russian Northern Seas with Heavy Metals: Comparison of Atmospheric Flux and River Flow
December 2019
https://ui.adsabs.harvard.edu/abs/2019IzAOP..55..695V/abstract
___________________________
Plutonium isotope ratios in the Yenisey and Ob estuaries
2003
https://www.sciencedirect.com/science/article/abs/pii/S0969804303003774
___________________________
Heavy metal pollution in sediments of the Pasvik River drainage
2001
https://www.academia.edu/16251015/Heavy_metal_pollution_in_sediments_of_the_Pasvik_River_drainage
___________________________
Pathways of Siberian freshwater and sea ice in the Arctic Ocean traced with radiogenic neodymium isotopes and rare earth elements
2017
https://www.academia.edu/en/67946233/Pathways_of_Siberian_freshwater_and_sea_ice_in_the_Arctic_Ocean_traced_with_radiogenic_neodymium_isotopes_and_rare_earth_elements
___________________________
Russians blame sea pollution on Sellafield
8 Aug 2001
https://www.theguardian.com/world/2001/aug/09/kursk.russia
___________________________
Subcritical nuke tests may be resumed at Novaya Zemlya
2012
https://barentsobserver.com/en/security/subcritical-nuke-tests-may-be-resumed-novaya-zemlya-02-10
___________________________
Russia blasting into fragile Arctic in search of oil
2011
https://www.thestar.com/news/world/2011/12/17/russia_blasting_into_fragile_arctic_in_search_of_oil.html
___________________________
Researchers locate scuttled reactors from K-19 submarine
September 14, 2021
A Russian expedition to search for radioactive waste intentionally scuttled by the Soviet Navy has pinpointed where the reactor compartment for the troubled K-19, Moscow’s first nuclear powered ballistic missile submarine, was dumped.
https://bellona.org/news/nuclear-issues/2021-09-researchers-locate-scuttled-reactors-from-k-19-submarine
___________________________
Russia’s missing nuclear-powered cruise missile sparks radiation worries
August 23, 2018
https://www.rcinet.ca/eye-on-the-arctic/2018/08/23/russia-nuclear-cruise-missile-radiation-arctic-barents-sea-norway-fishing-environment-worries/
___________________________
The Terrifying History of Russia’s Nuclear Submarine Graveyard
2021
https://www.popularmechanics.com/military/navy-ships/a34976195/russias-nuclear-submarine-graveyard/
___________________________
Ocean disposal of radioactive waste
https://en.wikipedia.org/wiki/Ocean_disposal_of_radioactive_waste
Pacific Ocean
The Soviet Union 874 TBq, US 554 TBq, Japan 606.2 Tonnes, New Zealand 1+ TBq. 751,000 m3 was dumped by Japan and the Soviet Union. The United States reported neither tonnage nor volume of 56,261 containers.
Dumping of contaminated water at the 2011 Fukushima nuclear accident (estimate 4,700–27,000 TBq) is not included.
Environmental impact
Data are from IAEA-TECDOC-1105.[2]: 7
Arctic Ocean
Joint Russian-Norwegian expeditions (1992–94) collected samples from four dump sites. At immediate vicinity of waste containers, elevated levels of radionuclide were found, but had not contaminated the surrounding area.
___________________________
Sunken Soviet Sub leaking high levels of radiation, Norwegian researchers say
August 5, 2019
Norwegian researchers have discovered that a Soviet nuclear submarine that sank in the Barents Sea 30 years ago, killing 41 sailors, is leaking radiation at nearly 1 million times normal levels.
https://bellona.org/news/nuclear-issues/2019-08-sunken-soviet-sub-leaking-high-levels-of-radiation-norwegian-researchers-say
___________________________
Russia’s Arctic nuclear dump may become promising fishing area
March 15, 2018
Thousands of containers with radioactive waste were dumped in the Kara Sea during Soviet times. Now, Russia’s Federal Agency for Fishing believes it’s a good idea to start fishing.
https://thebarentsobserver.com/en/ecology/2018/03/russias-arctic-nuclear-dump-may-become-promising-fishing-area
___________________________
Soviet submarine K-27
https://en.wikipedia.org/wiki/Soviet_submarine_K-27
___________________________
Expedition finds reactors 56 years after dumping
September 02, 2021
A
Russian research expedition has rediscovered the location of the
container with two damaged reactors from the Soviet navy submarine K-19,
dumped in Ambrosimova Bay in 1965.
https://thebarentsobserver.com/en/nuclear-safety/2021/09/expedition-found-exact-location-dumped-reactor
___________________________
Urgent to lift dumped K-27 nuclear sub
September 25, 2012
https://barentsobserver.com/en/nature/urgent-lift-dumped-k-27-nuclear-sub-25-09
___________________________
Hundreds of Dead Animals Washing Up on a Beach Is Russia’s Latest ‘Ecological Catastrophe’
10/06/20
Hundreds of sea creatures’ bodies have washed up onto the shore in Russia’s Far East. All signs point to water pollution in what is the latest in a series of environmental catastrophes to befall Russia this year.
The contamination, first reported last month, has left a bubbly yellow sludge on the water offshore of the Kamchatka Peninsula, a land mass that sits between the Bering Sea and Sea of Okhotsk. It is currently being investigated by Kamchatka’s regional Environmental Prosecutor’s Office, but no one’s yet sure where it came from.
https://gizmodo.com/hundreds-of-dead-animals-washing-up-on-a-beach-is-russi-1845291629
___________________________
Mysterious mass die-off on Russia's eastern coast has scientists searching for answers
October 10, 2020
Thousands of dead sea creatures have washed up in Kamchatka.
https://abcnews.go.com/International/mysterious-mass-die-off-russias-eastern-coast-scientists/story?id=73544331
___________________________
The mysterious behavior of ocean salt
2021
https://www.columbiatribune.com/story/news/2021/06/23/mysterious-behavior-ocean-salt/7683351002/
___________________________
Atlantic Current Shutdown Could Disrupt Ocean Food Chain
April 13, 2005
https://www.sciencedaily.com/releases/2005/04/050412213152.htm
___________________________
Slowing Gulf Stream current to boost warming for 20 years
19 July 2018
https://www.bbc.com/news/science-environment-44875508
___________________________
Ice Age Reboot: Ocean Current Shutdown Viewed as Culprit
June 26, 2014
A dramatic slowdown in deep ocean currents matches a major reset in Earth's ice ages about 1 million years ago, new evidence from the South Atlantic seafloor suggests.
https://www.nbcnews.com/id/wbna55516264
___________________________
Ocean Circulation Shut Down By Melting Glaciers After Last Ice Age
November 21, 2001
https://www.sciencedaily.com/releases/2001/11/011120041942.htm
___________________________
Failing ocean current raises fears of mini ice age
30 November 2005
https://www.newscientist.com/article/dn8398-failing-ocean-current-raises-fears-of-mini-ice-age/
___________________________
Ocean Circulation Shut Down by Melting Glaciers After Last Ice Age
Nov 19, 2001
https://www.spacedaily.com/news/iceage-01e.html
___________________________
Atlantic Ocean Current Slows Down To 1,000-Year Low, Studies Show
April 13, 2018
https://www.npr.org/2018/04/13/602240020/atlantic-ocean-current-slows-down-to-1-000-year-low-studies-show
___________________________
A Chilling Possibility
Mar 5, 2004
By disturbing a massive ocean current, melting Arctic sea ice might trigger colder weather in Europe and North America.
https://science.nasa.gov/science-news/science-at-nasa/2004/05mar_arctic/
___________________________
Shutdown Of Circulation Pattern Could Be Disastrous, Researchers Say
December 20, 2004
https://www.sciencedaily.com/releases/2004/12/041219153611.htm
___________________________
Scientists Terrifying NEW Discoveries At Yellowstone National Park!
Jun 24, 2022
https://www.youtube.com/watch?v=PBqSaJZKiig
___________________________
Learn how Supervolcanoes caused the World’s Largest Landslide in Wyoming
Feb 4, 2022
https://www.youtube.com/watch?v=CYS3r3tk2GI
___________________________
Mount St. Helens: The Turmoil of Creation Continues — 1989
Oct 28, 2014
https://www.youtube.com/watch?v=PavWmfpCklk
___________________________
Greenland’s Bedrock Is Unexpectedly Deep, Which Is Really Bad for Ice Melt
November 2, 2017
https://gizmodo.com/greenlands-bedrock-is-unexpectedly-deep-which-is-reall-1820074206
___________________________
Europe’s Heat Wave Threatens Record Melting of Greenland Ice Sheet
July 26, 2019
https://gizmodo.com/europes-heat-wave-threatens-record-melting-of-greenland-1836728186
___________________________
Arctic sea ice melt season is now underway, but not as strong as in recent years, except in the Siberian region
09/06/2021
https://www.severe-weather.eu/global-weather/arctic-sea-ice-melt-season-2021-june-fa/
___________________________
___________________________
___________________________
Section 2: Environment (The Arctic)
___________________________
___________________________
___________________________
Climate of the Arctic
https://en.wikipedia.org/wiki/Climate_of_the_Arctic
___________________________
The Wreck of the SS ATLANTIC - Halifax, NS 1873
Mar 21, 2020
https://www.youtube.com/watch?v=Z6JkwN7kw8E
___________________________
The Terrible Disaster of the SS ARCTIC (1854)
May 21, 2022
https://www.youtube.com/watch?v=UEGseRuJ4Xw
___________________________
TRAGIC STORY OF SALOMON ANDREE: How the First Arctic BALLOON Expedition Ended // North Pole 1897
Apr 4, 2022
https://www.youtube.com/watch?v=eYHXLlkhMho
___________________________
The Story of Ernest Shackleton: The South Pole Failure that Turned into an Incredible Survival Story
Mar 3, 2022
https://www.youtube.com/watch?v=Io9wTBNelmo
___________________________
Arctic Tomb (Franklin expedition documentary)
Feb 26, 2020
https://www.youtube.com/watch?v=-j94t4tN1w0
___________________________
World’s northernmost Palaeolithic settlement found on Kotelny island in the Arctic
https://www.siberiantimes.com/science/
___________________________
Production of biological soil crusts in the early stage of primary succession on a High Arctic glacier foreland
02 February 2010
https://nph.onlinelibrary.wiley.com/doi/10.1111/j.1469-8137.2010.03180.x
___________________________
Melting sea ice leaves Arctic vulnerable to erosion
18 April 2011
https://www.newscientist.com/article/dn20389-melting-sea-ice-leaves-arctic-vulnerable-to-erosion/
___________________________
Coastal erosion is picking up speed across the Arctic
02-14-2022
https://www.earth.com/news/coastal-erosion-is-picking-up-speed-across-the-arctic/
___________________________
Including Soil Erosion in Global models of the climate Crisis
2020
https://www.pnnl.gov/publications/including-soil-erosion-global-models-carbon-cycle
___________________________
Shore Erosion in Russian Arctic
2012
https://ascelibrary.org/doi/abs/10.1061/40621%28254%2963
___________________________
Heavy metals in the Arctic: Distribution and enrichment of five metals in Alaskan soils
June 3, 2020
https://journals.plos.org/plosone/article?id=10.1371/journal.pone.0233297
___________________________
Variable responses of carbon and nitrogen contents in vegetation and soil to herbivory and warming in high-Arctic tundra
21 September 2021
https://esajournals.onlinelibrary.wiley.com/doi/10.1002/ecs2.3746
___________________________
Rates and processes of aeolian soil erosion in West Greenland
January 18, 2017
https://journals.sagepub.com/doi/10.1177/0959683616687381
___________________________
Greenland ice sheet & winds driving tundra soil erosion
13 August 2015
https://www.enn.com/articles/48871
___________________________
Around one third of current Arctic Ocean primary production sustained by rivers and coastal erosion
2021 Jan 8
https://www.ncbi.nlm.nih.gov/pmc/articles/PMC7794587/
___________________________
Prevention
and control measures for coastal erosion in northern high-latitude
communities: a systematic review based on Alaskan case studies
19 August 2020
https://iopscience.iop.org/article/10.1088/1748-9326/ab9387
___________________________
Erosion of organic carbon in the Arctic as a geological carbon dioxide sink
2015
https://pubmed.ncbi.nlm.nih.gov/26245581/
___________________________
Wildfire still burning in Greenland tundra in mid-August 2017
August 18, 2017
https://www.climate.gov/news-features/event-tracker/wildfire-still-burning-greenland-tundra-mid-august-2017
___________________________
Grazing and topography control nutrient pools in low Arctic soils of Southwest Greenland
03 July 2022
https://bsssjournals.onlinelibrary.wiley.com/doi/10.1111/ejss.13278
___________________________
Soil Erosion and Its Impacts on Greenhouse Gases
29 January 2022
https://link.springer.com/chapter/10.1007/978-981-16-7916-2_2
___________________________
Snowmelt Events in Autumn Can Reduce or Cancel the Soil Warming Effect of Snow–Vegetation Interactions in the Arctic
01 Dec 2018
https://journals.ametsoc.org/view/journals/clim/31/23/jcli-d-18-0135.1.xml
___________________________
Unexpected future boost of methane possible from Arctic permafrost
August 20, 2018

Methane bubbles up from the thawed permafrost at the bottom of the thermokarst lake through the ice at its surface
___________________________
Erosion of organic carbon in the Arctic as a geological carbon dioxide sink
05 August 2015
https://www.nature.com/articles/nature14653
___________________________
Soil Erosion on the Yamal Peninsula (Russian Arctic) due to Gas Field Exploitation
September 1996
https://www.researchgate.net/publication/267392131_Soil_Erosion_on_the_Yamal_Peninsula_Russian_Arctic_due_to_Gas_Field_Exploitation
___________________________
Erosion Control Along Transportation Routes in Northern Climates
1981
https://pubs.aina.ucalgary.ca/arctic/Arctic34-2-147.pdf
___________________________
Modelling the seasonal variations of soil temperatures in the Arctic coasts
2021
https://www.sciencedirect.com/science/article/pii/S1873965221001201
___________________________
Study reveals Greenland ice sheet melted once before, and could again
March 2021
https://www.seattletimes.com/nation-world/study-reveals-greenland-ice-sheet-melted-once-before-and-it-could-happen-again/
___________________________
5.6 Soil Erosion in Iceland: Reclaiming a Fragile Environment
May 20, 2022
https://ohiostate.pressbooks.pub/sciencebitesvolume2/chapter/5-6-soil-erosion-in-iceland-reclaiming-a-fragile-environment/
___________________________
Climate impacts to Arctic coasts
https://www.usgs.gov/centers/pcmsc/science/climate-impacts-arctic-coasts
___________________________
Increase in Arctic coastal erosion and its sensitivity to warming in the twenty-first century
14 February 2022
https://www.nature.com/articles/s41558-022-01281-0
___________________________
Erosion due to climate change is destroying the Arctic coastline
15.02.2022
https://www.europeanscientist.com/en/environment/erosion-due-to-climate-change-is-destroying-the-arctic-coastline/
___________________________
Colonization patterns of soil microbial communities in the Atacama Desert
20 November 2013
https://microbiomejournal.biomedcentral.com/articles/10.1186/2049-2618-1-28
___________________________
Antarctic and arctic desert: soil, characteristics and characteristics of soils
https://stuklopechat.com/obrazovanie/88162-antarkticheskaya-i-arkticheskaya-pustynya-pochva-harakteristiki-i-osobennosti-pochv.html
___________________________
Soil
erosion and sediment dynamics in the Anthropocene: a review of human
impacts during a period of rapid global environmental change
04 November 2020
https://link.springer.com/article/10.1007/s11368-020-02815-9
___________________________
Arctic coastlines threatened by melting permafrost
2013
https://barentsobserver.com/en/nature/2013/10/arctic-coastlines-threatened-melting-permafrost-05-10
___________________________
Arctic carbon cycle is speeding up
August 3, 2018
https://climate.nasa.gov/news/2776/arctic-carbon-cycle-is-speeding-up/
___________________________
A
glimpse into the northernmost thermo-erosion gullies in Svalbard
archipelago and their implications for Arctic cultural heritage
2022
https://research.utwente.nl/en/publications/a-glimpse-into-the-northernmost-thermo-erosion-gullies-in-svalbar
___________________________
Microbial metabolism directly affects trace gases in (sub) polar snowpacks
20 December 2017
https://royalsocietypublishing.org/doi/10.1098/rsif.2017.0729
___________________________
Methyl halide and methane fluxes in the northern Alaskan coastal tundra
2007
https://www.academia.edu/5977617/Methyl_halide_and_methane_fluxes_in_the_northern_Alaskan_coastal_tundra
___________________________
Natural halocarbons in the air and in the sea
17 July 1975
https://www.nature.com/articles/256193a0
___________________________
Arctic Arsenic
February 1, 2001
Charles
Francis Hall was murdered during an expedition that might have taken
him to the North Pole decades before Peary. Or was he?
https://www.smithsonianmag.com/history/arctic-arsenic-71724451/
___________________________
Arsenic, antimony and vanadium in the North Atlantic Ocean
1988
https://www.osti.gov/biblio/5028750-arsenic-antimony-vanadium-north-atlantic-ocean
___________________________
Arctic – Atlantic Exchange of the Dissolved
Micronutrients Iron, Manganese, Cobalt, Nickel, Copper and Zinc With a
Focus on Fram Strait
02 May 2022
https://agupubs.onlinelibrary.wiley.com/doi/full/10.1029/2021GB007191
___________________________
Comparative zinc and lead toxicity tests with Arctic marine invertebrates and implications for toxicant discharges
27 October 2009
https://www.cambridge.org/core/journals/polar-record/article/abs/comparative-zinc-and-lead-toxicity-tests-with-arctic-marine-invertebrates-and-implications-for-toxicant-discharges/B1E6259F466904B7ACBC58E50FC571FB
___________________________
Arctic Copper-Zinc-Lead Project
https://www.nsenergybusiness.com/projects/arctic-copper-zinc-lead-project/
___________________________
Metal Resistance in Bacteria from Contaminated Arctic Sediment is Driven by Metal Local Inputs
2019 Apr 13
https://pubmed.ncbi.nlm.nih.gov/30982081/
___________________________
Methyl bromide, other brominated methanes, and methyl iodide in polar firn air
01 January 2001t
https://agupubs.onlinelibrary.wiley.com/doi/abs/10.1029/2000JD900511
___________________________
Persistent Organic Pollutants in the Arctic – Infographic
June 28, 2016
https://www.thearcticinstitute.org/persistent-organic-pollutants-in-the-arctic-infographic/
___________________________
Evidence of reactive iodine chemistry in the Arctic boundary layer
19 October 2010
https://agupubs.onlinelibrary.wiley.com/doi/full/10.1029/2009JD013665
___________________________
High levels of molecular chlorine found in Arctic atmosphere
2014
https://wattsupwiththat.com/2014/01/15/high-levels-of-molecular-chlorine-found-in-arctic-atmosphere/
___________________________
Iodine cycle
https://en.wikipedia.org/wiki/Iodine_cycle
___________________________
Active molecular iodine photochemistry in the Arctic
September 5, 2017
https://www.pnas.org/doi/10.1073/pnas.1702803114
___________________________
Oil and Natural Gas Shales of Alaska's Arctic North Slope
Summary of the USGS Shale Gas and Shale Oil Resource Potential of the Alaska North Slope report of February 2012
https://geology.com/articles/alaska-shale-gas/
___________________________
Scientists are about to lock themselves into an Arctic ice floe for a year
September 17, 2019
In the largest Arctic expedition yet, researchers will gather as much data as they can on the fading ice—and climate change.
https://www.pbs.org/wgbh/nova/article/mosaic-polarstern-departs/
___________________________
The
role of microbial electrogenesis in regulating methane and nitrous
oxide emissions from constructed wetland-microbial fuel cell
2022
https://www.sciencedirect.com/science/article/abs/pii/S0360319922026490
___________________________
Arctic rocks may contain oldest remnants of Earth
11 August 2010
https://www.bbc.com/news/science-environment-10941026
___________________________
Source apportionment of methane escaping the subsea permafrost system in the outer Eurasian Arctic Shelf
March 1, 2021
https://www.pnas.org/doi/10.1073/pnas.2019672118
___________________________
What is the geochemical source for the helium detected in deep Arctic explosive eruptions?
2015
https://earthscience.stackexchange.com/questions/4293/what-is-the-geochemical-source-for-the-helium-detected-in-deep-arctic-explosive
___________________________
The Arctic Ocean is a net source of micronutrients toward the North Atlantic through the gateway of Fram Strait
18 May 2022
https://www.geotraces.org/arctic-ocean-net-source-micronutrients-north-atlantic-fram-strait/
___________________________
Source apportionment of methane escaping the subsea permafrost system in the outer Eurasian Arctic Shelf
March 1, 2021
https://www.pnas.org/doi/10.1073/pnas.2019672118
___________________________
Distribution of natural halocarbons in marine boundary air over the Arctic Ocean
August 2013
https://www.researchgate.net/publication/259187884_Distribution_of_natural_halocarbons_in_marine_boundary_air_over_the_Arctic_Ocean
___________________________
Arctic
Glaciers Entrap Pesticides and Other Environmental Pollutants from
Global Drift and Release Hazardous Chemicals as They Melt from Global
Warming
2020
https://beyondpesticides.org/dailynewsblog/2020/08/arctic-glaciers-entrap-pesticides-and-other-environmental-pollutants-from-global-drift-and-release-hazardous-chemicals-as-they-melt-from-global-warming/
___________________________
Methyl Bromide
https://www.sciencedirect.com/topics/earth-and-planetary-sciences/methyl-bromide
___________________________
Chlorine, Bromine AND Iodine in arctic aerosols
1988
https://www.sciencedirect.com/science/article/abs/pii/0004698188903496
___________________________
Little erosion beneath Antarctica and Greenland Ice Sheets
2016
https://creation.com/images/pdfs/tj/j30_1/j30_1_11-14.pdf
___________________________
Reference soil Greenland 02: Histosol
https://museum.isric.org/monoliths/reference-soil-greenland-02
___________________________
Greenland
https://en.wikipedia.org/wiki/Greenland
___________________________
Arctic coast erosion revealed by drone images
2019
https://www.ed.ac.uk/news/2019/arctic-coast-erosion-revealed-by-drone-images
___________________________
Biogeochemistry of arsenic and antimony in the North Pacific Ocean
25 May 2006
https://agupubs.onlinelibrary.wiley.com/doi/full/10.1029/2005GC001159
___________________________
Antimony and arsenic biogeochemistry in the western Atlantic Ocean
2001
https://www.sciencedirect.com/science/article/abs/pii/S0967064501000236
___________________________
Lead pollution in Arctic ice shows economic impact of wars and plagues for past 1,500 years
July 8, 2019
https://www.sciencedaily.com/releases/2019/07/190708154038.htm
___________________________
Arsenic in the water and a comparison with the Atlantic coastline
1979
https://pubmed.ncbi.nlm.nih.gov/546682/
___________________________
Distribution and cycle of arsenic compounds in the ocean
May 1994
https://onlinelibrary.wiley.com/doi/abs/10.1002/aoc.590080319
___________________________
Arsenic-breathing microbes discovered in the tropical Pacific Ocean
Element that’s poisonous for most life benefits certain marine microorganisms
May 1, 2019
https://beta.nsf.gov/news/arsenic-breathing-microbes-discovered-tropical-pacific-ocean
___________________________
Arsenic cycle
https://en.wikipedia.org/wiki/Arsenic_cycle
___________________________
Atmospheric deposition studies of heavy metals in Arctic by comparative analysis of lichens and cryoconite
2012 May 25
https://pubmed.ncbi.nlm.nih.gov/22623166/
___________________________
Russia’s new lithium mine will harm Arctic ecosystems and Indigenous people, Sámi activist warns
June 14, 2022
https://www.arctictoday.com/russias-new-lithium-mine-will-harm-arctic-ecosystems-and-indigenous-people-sami-activist-warns/
___________________________
Russia’s Push To Mine Arctic Metals Is Fueled By Nuclear Power
Dec 04, 2021
https://oilprice.com/Energy/Energy-General/Russias-Push-To-Mine-Arctic-Metals-Is-Fueled-By-Nuclear-Power.html
___________________________
Russia’s Rosatom Plans to Launch Lithium Mines in Siberia, Arctic
August 5, 2021
https://www.e-mj.com/breaking-news/russias-rosatom-plans-to-launch-lithium-mines-in-siberia-arctic/
___________________________
Scientists Terrifying New Discovery Frozen In Ice That Changes Everything!
Aug 18, 2022
https://www.youtube.com/watch?v=QeqKTIFBob0
___________________________
Canada Used To Provide A Lot Of World’s Lithium, But Can It Revive That?
2021
https://cleantechnica.com/2021/02/24/canada-used-to-provide-a-lot-of-worlds-lithium-but-can-it-revive-that/
___________________________
The Top Lithium Producing Countries In The World
1. Australia
2. Chile
3. China
4. Argentina
5. Zimbabwe
6. Portugal
7. Brazil
https://www.worldatlas.com/articles/the-top-lithium-producing-countries-in-the-world.html
___________________________
Livent to increase lithium output in the Argentine province of Catamarca
March 18th 2022
https://en.mercopress.com/2022/03/18/livent-to-increase-lithium-output-in-the-argentine-province-of-catamarca
___________________________
Lithium in waters of a polar desert
1 October 1997
https://www.semanticscholar.org/paper/Lithium-in-waters-of-a-polar-desert-Lyons-Welch/32f07ac8cfab29226d729df4d4003a4a909d60eb
___________________________
Lithium in Greenland ice cores measured by ion chromatography
14 September 2017
https://www.cambridge.org/core/journals/annals-of-glaciology/article/lithium-in-greenland-ice-cores-measured-by-ion-chromatography/A49B2C010AF147506B97920584B40204
___________________________
The lithium triangle
Apr 5, 2013
https://www.reuters.com/news/picture/the-lithium-triangle-idUSRTXY9FY
___________________________
Origin of Sodium and Lithium in the Upper Atmosphere
23 May 1959
https://www.nature.com/articles/1831480a0
___________________________
How 'Iron Man' bacteria could help protect the environment
February 3, 2021
Research opens the door to applications in recycling and remediation
https://beta.nsf.gov/news/how-iron-man-bacteria-could-help-protect-environment
___________________________
The Detrimental Effects of Deep-Sea Mining on Marine Ecosystems
Jun 4th 2021
https://earth.org/detrimental-effects-of-deep-sea-mining/
___________________________
Halocarbons associated with Arctic sea ice
2014
https://www.sciencedirect.com/science/article/pii/S0967063714000855
___________________________
Arctic ozone layer is STILL under threat as scientists
find climate change is driving record cold temperatures that are
reacting with damaging human-made chemicals
2021
https://www.dailymail.co.uk/sciencetech/article-9713905/Ozone-layer-threat-despite-ban-dangerous-chemicals.html
___________________________
CFC replacements are a source of persistent organic pollution in the Arctic
May 14, 2020
Degraded, toxic compounds from CFC replacements found in ice in the Canadian Arctic
https://www.sciencedaily.com/releases/2020/05/200514131712.htm
___________________________
BFCs (Bromofluorocarbons) are adopted instead of CFCs (Chlorofluorocarbons)?
Sep 21, 2021
https://www.alternatehistory.com/forum/threads/wi-bfcs-bromofluorocarbons-are-adopted-instead-of-cfcs-chlorofluorocarbons.517368/
___________________________
Global CFC emissions now declining again as expected under the Montreal Protocol
February 11th, 2021
https://research.csiro.au/acc/global-cfc-emissions-now-declining-again/
___________________________
Replacements for banned CFCs polluting Arctic: study
May 25, 2020
https://troymedia.com/science/replacements-for-banned-cfcs-polluting-arctic-study/
___________________________
Ozone formation and destruction in the stratosphere
2004
http://www.chemistry.uoguelph.ca/educmat/chm336/s2004/Chapter%202%20Transparencies.pdf
___________________________
Explainer: hydrofluorocarbons saved the ozone layer, so why are we banning them?
November 1, 2017
https://theconversation.com/explainer-hydrofluorocarbons-saved-the-ozone-layer-so-why-are-we-banning-them-86672
___________________________
Tough carbon-flourine bonds broken by photo-powered nanocatalyst
September 30, 2020
https://insights.globalspec.com/article/15107/tough-carbon-flourine-bonds-broken-by-photo-powered-nanocatalyst
___________________________
Record-breaking 2020 ozone hole closes
6 January 2021
https://public.wmo.int/en/media/news/record-breaking-2020-ozone-hole-closes
___________________________
Ocean Circulation: Thermohaline Circulation
https://www.ncei.noaa.gov/access/ocean-carbon-acidification-data-system/oceans/glodap/glodap_pdfs/Thermohaline.web.pdf
___________________________
Barren forests, dirty rivers, unbreathable air: Inside an Arctic city's vast pollution problem
December 10, 2021
https://news.yahoo.com/norilsk-russian-arctic-became-one-100429053.html
___________________________
Arctic Pollution's Surprising History: Explorers Saw Particulate Haze In Late 1800s
March 21, 2008
https://www.sciencedaily.com/releases/2008/03/080319085406.htm
___________________________
Pervasive Arctic lead pollution suggests substantial
growth in medieval silver production modulated by plague, climate, and
conflict
2019 Jul 8
https://pubmed.ncbi.nlm.nih.gov/31285330/
___________________________
Trace element concentrations and gastrointestinal parasites of Arctic terns breeding in the Canadian High Arctic
2014
https://www.sciencedirect.com/science/article/abs/pii/S0048969714000254
___________________________
Reconstruction of Arctic climate conditions in the Cretaceous period
May 29, 2015
https://www.geologypage.com/2015/05/reconstruction-of-arctic-climate-conditions-in-the-cretaceous-period.html
___________________________
Polar Phytoplankton Need Zinc to Cope with the Cold
June 6, 2022
https://jgi.doe.gov/polar-phytoplankton-need-zinc-to-cope-with-the-cold/
___________________________
How the Discovery of Two Lost Ships Solved an Arctic Mystery
April 15, 2017
https://www.nationalgeographic.com/adventure/article/franklin-expedition-ship-watson-ice-ghosts
___________________________
June 8, 2015
As the U.S. and Russia take the first steps to drill for oil and gas in the Arctic Ocean, experts say the harsh climate, icy seas, and lack of infrastructure means a sizeable oil spill would be very difficult to clean up and could cause extensive environmental damage.
https://e360.yale.edu/features/oil_drilling_in_arctic_ocean_a_push_into_uncharted_waters
___________________________
One of the Most Polluted Places on Earth Is in the Russian Arctic
04/12/2021
Norilsk is part of an Arctic that is warming twice as fast as the rest
of the planet, but the permafrost and structural problems can’t be
attributed to climate change alone.
Norilsk’s pollution can
be seen in the 5.9 million acres of dead or dying forest downwind from
the Norilsk Nickel compound – a large scar slashed into Earth’s largest
forested region.
The intensity of Norilsk’s pollution is
detectable from space. Satellite instrument readings show that no other
human enterprise generates as much sulphur dioxide pollution.
https://science.thewire.in/external-affairs/world/one-of-the-most-polluted-places-on-earth-is-in-the-russian-arctic/
___________________________
Nitrate is an important nitrogen source for Arctic tundra plants
March 14, 2018
https://www.pnas.org/doi/10.1073/pnas.1715382115
___________________________
Submarine landslides in Arctic sedimentation: Canada Basin
2016
https://pubs.er.usgs.gov/publication/70176625
___________________________
Are the land-based ice sheets in Greenland and Antarctica continuing to lose mass (ice)?
https://climate.nasa.gov/faq/48/are-the-land-based-ice-sheets-in-greenland-and-antarctica-continuing-to-lose-mass-ice/
___________________________
Landslide-Induced Tsunamis of Southern Alaska
June 17, 2019
https://www.usgs.gov/programs/coastal-and-marine-hazards-and-resources-program/science/landslide-induced-tsunamis
___________________________
Alaska's new climate threat: tsunamis linked to melting permafrost
18 Oct 2020
Scientists are warning of a link between rapid warming and landslides that could threaten towns and tourist attractions
https://www.theguardian.com/environment/2020/oct/18/alaska-climate-change-tsunamis-melting-permafrost
___________________________
Arctic
tsunamis threaten coastal landscapes and communities – survey of Karrat
Isfjord 2017 tsunami effects in Nuugaatsiaq, western Greenland
2020
https://nhess.copernicus.org/articles/20/2521/2020/
___________________________
More than one ocean motion determines tsunami size
April 14, 2017
Giant wave forecasts need to take into account horizontal motion on sloped seafloors
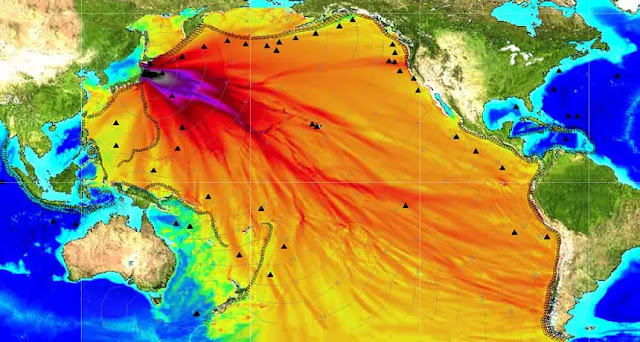
OCEAN MOTION The 2011 tsunami that devastated Japan (forecast shown) was fueled by both the horizontal and vertical motion of the seafloor, new research suggests. Darker colors represent higher waves. Black triangles mark tsunami-measuring buoys.
https://www.sciencenews.org/article/more-one-ocean-motion-determines-tsunami-size
___________________________
Natural catastrophe in Greenland caused by tsunami
2017
https://www.icenews.is/2017/06/20/natural-catastrophe-in-greenland-caused-by-tsunami/
___________________________
World's Tallest Tsunami
A tsunami with a record run-up height of 1720 feet occurred in Lituya Bay, Alaska
On
the night of July 9, 1958, an earthquake along the Fairweather Fault in
the Alaska Panhandle loosened about 40 million cubic yards (30.6
million cubic meters) of rock high above the northeastern shore of
Lituya Bay. This mass of rock plunged from an altitude of approximately
3000 feet (914 meters) down into the waters of Gilbert Inlet (see map
below). The impact force of the rockfall generated a local tsunami that
crashed against the southwest shoreline of Gilbert Inlet.
The
wave hit with such power that it swept completely over the spur of land
that separates Gilbert Inlet from the main body of Lituya Bay. The wave
then continued down the entire length of Lituya Bay, over La Chaussee
Spit and into the Gulf of Alaska. The force of the wave removed all
trees and vegetation from elevations as high as 1720 feet (524 meters)
above sea level. Millions of trees were uprooted and swept away by the
wave. This is the highest runup ever recorded for a tsunami.
https://geology.com/records/biggest-tsunami.shtml
___________________________
‘It Could Happen Anytime’: Scientists Warn of Alaska Tsunami Threat
2020
https://www.nytimes.com/2020/05/14/climate/alaska-landslide-tsunami.html
___________________________
Tsunamis in Alaska
https://earthquake.alaska.edu/about-tsunamis-alaska
___________________________
The 20 largest recorded earthquakes in history
January 27, 2023
16. Kuril Islands, Russia; 1963; magnitude 8.5
15. Atacama, Chile; 1922; magnitude 8.5
13. Unimak Island, Alaska; 1946; magnitude 8.6
12. Andreanof Islands, Alaska; 1957; magnitude 8.6
9. Assam-Tibet, 1950, magnitude 8.6
8. Rat Islands, Alaska; 1965; magnitude 8.7
6. Offshore Maule, Chile; 2010; magnitude 8.8
5. Kamchatka Peninsula, Russia; 1952; magnitude 9.0
2. Prince William Sound, Alaska; 1964; magnitude 9.2
1. Valdivia, Chile; 1960; magnitude 9.5
https://www.livescience.com/largest-recorded-earthquakes-in-history
___________________________
List of earthquakes in Alaska
https://en.wikipedia.org/wiki/List_of_earthquakes_in_Alaska
___________________________
World's Tallest Tsunami
A tsunami with a record run-up height of 1720 feet occurred in Lituya Bay, Alaska
On the night of July 9, 1958, an earthquake along the Fairweather Fault in the Alaska Panhandle loosened about 40 million cubic yards (30.6 million cubic meters) of rock high above the northeastern shore of Lituya Bay. This mass of rock plunged from an altitude of approximately 3000 feet (914 meters) down into the waters of Gilbert Inlet (see map below). The impact force of the rockfall generated a local tsunami that crashed against the southwest shoreline of Gilbert Inlet.
The wave hit with such power that it swept completely over the spur of land that separates Gilbert Inlet from the main body of Lituya Bay. The wave then continued down the entire length of Lituya Bay, over La Chaussee Spit and into the Gulf of Alaska. The force of the wave removed all trees and vegetation from elevations as high as 1720 feet (524 meters) above sea level. Millions of trees were uprooted and swept away by the wave. This is the highest runup ever recorded for a tsunami.
https://geology.com/records/biggest-tsunami.shtml
___________________________
A future landslide-triggered tsunami in Greenland could be a lot bigger than experts first thought
May 13, 2021
https://www.arctictoday.com/a-future-landslide-triggered-tsunami-in-greenland-could-be-a-lot-bigger-than-experts-first-thought/
___________________________
The ‘Ice Tsunami’ That Buried a Whole Herd of Weird Arctic Mammals
January 18, 2018
https://www.theatlantic.com/science/archive/2018/01/the-ice-tsunami-that-entombed-the-arctics-weirdest-mammal/550808/
___________________________
How do higher waves cause more ice clouds? Research expedition into arctic sea explains
September 17, 2021
https://phys.org/news/2021-09-higher-ice-clouds-arctic-sea.html
___________________________
Sulzberger Bay
https://en.wikipedia.org/wiki/Sulzberger_Bay
___________________________
Sea Slime Can Trigger 65-Foot Mega-Tsunamis
February 14, 2018
A layer of ooze made of microscopic fossils may underlie Earth's biggest landslides, a new study finds.
The
biggest landslides on Earth are not on dry land but rather on the
seafloor. For instance, the volcanic eruption of Mount St. Helens in
1980 triggered a collapse of about 0.7 cubic miles (3 cubic kilometers)
of rock, but the Storegga "megaslide" offshore Norway about 8,150 years
ago sent more than 1,000 times more material crashing downward, previous
research found.
Submarine landslides are not just perils for
life underwater; they can trigger catastrophic tsunami that can wreak
havoc on land. For example, prior work suggested that the Storegga
megaslide triggered a tsunami that deluged surrounding coasts with waves
up to 65 feet (20 meters) high.
https://www.livescience.com/61756-sea-slime-mega-tsunamis.html
___________________________
Research Highlight: Internal Tsunamis Can Alter Bodies of Water Profoundly
Aug 15, 2019
https://scripps.ucsd.edu/news/research-highlight-internal-tsunamis-can-alter-bodies-water-profoundly
___________________________
Tsunami threat to UK 'far more serious' than scientists originally thought
Nov 4, 2021
https://www.express.co.uk/news/science/1515677/tsunami-risk-uk-natural-disaster-storegga-slide-science-news-spt
___________________________
Will climate change in the Arctic increase the landslide-tsunami risk to the UK?
2012
https://pure.york.ac.uk/portal/en/projects/will-climate-change-in-the-arctic-increase-the-landslidetsunami-risk-to-the-uk(0ed3be6f-8eb3-45b8-a342-810c8d458804).html
___________________________
Are meteotsunamis an underrated hazard?
2015
https://www.ncbi.nlm.nih.gov/pmc/articles/PMC4608035/
___________________________
Arctic mega-tsunami caused by landslide, not a quake
August 3, 2017
https://www.theweathernetwork.com/us/news/articles/arctic-mega-tsunami-caused-by-landslide-not-a-quake-/84758/
___________________________
Atlas of Submarine Glacial Landforms: Modern, Quaternary and Ancient
15 December 2016
https://www.geolsoc.org.uk/M0046
___________________________
Surficial Geology Mapping and Submarine Landslides in the Arctic Ocean
Apr. 1, 2022
http://ccom.unh.edu/seminars/kai-boggild
___________________________
Submarine landslides along the Siberian termination of the Lomonosov Ridge, Arctic Ocean
2021
https://www.sciencedirect.com/science/article/pii/S0169555X21000878
___________________________
Submarine chutes on the slopes of fjord deltas
26 March 1981
https://www.nature.com/articles/290326a0
___________________________
From the field: studying earthquakes and submarine landslides in Baffin Bay
2018-12-19
https://www.ic.gc.ca/eic/site/063.nsf/eng/97726.html
___________________________
A New Type of Device Used on Submarine Landslides Monitoring
2020
https://appliedmechanics.asmedigitalcollection.asme.org/OMAE/proceedings-abstract/OMAE2020/84379/V06AT06A025/1092842
___________________________
The Hinlopen Slide: A giant, submarine slope failure on the northern Svalbard margin, Arctic Ocean
2006
https://www.sciencedirect.com/science/article/abs/pii/S0012821X06001865
___________________________
Some giant submarine landslides do not produce large tsunamis
07 August 2017
https://agupubs.onlinelibrary.wiley.com/doi/full/10.1002/2017GL074062
___________________________
Largest Landslides in the World
Storegga Slide (Submarine)
The Storegga Slide is a very large submarine landslide that occurred off the coast of southwestern Norway about 8200 years ago.
The slide involved between 600 and 840 cubic miles of sediment and is thought to have occurred as a single event. The water disturbance produced by the slide generated a tsunami with significant run-ups on the west coast of Norway (30 to 35 feet), Scotland (12 to 18 feet), the Shetland Islands (60 to 90 feet), and the Faroe Islands (30 feet). The tsunami is believed to have had a catastrophic impact on people living along the coastlines.
The head of the slide is at the edge of the continental shelf about 60 miles off the coast of Norway. The slide, and an accompanying turbidity current, travelled down the continental slope for a distance of at least 500 miles.
Over much of the slide's travel distance, the topography had a slope of just two degrees or less!
The western portion of the slide encountered a ridge, and that deflected part of the flow to the southwest (which partly explains the strange shape of the slide on the accompanying map).
The slide occurred after glacial melting had deposited enormous thicknesses of sediments on the continental shelf and slope. The weight of these sediments and their geologically rapid deposition are thought to have elevated pore pressure within the sediment.
The slide was likely triggered by an earthquake or failure of methane hydrate deposits at shallow depths within the sediment. Other enormous slides have occurred in this area within the past 500,000 years, with an average recurrence interval of about 100,000 years.
Submarine landslides are difficult to recognize and difficult to map accurately. It is possible that many larger slides have occurred, but we are not aware of them because the evidence has been buried or obscured. It is also possible that larger slides will be found on the ocean floor in the future.
The types of coastal areas that have a high incidence of large slides are where rivers dump large volumes of sediment onto the continental shelf. Intervals of geologic time that have an unusual number of slides are those immediately after significant glacial melting. This is when sea levels rise and large amounts of sediment are rapidly deposited on the continental slope.

Storegga Submarine Landslide: The Storegga Slide is the largest-known submarine landslide. It occurred in the Norwegian Sea about 8200 years ago. The slide triggered a tsunami that produced significant run-ups on the west coast of Norway, Scotland, the Shetland Islands, and the Faroe Islands.
https://geology.com/records/largest-landslide.shtml
___________________________
Tectonic
evolution of strike-slip zones on continental margins and their impact
on the development of submarine landslides (Storegga Slide, northeast
Atlantic)
April 06, 2020
https://pubs.geoscienceworld.org/gsa/gsabulletin/article-abstract/132/11-12/2397/583445/Tectonic-evolution-of-strike-slip-zones-on?redirectedFrom=fulltext
___________________________
New database documents submarine landslides
8-Jul-2015
https://www.eurekalert.org/news-releases/808050
___________________________
On volcanic islands, landslides can trigger giant eruptions
Jan. 19, 2018
https://www.upi.com/Science_News/2018/01/19/On-volcanic-islands-landslides-can-trigger-giant-eruptions/8531516369764/
___________________________
Thaw-triggered landslides are a growing hazard in the warming North
March 30, 2021
https://www.arctictoday.com/thaw-triggered-landslides-are-a-growing-hazard-in-the-warming-north/
___________________________
Evidence of late glacial paleoseismicity from submarine landslide deposits within Lac Dasserat, northwestern Quebec, Canada
20 January 2017
https://www.cambridge.org/core/journals/quaternary-research/article/abs/evidence-of-late-glacial-paleoseismicity-from-submarine-landslide-deposits-within-lac-dasserat-northwestern-quebec-canada/8A3B0EDF83C1C5333804EC9F60239328
___________________________
High Arctic submarine glaciogenic landscapes: their formation and significance
2016
http://www.diva-portal.org/smash/record.jsf?pid=diva2%3A907168&dswid=-4229
___________________________
Numerical modelling of impulse wave generated by fast landslides
02 March 2004
https://onlinelibrary.wiley.com/doi/10.1002/nme.934
___________________________
Large Submarine Landslides on Continental Slopes: Geohazards, Methane Release, and Climate Change
October 2, 2015
https://www.tos.org/oceanography/article/large-submarine-landslides-on-continental-slopes-geohazards-methane-release
___________________________
Clathrate gun hypothesis
https://en.wikipedia.org/wiki/Clathrate_gun_hypothesis
The
clathrate gun hypothesis is a proposed explanation for the periods of
rapid warming during the Quaternary. The idea is that changes in fluxes
in upper intermediate waters in the ocean caused temperature
fluctuations that alternately accumulated and occasionally released
methane clathrate on upper continental slopes. These events would have
caused the Bond Cycles and individual interstadial events, such as the
Dansgaard–Oeschger interstadials.[2]
The hypothesis was supported
for the Bølling-Allerød and Preboreal period, but not for
Dansgaard–Oeschger interstadials,[3] although there are still debates on
the topic.
___________________________
Great Barrier Reef protecting against landslides, tsunamis
November 25, 2015
https://www.sciencedaily.com/releases/2015/11/151125104753.htm
___________________________
Submarine landslides in Pangnirtung Fiord, Baffin Island, Nunavut
2021
https://m.cngo.ca/wp-content/uploads/CNGO-SOA2021-Paper-04-Sedore-et-al.en_.pdf
___________________________
High Arctic submarine glaciogenic landscapes: their formation and significance
2016
https://su.diva-portal.org/smash/get/diva2:907168/FULLTEXT03
___________________________
Distant earthquakes can cause underwater landslides
June 28, 2017
New research finds large earthquakes can trigger underwater landslides thousands of miles away, weeks or months after the quake occurs...
https://watchers.news/2017/06/28/distant-earthquakes-underwater-landslides/
___________________________
Methane emissions in Arctic Ocean have long been overestimated, study claims
January 14, 2020
https://www.rcinet.ca/eye-on-the-arctic/2020/01/14/methane-emissions-in-arctic-ocean-have-long-been-overestimated-study-claims/
___________________________
How much should you worry about an Arctic methane bomb?
2013
Recent
warnings that this greenhouse gas could cost us $60 trillion have
received widespread publicity. But many scientists are skeptical.
https://grist.org/climate-energy/how-much-should-you-worry-about-an-arctic-methane-bomb/
___________________________
Arctic Methane Bubbles Not As Foreboding As Once Feared
January 6, 2014
https://www.npr.org/2014/01/06/260265279/arctic-methane-bubbles-not-as-foreboding-as-once-feared
___________________________
Debunked: The Methane Monster
2020
https://www.scientistswarning.org/2020/07/27/debunked-methane-monster/
___________________________
Atmospheric methane underestimated in future climate projections
12 August 2021
https://iopscience.iop.org/article/10.1088/1748-9326/ac1814
___________________________
The Arctic might be a methane time bomb—or not
Mar 13, 2020
https://www.popsci.com/story/environment/permafrost-release-methane-debate/
___________________________
Thawing Permafrost In Sweden Releases Less Methane Than Feared, Study Finds
May 24, 2022
https://e360.yale.edu/digest/thawing-permafrost-in-sweden-releases-less-methane-than-feared-study-finds
___________________________
Arctic Methane Bomb Scare Was a False Alert
Aug 23, 2020
The Clathrate Gun is a dud.
https://darkedge.substack.com/p/arctic-methane-bomb-scare-was-a-false
___________________________
The moon controls the release of methane in Arctic Ocean
December 14, 2020
https://phys.org/news/2020-12-moon-methane-arctic-ocean.html
___________________________
Can we harness the Arctic’s methane for energy?
September 1, 2020
The
potent greenhouse gas is abundant in the Arctic. Capturing it for
energy could power the region and prevent its release into the
atmosphere.
https://www.arctictoday.com/can-we-harness-the-arctics-methane-for-energy/
___________________________
How to reduce emissions of black carbon and methane in the Arctic
30 October 2020
https://www.arctic-council.org/news/how-to-reduce-emissions-of-black-carbon-and-methane-in-the-arctic/
___________________________
Sinkholes as big as a skyscraper and as wide as a city street open up in the Arctic seafloor
March 17, 2022
Melting permafrost is causing parts of the seafloor to collapse.
https://www.livescience.com/sinkholes-opening-arctic-seafloor
___________________________
Scientists have found hot spots in the Arctic
July 1, 2022
https://globalenergyprize.org/en/2022/07/01/scientists-have-found-hot-spots-in-the-arctic/
___________________________
Startling sinkholes hundreds of feet wide have formed in the Arctic seafloor
March 30th, 2022
https://bgr.com/science/startling-sinkholes-hundreds-of-feet-wide-have-formed-in-the-arctic-seafloor/
___________________________
The Arctic Lakes Where Methane Makes Water Roar in a Violent Rolling Boil
5/27/22
https://www.newsweek.com/methane-arctic-sinkholes-lakes-emissions-climate-change-1710842
___________________________
Why are large sinkholes opening in the Arctic seabed?
Mar 24, 2022
https://www.weforum.org/agenda/2022/03/why-are-large-sinkholes-opening-in-the-arctic-seabed/
___________________________
Hot summers causing arctic sinkholes as permafrost thaws rapidly: study
June 11, 2019
https://www.gi.alaska.edu/news/hot-summers-causing-arctic-sinkholes-permafrost-thaws-rapidly-study
___________________________
Permafrost is thawing so quickly in the Arctic it's leaving sinkholes
February 4, 2020
https://www.cbsnews.com/news/permafrost-thawing-arctic-climate-change-sinkholes/
___________________________
Massive Sinkhole Might Swallow Up Russian Mining Town
November 26th, 2014
On
November 18, giant sinkhole measuring 100 ft across was discovered
about two miles away from a mine in Russia’s Perm region. The gaping
chasm is believed to have already swallowed up several homes and locals
in Solikamsk now fear that the same could happen to their whole town.
The
hole is believed to have appeared after the nearby Solikamsk-2 mine was
flooded. Luckily, workers were evacuated and operations were halted
before the appearance of the chasm, because of the inflow of saline
water. Thousands of miners have now been asked to stay away as
geologists assess the situation.
https://www.odditycentral.com/news/massive-sinkhole-might-swallow-up-russian-mining-town.html
___________________________
Russian scientists say they’ve found the highest-ever ‘flares’ of methane in Arctic waters
October 12, 2019
Russian
scientists studying Arctic waters found the most powerful ever methane
jets shooting up from the seabed to the water’s surface, they said
Friday.
Igor Semiletov, the chief scientist aboard a vessel
carrying 65 scientists on a 40-day research voyage, told CNN via
satellite phone that he found amounts of methane in the air over the
East Siberian Sea up to nine times the global average.
https://www.cnn.com/2019/10/12/us/arctic-methane-gas-flare-trnd/index.html
___________________________
The poisons released by melting Arctic ice
17th June 2019
Pollution, anthrax - even nuclear waste - could be released by global warming
https://www.bbc.com/future/article/20190612-the-poisons-released-by-melting-arctic-ice
___________________________
New Giant 50-Metre Deep Sinkhole Just Opened Up In The Arctic – This One Is Unique Scientists Say
August 30, 2020
https://www.messagetoeagle.com/new-giant-50-metre-deep-sinkhole-just-opened-up-in-the-arctic-this-one-is-unique-scientists-say/
___________________________
Arctic horror warning as melting ice creates 'giant sinkhole' on seabed
Mar 16, 2022
https://www.express.co.uk/news/science/1581208/arctic-melting-horror-giant-sinkhole-beaufort-sea-canada
___________________________
Melting Underwater Arctic Permafrost Forms Giant Sinkholes
March 17th 2022
https://worldwarzero.com/magazine/2022/03/melting-underwater-arctic-permafrost-forms-giant-sinkholes/
___________________________
Giant, 90ft Deep Craters Are Appearing on the Arctic Seafloor
3/14/22
https://www.newsweek.com/ocean-crater-permafrost-thaw-methane-seafloor-1687735
___________________________
Siberian Sinkholes Transition to Lakes
June 28, 2022
https://climatecrocks.com/2022/06/28/siberian-sinkholes-transition-to-lakes/
___________________________
Massive Underwater Domes of Methane Look Set to Blow at Any Moment
06 June 2017
https://www.sciencealert.com/massive-underwater-domes-of-methane-look-set-to-blow-at-any-moment
___________________________
Reindeer herders on Yamal tundra witness likely methane explosion
July 3, 2017
https://www.arctictoday.com/methane-explodes-under-yamal-tundra-creates-another-sinkhole/
___________________________
Siberia’s Permafrost Is Exploding. Is Alaska’s Next?
2015

___________________________
Arctic Sinkholes
2/2/22
In the Arctic, enormous releases of methane, a potent greenhouse gas, threaten the climate.
https://www.pbs.org/wgbh/nova/video/arctic-sinkholes/
___________________________
Wetland Heterogeneity Determines Methane Emissions: A Pan-Arctic Synthesis
2021 Jul 6
https://pubmed.ncbi.nlm.nih.gov/34229435/
___________________________
Climate Change, Arctic Security, and Methane Risks
September 5, 2016

Underwater methane gas plumes, Photo: NOAA Okeanos Explorer Program, 2013
https://www.thearcticinstitute.org/climate-change-arctic-security-methane-risks/
___________________________
Methane Reserve Discovered Deep Beneath Arctic Permafrost; Experts Warn About Climate Feedback Loop if It Escapes
Jan 05 2024
___________________________
Arctic Permafrost Hides Migrating Methane That Could Skyrocket Emissions
14 December 2023
___________________________
NASA Has Discovered Arctic Lakes Bubbling With Methane—and That's Very Bad News
2018
https://www.newsweek.com/arctic-permafrost-lakes-bubbling-methane-nasa-1119624
___________________________
East Siberian Sea Is Boiling With Methane
Oct 09, 2019

Bubbles of methane gas frozen into clear ice in Baikal Lake in Siberia.
Russian scientists on an Arctic expedition have discovered, for the first time, methane “boiling” on the surface of the water that is visible to the naked eye. Forget high-tech detection devices, the methane is so pronounced that it can be scooped from the water in buckets, as Newsweek reported.
The research team from Tomsk Polytechnic University (TPU) found the methane leak east of Bennett Island in the East Siberian Sea. The methane bubbles, which create a boiling appearance, spanned an area over 50 feet, as the Telegraph reported. The concentration of atmospheric methane in that spot was 16 parts per million, more than nine times higher than the atmospheric average.
While the observed area is too small to cause any problems, it does spell trouble for ships if the problem gets worse. Methane leaked into the atmosphere may cause larger swaths of water to boil more violently, which can topple oil and gas rigs in the seas and lead to spills.
The gas, which is not as prominent as carbon dioxide, is 28 times as effective at trapping heat than CO2, making it a dangerous greenhouse gas, according to New Atlas.
While a lot of methane is released into the atmosphere from livestock and from fertilizer run-off, this methane manifested from underwater permafrost degradation, according to a TPU statement.
Permafrost locks up a tremendous amount of methane. If the permafrost gets weaker and allows the methane to seep out, there is potential for further warming, according to IFL Science.
“This is the most powerful seep I have ever been able to observe,” said lead scientist Igor Semiletov, who has participated in 45 Arctic expeditions, in a TPU statement this week. “No one has ever recorded anything similar.”
Observations like those made by Semiletov and his team cause scientists to worry about a positive feedback loop. That is when global temperatures increase, which causes the permafrost to thaw and release greenhouse gasses. Then the greenhouse gases cause more warming, more thawing and more greenhouse gas emissions, according to Newsweek.
This latest discovery follows a troubling summer for Arctic permafrost. At the beginning of the summer, scientists observed that the Canadian Arctic is melting 70 years ahead of schedule, as EcoWatch reported.
Semiletov warned that the sudden release of gases could cause serious harm to infrastructure, which would pollute the seas.
“If we don’t take into account research results about the condition of underwater permafrost, geological catastrophes similar to the (Deepwater Horizon) accident in the Gulf of Mexico could occur during exploratory and commercial activities, which would cause irreparable damage,” he said, as the Telegraph reported.
The Telegraph reported that a recent Russian study discovered that the rate of melting of underwater permafrost has doubled over the last 30 years. The consequences have been massive releases of methane from the sea floor, including from formations of solid methane called hydrates that have the potential to explode if they are destabilized.
Methane has also been credited for causing sinkholes and strange underground bubbles. In 2016, The Siberian Times covered these methane bubbles that have caused the ground to jiggle. This video shows the underground bubbles.
Danish climatologist Jason Box succinctly summarized the concern for scientists five years ago. After Stockholm University scientists noticed methane bubbles rising from the sea floor, Box tweeted, “If even a small fraction of Arctic sea floor carbon is released to the atmosphere, we’re f***ed,” as IFL Science reported.
https://www.ecowatch.com/siberia-sea-boiling-methane-2640900862.html
___________________________
Strange lake belches flammable gas in the high Arctic
April 25, 2019
Lake Esieh is spewing vast amounts of methane — a potent greenhouse gas

Methane,
a highly flammable gas, gets trapped under the ice of some Arctic lakes
in winter. If a hole is punched through the ice, the escaping gas can
be lit into a fireball.
https://www.sciencenewsforstudents.org/article/strange-lake-belches-flammable-gas-high-arctic
___________________________
Massive Underwater Domes of Methane Look Set to Blow at Any Moment
2017
Researchers monitoring a number of massive frozen domes of methane in the Arctic Ocean say there are signs that a series of blowouts could be imminent.
The effect would be reminiscent of prehistoric gas expulsions that occurred tens of thousands of years ago, when the ice sheets were receding rapidly like they are today. That means we could see vast craters collapse into the sea floor, and several deposits of methane released into the atmosphere.
https://www.sciencealert.com/massive-underwater-domes-of-methane-look-set-to-blow-at-any-moment
___________________________
Arctic methane emissions
https://en.wikipedia.org/wiki/Arctic_methane_emissions
Arctic methane emissions contribute to a rise in methane concentrations in the atmosphere. Whilst the Arctic region is one of many natural sources of the greenhouse gas methane, there is nowadays also a human component to this due to the effects of climate change.[2] In the Arctic, the main human-influenced sources of methane are thawing permafrost, Arctic sea ice melting, clathrate breakdown and Greenland ice sheet melting. This methane release results in a positive climate change feedback (meaning one that amplifies warming), as methane is a powerful greenhouse gas.[3] When permafrost thaws due to global warming, large amounts of organic material can become available for methanogenesis and may therefore be released as methane.[4]
Since around 2018, there has been consistent increases in global levels of methane in the atmosphere, with the 2020 increase of 15.06 parts per billion breaking the previous record increase of 14.05 ppb set in 1991, and 2021 setting an even larger increase of 18.34 ppb.[5] However, there is currently no evidence connecting the Arctic to this recent acceleration.[6] In fact, a 2021 study indicated that the methane contributions from the Arctic were generally overestimated, while the contributions of tropical regions were underestimated.[7]
Nevertheless, the Arctic's role in global methane trends is considered very likely to increase in the future. There is evidence for increasing methane emissions since 2004 from a Siberian permafrost site into the atmosphere linked to warming.[8]
Mitigation of CO2 emissions by 2050 (i.e. reaching net zero emissions) is probably not enough to stop the future disappearance of summer Arctic Ocean ice cover. Mitigation of methane emissions is also necessary and this has to be carried out over an even shorter period of time.[9] Such mitigation activities need to be carried out in three main sectors: oil and gas, waste and agriculture. Using available measures this could amount to global reductions of ca.180 Mt/yr or about 45% of the current (2021) emissions by 2030.
Observed values and processes
NOAA annual records for methane concentrations in the atmosphere have been updated since 1984. They show substantial growth during the 1980s, a slowdown in annual growth during the 1990s, a plateau (including some years of declining atmospheric concentrations) in the early 2000s and another consistent increase beginning in 2007. Since around 2018, there has been consistent annual increases in global levels of methane, with the 2020 increase of 15.06 parts per billion breaking the previous record increase of 14.05 ppb set in 1991, and 2021 setting an even larger increase of 18.34 ppb.[5]
Due to the relatively short lifetime of atmospheric methane (7–12 years compared to 100s of years for CO2[12]) its global trends are more complex than those of carbon dioxide.
These trends alarm climate scientists, with some suggesting that they represent a climate change feedback increasing natural methane emissions well beyond their preindustrial levels.[13] However, there is currently no evidence connecting the Arctic to this recent acceleration.[6] In fact, a 2021 study indicated that the role of the Arctic was typically overestimated in global methane accounting, while the role of tropical regions was consistently underestimated.[7] The study suggested that tropical wetland methane emissions were the culprit behind the recent growth trend, and this hypothesis was reinforced by a 2022 paper connecting tropical terrestrial emissions to 80% of the global atmospheric methane trends between 2010 and 2019.[14]
Nevertheless, the Arctic's role in global methane trends is considered very likely to increase in the future. There is evidence for increasing methane emissions since 2004 from a Siberian permafrost site into the atmosphere linked to warming.[8]
Radiocarbon dating of trace methane in lake bubbles and soil organic carbon concluded that 0.2 to 2.5 Pg of permafrost carbon has been released as methane and carbon dioxide over the last 60 years.[15] The 2020 heat wave may have released significant methane from carbonate deposits in Siberian permafrost.[16]
Methane emissions by the permafrost carbon feedback—amplification of surface warming due to enhanced radiative forcing by carbon release from permafrost—could contribute an estimated 205 Gt of carbon emissions, leading up to 0.5 °C (0.9 °F) of additional warming by the end of the 21st century.[17] However, recent research based on the carbon isotopic composition of atmospheric methane trapped in bubbles in Antarctic ice suggests that methane emissions from permafrost and methane hydrates were minor during the last deglaciation, suggesting that future permafrost methane emissions may be lower than previously estimated.
Sources of methane in the Arctic
Large quantities of methane are stored in the Arctic in natural gas deposits, permafrost, and as undersea clathrates. Permafrost and clathrates degrade on warming,[23] thus large releases of methane from these sources may arise as a result of global warming.[24][25][26] Other sources of methane include submarine taliks, river transport, ice complex retreat, submarine permafrost and decaying gas hydrate deposits.[27] Permafrost contains almost twice as much carbon as the atmosphere,[28] with ~20 Gt of permafrost-associated methane trapped in methane clathrates.[29] Permafrost thaw results in the formation of thermokarst lakes in ice-rich yedoma deposits.[30] Methane frozen in permafrost is slowly released as permafrost thaws.
Greenland ice sheet melting
A 2014 study found evidence for methane cycling below the ice sheet of the Russell Glacier, based on subglacial drainage samples which were dominated by Pseudomonadota bacteria. During the study, the most widespread surface melt on record for the past 120 years was observed in Greenland; on 12 July 2012, unfrozen water was present on almost the entire ice sheet surface (98.6%). The findings indicate that methanotrophs could serve as a biological methane sink in the subglacial ecosystem, and the region was, at least during the sample time, a source of atmospheric methane. Scaled dissolved methane flux during the four months of the summer melt season for the Russell Glacier catchment area (1200 km2) was estimated at 990 tonnes CH4. Because this catchment area is representative of similar Greenland outlet glaciers, the researchers concluded that the Greenland Ice Sheet may represent a significant global methane source.[62]
A study in 2016 concluded that methane clathrates may exist below Greenland's and Antarctica's ice sheets, based on past evidence.
Flaring methane from oil and gas operations
ARPA-E has funded a research project from 2021-2023 to develop a "smart micro-flare fleet" to burn off methane emissions at remote locations.[64][65][66]
A 2012 review article stated that most existing technologies "operate on confined gas streams of 0.1% methane", and were most suitable for areas where methane is emitted in pockets.[67]
If Arctic oil and gas operations use Best Available Technology (BAT) and Best Environmental Practices (BEP) in petroleum gas flaring, this can result in significant methane emissions reductions, according to the Arctic Council.
___________________________
We discovered new methane pingos in the Barents Sea
August 2020
https://cage.uit.no/2020/08/13/we-discovered-new-methane-mounds/
___________________________
Fact-Check: is an Arctic “Methane Bomb” about to go off?
2019

https://climatetippingpoints.info/2019/05/13/fact-check-is-an-arctic-methane-bomb-about-to-go-off/
___________________________
How Methane Affects the Arctic – Infographic
April 25, 2016
https://www.thearcticinstitute.org/how-methane-affects-the-arctic-infographic/
___________________________
NEWS: Scientists discover vast methane plumes escaping from Arctic seafloor
1 Aug 2014
http://arp.arctic.ac.uk/news/2014/aug/1/news-scientists-discover-vast-methane-plumes-escap/index.html
___________________________
Methane much more sensitive to global heating than previously thought – study
2022
Greenhouse gas has undergone rapid acceleration and scientists say it may be due to atmospheric changes
https://www.theguardian.com/environment/2022/jul/05/global-heating-causes-methane-growth-four-times-faster-than-thought-study
___________________________
Groundwater discharge as a driver of methane emissions from Arctic lakes
27 June 2022
https://www.nature.com/articles/s41467-022-31219-1
___________________________
Methane Is Blowing More Holes In The Arctic (Study)
February 11, 2021
https://www.lintelligencer.com/methane-is-blowing-more-holes-in-the-arctic-study-12714-2021/
___________________________
Unexpected Future Boost of Methane Possible from Arctic Permafrost
Aug 17, 2018
https://www.nasa.gov/feature/goddard/2018/unexpected-future-boost-of-methane-possible-from-arctic-permafrost
___________________________
Nova episode explores Arctic methane explosions
January 31, 2022

A member of an expedition group stands on the edge of a newly formed crater on the Yamal peninsula in northern Siberia in November 2014.
https://www.gi.alaska.edu/news/nova-episode-explores-arctic-methane-explosions
___________________________
Alaska permafrost thaw is clue in mystery of Arctic methane explosions
February 3, 2022
https://www.alaskapublic.org/2022/02/03/alaska-permafrost-thaw-is-clue-in-mystery-of-arctic-methane-explosions/
___________________________
Sea 'Boiling' with Methane Discovered in Siberia: 'No One Has Ever Recorded Anything like This Before'
10/8/19
https://www.newsweek.com/methane-boiling-sea-discovered-siberia-1463766
___________________________
Diverse sediment microbiota shape methane emission temperature sensitivity in Arctic lakes
05 October 2021
https://www.nature.com/articles/s41467-021-25983-9
___________________________
Subsea Permafrost and Associated Methane Hydrate on the U.S. Arctic Ocean Margin
April 30, 2017
https://www.usgs.gov/programs/cmhrp/news/subsea-permafrost-and-associated-methane-hydrate-us-arctic-ocean-margin
___________________________
Increase in atmospheric methane set another record during 2021
Carbon dioxide levels also record a big jump
April 7, 2022
https://www.noaa.gov/news-release/increase-in-atmospheric-methane-set-another-record-during-2021
___________________________
Arctic methane deposits 'starting to release', scientists say
27 Oct 2020
Exclusive:
expedition says preliminary findings indicate that new source of
greenhouse gas off East Siberian coast has been triggered
https://www.theguardian.com/science/2020/oct/27/sleeping-giant-arctic-methane-deposits-starting-to-release-scientists-find
___________________________
Glendonites track methane seepage in Mesozoic polar seas
June 01, 2017
https://pubs.geoscienceworld.org/gsa/geology/article-abstract/45/6/503/207930/Glendonites-track-methane-seepage-in-Mesozoic?redirectedFrom=fulltext
___________________________
There's So Much Methane in This Arctic Lake That You Can Light the Air on Fire
September 27, 2018
https://www.livescience.com/63688-methane-lake-farts-fire.html
___________________________
Tracking Methane Emissions from Arctic Tundra
Dec 1, 2016
https://www.globalchange.gov/about/highlights/2017-tracking-methane-emissions-arctic-tundra
___________________________
Increased Methane Gas Levels Found Over Cracks in Arctic Sea Ice
April 24, 2012
https://scitechdaily.com/increased-methane-gas-levels-found-over-cracks-in-arctic-sea-ice/
___________________________
'This
Is Truly Terrifying': Scientists Studying Underwater Permafrost Thaw
Find Area of the Arctic Ocean 'Boiling With Methane Bubbles'
October 9, 2019
The
lead researcher said that "this is the most powerful" methane seep he
has ever seen. "No one has ever recorded anything similar."
https://www.commondreams.org/news/2019/10/09/truly-terrifying-scientists-studying-underwater-permafrost-thaw-find-area-arctic
___________________________
Lasers and Bubbles: Solving the Arctic’s Methane Puzzle
June 18, 2020
https://blogs.nasa.gov/earthexpeditions/2020/06/18/lasers-and-bubbles-solving-the-arctics-methane-puzzle/
___________________________
Nitrous oxide and methane in a changing Arctic Ocean
10 October 2021
https://link.springer.com/article/10.1007/s13280-021-01633-8
___________________________
Arctic Carbon: carbon dioxide and methane
https://atmoscomp.ldeo.columbia.edu/research-projects/arctic-carbon-carbon-dioxide-and-methane
__________________________
Arctic dipole anomaly
https://en.wikipedia.org/wiki/Arctic_dipole_anomaly
The Arctic dipole anomaly is a pressure pattern characterized by high pressure on the arctic regions of North America and low pressure on those of Eurasia.[1] This pattern sometimes replaces the Arctic oscillation and the North Atlantic oscillation.[2] It was observed for the first time in the first decade of 2000s and is perhaps linked to recent climate change.[3] The Arctic dipole lets more southern winds into the Arctic Ocean resulting in more ice melting.[1] The summer 2007 event played an important role in the record low sea ice extent which was recorded in September.[2] The Arctic dipole has also been linked to changes in arctic circulation patterns that cause drier winters in Northern Europe, but much wetter winters in Southern Europe and colder winters in East Asia, Europe and the eastern half of North America.
___________________________
The Arctic dipole: The atmospheric pattern shaping our future climate
09-04-2023
https://www.earth.com/news/the-arctic-dipole-the-atmospheric-pattern-shaping-our-future-climate/
___________________________
Extreme Melting of Arctic Permafrost May Free Trapped Ancient Viruses, Radioactive Waves
Oct 06 2021
The latest climate study revealed that the decrease of ice in the Arctic region called the permafrost causes the sheet itself to release hazardous compositions such as harmful chemicals and radioactive materials that was accumulated since the Cold War. the melting permafrost could also emit microorganisms such as viruses that were trapped in the icy structure for a very long time.
Microbes in Arctic Permafrost
Microbes, according to the latest study, are proven to exist in the depths of the Arctic permafrost. The structures were able to accumulate and bury many types of organisms throughout the thousands of years that have passed by. Before the confirmation of the microbes in the permafrost, several toxins and other deadly compositions were already recorded back in the previous studies on the Arctic.
For example, pollutants like mercury, DDT, and arsenic compounds are currently present in the sheets underground. In addition, there are scattered remains of fallout impacts from nuclear explosions back in the height of the said chemical. Alongside these dangers, ancient microbes could also be emitted out of the melted permafrost. The worse thing to happen is that if these viruses escaped from their slumber, we may not have enough data to create resistance such as antibiotics to counter them.
Permafrost is the underground layer that has been secluded from the outer surface of the observable, snowy terrain, and had been exposed to extremely low temperatures that are enough to constantly freeze the dirt for two or more years. According to the National Snow and Ice Data Center or NSIDC, permafrost covers up to 23 million square kilometers of area in the northern ice sheet. Its thickness is also scaled from a mere 1 meter to a whopping 1 kilometer.
___________________________
Permafrost Thaw in a Warming World: The Arctic Institute’s Permafrost Series Fall-Winter 2020
October 1, 2020

Permafrost degradation is a major threat to Arctic communities and ecosystems, but it also extends beyond the region, as it contributes to climate change and the positive feedback loop which threatens to push our planet into an environmental crisis. The Arctic Institute’s new series examines permafrost degradation and its implications from an interdisciplinary perspective. Photo: United States National Parks Service Climate Change Response
___________________________
GET AWAY FROM THE EDGE: The deepest, darkest holes on the planet including the ‘Door to Hell’ and Devil’s Sinkhole
29 Aug 2019
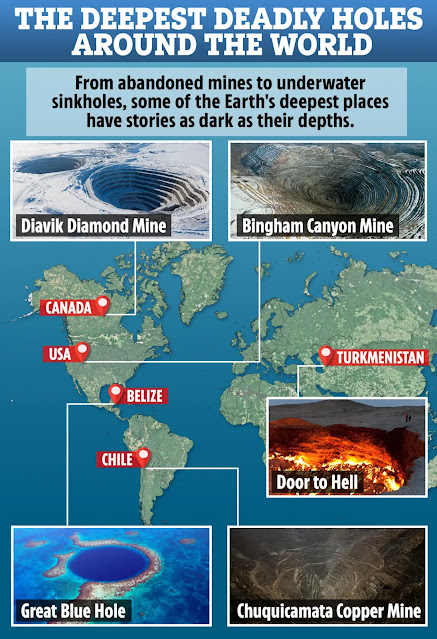
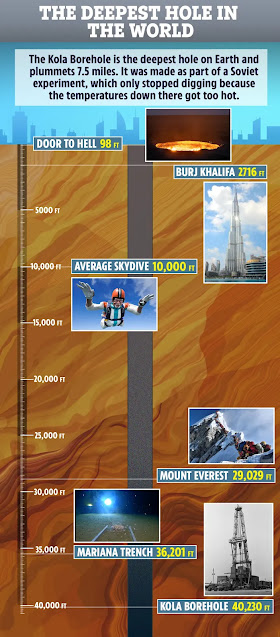
https://www.thesun.co.uk/news/9803974/deepest-darkest-places-door-hell-toxic-mine/
___________________________
Dramatic transformation of the Arctic landscape may be permanent
December 09, 2020
Zombie fires
Persistent heat and dryness also sparked more than 700 wildfires that burned over 3,800 square miles (9,800 square kilometers) in the northern latitudes, according to the ARC. Fire seasons in the region are variable, but since the beginning of the 21st century, years with significant fire damage in the Arctic have become more common, said ARC co-author Alison York, an expert in Alaska fire ecology at the IARC and coordinator of the Alaska Fire Science Consortium.
Arctic fires are fueled not only by trees, but also by material known as duff — layers of dead plants and moss. Extreme cold in the Arctic slows decomposition, so dead plant material breaks down slowly and builds up in layers on the ground, York said at AGU. Duff stores about 30% to 40% of global soil carbon and insulates Arctic permafrost, but warm conditions can make duff highly flammable. When duff ignites, even if the flames die down the material can smolder all winter, flaring to life again in the summer. These so-called zombie fires play a key role in stoking destructive fire seasons in northern latitudes, and 2020 was "a record fire year" within the Arctic Circle, with many of these "undead" fires and millions of acres burned, York said.

On June 21, 2020, the Himawari-8 satellite viewed the ongoing Siberian fires above the Arctic Circle. "The main causes,” said a translated version of Russia's Federal Forestry Agency press release, "are human and thunderstorm factors."
https://www.livescience.com/agu-arctic-report-card-2020.html
___________________________
Wildfires Are Digging Carbon-Spewing Holes in the Arctic
Jan 4, 2022
Soaring
temperatures are rapidly thawing permafrost, leading to huge sinkholes
called thermokarst. Northern fires are making the situation even worse.
https://www.wired.com/story/wildfires-are-digging-carbon-spewing-holes-in-the-arctic/
___________________________
Canada in the Arctic - Arctic Oil and Gas: Reserves, Activities, and Disputes
April 25, 2012
https://www.thearcticinstitute.org/canada-arctic-oil-gas-part1/
___________________________
National Guard, Canada conduct tactical Arctic insertion
March 20, 2023
https://www.army.mil/article/265003/national_guard_canada_conduct_tactical_arctic_insertion
___________________________
Canadian and U.S. military conduct first-ever joint platoon movement on arctic ice
March 19, 2023
https://alert5.com/2023/03/19/canadian-and-u-s-military-conduct-first-ever-joint-platoon-movement-on-arctic-ice/
___________________________
Biden’s green light to drill oil in Alaska threatens Indigenous Canadians
March 21, 2023
https://rabble.ca/politics/canadian-politics/bidens-green-light-to-drill-oil-in-alaska-threatens-indigenous-canadians/
___________________________
Reports: Canada Found, Retrieved Chinese Spy Buoys in Arctic
March 01, 2023
https://www.voanews.com/a/reports-canada-found-retrieved-spy-buoys-in-arctic/6985742.html
___________________________
Trump says the US needs to protect Greenland from China. Are his fears overblown?
May 6, 2025
https://www.cnn.com/2025/05/06/china/china-greenland-footprint-us-suspicion-intl-hnk
___________________________
The tortuous path of China’s win-win strategy in Greenland
March 24, 2020
https://www.thearcticinstitute.org/tortuous-path-china-win-win-strategy-greenland/
___________________________
Greenland Minerals sitting on rare earths sleeping giant
2018
Greenland Minerals and Energy is manoeuvring itself to be one of the
world’s largest suppliers of rare earth minerals outside of China. The
company is looking to ride the clean energy wave with its elephant sized
rare earths play in Greenland and it has already managed to lasso a
major Chinese rare earths investor with a balance sheet worth around
$4.5b.
https://www.businessnews.com.au/article/Greenland-Minerals-sitting-on-rare-earths-sleeping-giant
___________________________
Greenland’s Rare-Earth Minerals Make It Trump’s Treasure Island
2019
https://www.bloomberg.com/news/features/2019-08-28/greenland-s-rare-earth-minerals-make-it-trump-s-treasure-island
___________________________
Greenland Rejects Huge Rare-Earth Mine in National Elections
April 7, 2021
The
Arctic island is a battleground of the future as companies and nations
vie to extract its massive deposits of the stuff needed to make F-35
fighter jets, electric cars and smartphones. In a crucial election,
Greenlanders voted for a party opposed to the construction of a massive
rare-earth mine.
https://www.courthousenews.com/greenland-rejects-huge-rare-earth-mine-in-national-elections/
___________________________
Alaska judge dismisses Trump-era approvals for Arctic oil project
August 22, 2021
https://www.jurist.org/news/2021/08/alaska-judge-dismisses-trump-era-approvals-for-arctic-oil-project/
-___________________________
Chinese firms ‘told to stop work on Russian Arctic LNG 2 project’ due to EU sanctions
20 May, 2022
https://www.scmp.com/news/china/diplomacy/article/3178572/chinese-firms-told-stop-work-russian-arctic-lng-2-project-due
___________________________
Trump administration rushes to sell oil rights in Arctic National Wildlife Refuge
November 16, 2020
https://www.alaskapublic.org/2020/11/16/trump-administration-rushes-to-sell-oil-rights-in-arctic-national-wildlife-refuge/
___________________________
Major Oil Companies Take A Pass On Controversial Lease Sale In Arctic Refuge
January 6, 2021
https://www.npr.org/2021/01/06/953718234/major-oil-companies-take-a-pass-on-controversial-lease-sale-in-arctic-refuge
___________________________
Denmark stakes claim over North Pole and a large chunk of the Arctic
17 December 2014
https://www.downtoearth.org.in/news/denmark-stakes-claim-over-north-pole-and-a-large-chunk-of-the-arctic-47870
___________________________
Danish king arrives in Greenland as Trump eyes strategic Arctic island
April 29, 2025
___________________________
Trump administration plans for oil deep in Arctic Ocean, where US claim has yet to be recognized
May 5, 20205
___________________________
Trump administration takes steps to expand Arctic drilling, including in contentious wildlife refuge
March 20, 2025
https://thehill.com/policy/energy-environment/5205995-trump-administration-arctic-drilling/
___________________________
Trump to Canadian PM: ‘Never say never’ on Canada becoming 51st state
May 6, 2025
https://thehill.com/homenews/administration/5285396-canada-not-for-sale-trump/
___________________________
To Drill or Not to Drill: Arctic Petroleum Development and Environmental Concerns
March 27, 2012
https://www.thearcticinstitute.org/arctic-petroleum-development-environmental-concern/
___________________________
The Debate Over Offshore Drilling in the Arctic: Pros and Cons
2024-07-04
The Cons of Offshore Drilling in the Arctic
The potential negative impact of Arctic offshore drilling far exceeds the possibility of large-scale oil spills. The Arctic ecosystem is relatively fragile and intricately interconnected, bearing enormous pressure from climate change. Below is a detailed introduction to the environmental threats brought by Arctic drilling:
- Disruption of Wildlife Migrations: Seismic exploration, drilling activities, and increased ship traffic can disrupt the established migration patterns of whales, walruses, and polar bears. These disruptions can lead to difficulties finding food and breeding grounds, jeopardizing the survival of already vulnerable populations.
- Impact on Food Chain: Oil spills and other forms of pollution can contaminate the Arctic food chain, harming everything from plankton at the base to fish, marine mammals, and ultimately birds that feed on these animals. The long lifespan of some Arctic species leads to bioaccumulation of contaminants, posing long-term health risks.
- Threat to Sensitive Habitats: The Arctic seafloor holds unique ecosystems like coral reefs and sponge gardens that are slow-growing and easily damaged. Drilling activities and infrastructure can physically destroy these habitats or introduce harmful pollutants that disrupt their delicate balance.
- Exacerbating Climate Change: The
very act of extracting and burning fossil fuels contributes to climate
change, which is already causing a rapid thaw of Arctic sea ice. This
melting ice opens up more areas for potential drilling, creating a
vicious cycle that further accelerates warming and threatens the entire
Arctic ecosystem.
Beyond the immediate environmental damage, there are also concerns about the long-term viability of relying on Arctic oil and gas. The remoteness of the region makes any cleanup efforts extremely challenging, and the harsh climate conditions limit the drilling window each year. Additionally, with the global push towards renewable energy sources, the long-term economic viability of Arctic drilling is increasingly uncertain.
Real-World Examples of Offshore Drilling in the Arctic
The Arctic presents a complex picture when it comes to offshore drilling. Here’s a closer look at real-world examples that highlight the challenges and approaches taken by different nations:
Alaska (United States): The Prudhoe Bay oilfield on Alaska’s North Slope has been a significant source of oil production since the 1970s. However, its peak production is long past, and new drilling efforts face strong opposition due to environmental concerns. The controversial Arctic National Wildlife Refuge (ANWR) holds the potential for vast oil reserves, but opening it for drilling sparks debates about protecting a pristine wilderness crucial to migratory caribou herds.
Russia: Russia is a dominant player in Arctic oil and gas. Its extensive operations in the Barents and Pechora Seas contribute significantly to the nation’s energy production. However, a 2011 accident on the Kolskaya drilling platform resulted in a major oil spill, raising concerns about Russia’s safety record and environmental regulations.
Norway: Norway has taken a more measured approach to Arctic drilling. Balancing resource development with environmental responsibility, they established stricter regulations and invested heavily in safety technology. The Snøhvit gas field in the Barents Sea showcases this approach, utilizing subsea production systems to minimize environmental impact on the surface.
Greenland: This autonomous territory within the Kingdom of Denmark holds a unique position. While initially granting exploration licenses, Greenland’s parliament voted in 2022 to halt all new oil and gas exploration due to climate change concerns. This decision reflects a growing global shift towards prioritizing sustainability over fossil fuel extraction in the Arctic.
These examples showcase the diverse approaches taken by Arctic nations. While some prioritize economic benefits and energy security, others prioritize environmental protection and align development with climate change considerations. The future of Arctic drilling will likely involve a delicate balancing act between these competing interests.
https://www.esimtech.com/the-debate-over-offshore-drilling-in-the-arctic-pros-and-cons.html
___________________________
U.S. House panel quietly advances Arctic drilling and other Alaska oil developments
May 7, 2025
___________________________
Increase in acidifying water in the western Arctic Ocean
27 February 2017
Abstract
The uptake of anthropogenic CO2 by the ocean decreases seawater pH and carbonate mineral aragonite saturation state (Ωarag), a process known as Ocean Acidification (OA). This can be detrimental to marine organisms and ecosystems1,2. The Arctic Ocean is particularly sensitive to climate change3 and aragonite is expected to become undersaturated (Ωarag < 1) there sooner than in other oceans4. However, the extent and expansion rate of OA in this region are still unknown. Here we show that, between the 1990s and 2010, low Ωarag waters have expanded northwards at least 5°, to 85° N, and deepened 100 m, to 250 m depth. Data from trans-western Arctic Ocean cruises show that Ωarag < 1 water has increased in the upper 250 m from 5% to 31% of the total area north of 70° N. Tracer data and model simulations suggest that increased Pacific Winter Water transport, driven by an anomalous circulation pattern and sea-ice retreat, is primarily responsible for the expansion, although local carbon recycling and anthropogenic CO2 uptake have also contributed. These results indicate more rapid acidification is occurring in the Arctic Ocean than the Pacific and Atlantic oceans5,6,7,8, with the western Arctic Ocean the first open-ocean region with large-scale expansion of ‘acidified’ water directly observed in the upper water column.
https://www.nature.com/articles/nclimate3228
___________________________
Accumulation processes of trace metals into Arctic sea ice: distribution of Fe, Mn and Cd associated with ice structure
2018
https://www.sciencedirect.com/science/article/abs/pii/S0304420318301713
___________________________
Diatoms and the Ecological Conditions of Their Growth in Sea Ice in the Arctic Ocean
20 May 1966
Abstract
https://www.science.org/doi/10.1126/science.152.3725.1089
___________________________
A Massive Surge in Plankton Has Researchers Pondering the Future of the Arctic
September 9, 2020
Phytoplankton blooms are growing faster and thicker than ever seen before—with potential consequences for climate, wildlife, and the fishing industry.
Betcha a nickel you don’t know what plankton is. Less than 9 percent of college-educated Americans do, according to a very unscientific survey of semi-randomly selected people I happen to know (n=12). That’s a shame, because plankton is an incredibly important part of the marine ecosystem, and it’s behaving in increasingly weird ways. A recent study from researchers at Stanford University shows that the growth rate of a type of plankton called phytoplankton in the Arctic Ocean has increased 57 percent between 1998 and 2018, with uncertain implications for animals higher up the food chain (which is most of them, including us).
Plankton, for the 91.7 percent of you who probably don’t know, is not a specific type of creature. It’s any marine organism that drifts with the currents rather than swimming under its own power. This is a very broad category that includes mostly single-celled organisms, but also animals, such as krill and jellyfish. There are also species that are plankton at some stages of their lives but not others. Think of fish eggs or starfish larvae, which cease to be plankton once their inhabitants hatch or grow large enough to move on from their drifter lifestyle.
Plankton that must eat to survive are called zooplankton, while the plant-like plankton that contain chlorophyll and generate their own energy are phytoplankton. Through photosynthesis, they combine the sun’s energy with carbon dioxide taken from the atmosphere and other nutrients to grow and multiply. Thus, phytoplankton, such as algae, form the base of the ocean food chain, and a large supply of them is vital to the health of any ocean ecosystem. A crude but mostly accurate way of thinking about the marine food web would be as follows: Phytoplankton typically get eaten by zooplankton, which typically get eaten by small fish, which then typically get eaten by bigger fish and mammals, and so on.
It would seem like good news, therefore, that the Arctic Ocean is producing larger and larger phytoplankton blooms. By calculating decades of data taken from satellite imagery and collected from ice-breaking ships, the Stanford researchers have found that productivity at the base level of this ocean ecosystem has increased by more than half over 20 years. This is an incredible surge in phytoplankton—one that provides more food and increases the ocean’s uptake of carbon dioxide, a greenhouse gas. All of this sounds like it could be a boon for both biodiversity and climate change mitigation.
But everything isn’t so rosy. The initial expansion of phytoplankton in the Arctic was a symptom of climate change, not a potential cure. The Arctic is warming twice as fast as the rest of the planet, and melting sea ice has provided more open water for plankton to grow in for longer amounts of time during the year.
Now here comes the weirdest part. According to the researchers, sea ice loss is no longer continuing to drive the Arctic plankton boom. Rather, an influx of nutrients into the Arctic Ocean—coming in from other oceans, the researchers suspect—is allowing the phytoplankton to grow more prolifically in the same amount of water, creating what the scientists call “a thickening algae soup.”
Sounds delicious, especially if you’re zooplankton. But this soup comes with a side of several complications. Healthy food webs depend on more than sheer volumes of food. For instance, the ways in which species interact and the timing of those interactions can be crucial, and scientists have previously documented dramatic shifts when Arctic phytoplankton bloom. A larger amount of food isn’t better if it comes at a time when the ecosystem’s other members aren’t able to eat it. Back in 2010, a study showed that phytoplankton were becoming available 50 days earlier in the spring than they historically should have been. That’s a problem because the marine ecosystem is synced to the beginning of algae season. Zooplankton populations peak shortly after the phytoplankton bloom, taking advantage of the bounty, and small fish don’t come in to feast until after that. Disruptions in this chronology can throw the relationships between some species completely out of whack, potentially affecting their ability to eat, breed, and survive, and influencing what fish stocks might be available at what times.
“We knew the Arctic had increased production in the last few years, but it seemed possible the system was just recycling the same store of nutrients,” says Kate Lewis, lead author of the new study, in a press release. “Our study shows that’s not the case. Phytoplankton are absorbing more carbon year after year as new nutrients come into this ocean. That was unexpected, and it has big ecological impacts.”
Furthermore, the authors note, any increase in the Arctic’s ability to remove carbon dioxide from the atmosphere is essentially small potatoes when it comes to warding off climate change. “[The Arctic] is taking in a lot more carbon than it used to take in,” says senior author Kevin Arrigo, “but it’s not something we’re going to be able to rely on to help us out of our climate problem.” Together, all of the world’s oceans absorb somewhere around 30 percent of the carbon dioxide we release through the burning of fossil fuels. The Arctic does its part, but given the current high rates of global emissions, it won’t be enough. This carbon absorption also comes with the steep costs of ocean acidification, which has its own set of devastating impacts on ocean life, including on plankton.
What’s taking place in the Arctic Ocean is another example of global weirding—strange things happening to our planet triggered by humanity’s burning of enormous quantities of fossil fuels. With their thickening soup, phytoplankton are sending a message that big changes are afoot. We’d be wise to pay attention to the little guys.
https://www.nrdc.org/stories/massive-surge-plankton-has-researchers-pondering-future-arctic
___________________________
Leads in Arctic pack ice enable early phytoplankton blooms below snow-covered sea ice
2024
https://epic.awi.de/id/eprint/43265/
___________________________
Glacial isostatic adjustment as a control on coastal processes: An example from the Siberian Arctic
1 August 2007
The
geomorphology of the western Siberian Arctic coast represents a
significant departure from the global trend of Holocene delta formation
by major rivers. The Ob9 and Yenisei Rivers in western Siberia drain
into the Arctic Ocean via estuaries ∼900 and ∼500 km long, respectively.
Eastern Siberian rivers such as the Lena, Indigirka, and Kolyma
terminate at significant marine deltas. We show that this spatial
variation in coastal geomorphology can be explained by the glacial
isostatic adjustment of the region. The development and collapse of a
peripheral bulge in western Siberia, associated with the glaciation and
subsequent deglaciation of the Eurasian ice sheets, led to a distinct
spatial variation in sea-level change that continues to this day. In
particular, since the marked decrease in global-scale ice melting ca. 7
ka, our model predicts a sea-level rise at the mouth of the Ob9 River of
∼14 m, compared to a rise of ∼6 m at the mouth of the Lena River, which
ceased at 3 ka. We propose that the enhanced sea-level rise in the
western Siberian Arctic associated with peripheral bulge subsidence has
prevented the establishment of marine deltas at the mouths of the Ob9
and Yenisei Rivers. We conclude that regional variations in relative
sea-level change driven by glacial isostatic adjustment should be
considered when interpreting large-scale coastal morphology and deltaic
stratigraphy, which is normally assumed to correlate with eustatic
fluctuations.
___________________________
Workshop on Glacial Isostatic Adjustment, Ice Sheets, and Sea-level Change
2019
https://www.arcus.org/events/arctic-calendar/29197
___________________________
Mass balance of the Greenland Ice Sheet from 1992 to 2018
10 December 2019
https://www.nature.com/articles/s41586-019-1855-2
___________________________
Glacial Isostatic Adjustment (GIA) in Greenland: a Review
05 July 2016
Abstract
This review provides updated estimates of the glacial isostatic adjustment (GIA) component of present-day uplift at a suite of Global Navigation Satellite System (GNSS) sites in Greenland using the most recently published global ice sheet deglaciation histories. For some areas of Greenland (e.g. the north-west and north-east), the use of GNSS to estimate elastic uplift rates resulting from contemporary mass balance changes is more affected by the choice of GIA correction applied compared to other regions (e.g. central-west). The contribution of GIA to GRACE estimates of mass imbalance is becoming increasingly insignificant for large areas of Greenland as it enters a period of extreme warmth, and in total represents <5 % contribution (−6 to +10 Gt/year) to the observed Greenland-wide mass trends over the last decade. However, differences between deglacial histories and uncertainties in their assumed viscoelastic Earth structure combine to result in significantly different region-by-region estimates of GIA.
https://link.springer.com/article/10.1007/s40641-016-0040-z
___________________________
Evaluating Greenland glacial isostatic adjustment corrections using GRACE, altimetry and surface mass balance data
15 January 2014
https://iopscience.iop.org/article/10.1088/1748-9326/9/1/014004
___________________________
Total isostatic response to the complete unloading of the Greenland and Antarctic Ice Sheets
06 July 2022
Abstract
The land surface beneath the Greenland and Antarctic Ice Sheets is isostatically suppressed by the mass of the overlying ice. Accurate computation of the land elevation in the absence of ice is important when considering, for example, regional geodynamics, geomorphology, and ice sheet behaviour. Here, we use contemporary compilations of ice thickness and lithospheric effective elastic thickness to calculate the fully re-equilibrated isostatic response of the solid Earth to the complete removal of the Greenland and Antarctic Ice Sheets. We use an elastic plate flexure model to compute the isostatic response to the unloading of the modern ice sheet loads, and a self-gravitating viscoelastic Earth model to make an adjustment for the remaining isostatic disequilibrium driven by ice mass loss since the Last Glacial Maximum. Feedbacks arising from water loading in areas situated below sea level after ice sheet removal are also taken into account. In addition, we quantify the uncertainties in the total isostatic response associated with a range of elastic and viscoelastic Earth properties. We find that the maximum change in bed elevation following full re-equilibration occurs over the centre of the landmasses and is +783 m in Greenland and +936 m in Antarctica. By contrast, areas around the ice margins experience up to 123 m of lowering due to a combination of sea level rise, peripheral bulge collapse, and water loading. The computed isostatic response fields are openly accessible and have a number of applications for studying regional geodynamics, landscape evolution, cryosphere dynamics, and relative sea level change.
https://www.nature.com/articles/s41598-022-15440-y
___________________________
Constraint
of glacial isostatic adjustment in the North Sea with geological
relative sea level and GNSS vertical land motion data
07 July 2021
SUMMARY
In this study, we focus on improved constraint of the glacial isostatic adjustment (GIA) signal at present-day, and its role as a contributor to present-day sea level budgets. The main study area extends from the coastal regions of northwestern Europe to northern Europe. Both Holocene relative sea level (RSL) data as well as vertical land motion (VLM) data are incorporated as constraints in a semi-empirical GIA model. 71 geological rates of GIA-driven RSL change are inferred from Holocene proxy data and 108 rates of vertical land motion from GNSS provide an additional measure of regional GIA deformation. Within the study area, the geological RSL data complement the spatial gaps of the VLM data and vice versa. Both data sets are inverted in a semi-empirical GIA model to yield updated estimates of regional present-day GIA deformations. A regional validation using tide gauges is presented for the North Sea, where the GIA signal may be complicated by lateral variations in Earth structure and existing predictions of regional and global GIA models show discrepancies. The model validation in the North Sea region suggests that geological data are needed to fit independent estimates of GIA-related RSL change inferred from tide gauge rates, indicating that geological rates from Holocene data do provide an important additional constraint for data-driven approaches to GIA estimation.
https://academic.oup.com/gji/article-abstract/227/2/1168/6316780?login=false
___________________________
Glacial isostatic adjustment directed incision of the Channeled Scabland by Ice Age megafloods
December 15, 2021
Significance
https://www.pnas.org/doi/10.1073/pnas.2109502119
___________________________
On Some Properties of the Glacial Isostatic Adjustment Fingerprints
5 September 2019
Abstract
https://www.mdpi.com/2073-4441/11/9/1844
___________________________
Arctic Circle
https://en.wikipedia.org/wiki/Arctic_Circle
___________________________
Bridgeman Island Volcano
Updated: May 16, 2025
Background
https://www.volcanodiscovery.com/bridgeman-island.html
___________________________
Greenland lost the most ice from iceberg calving and ocean melt over the past year
2021
https://www.washingtonpost.com/weather/2021/11/23/greenland-ice-melt-2021-recap/
___________________________
The Hidden Environmental Toll of Mining the World’s Sand
February 5, 2019
By far the largest mining endeavor globally is digging up sand, mainly for the concrete that goes into buildings. But this little-noticed and largely unregulated activity has serious costs — damaging rivers, wreaking havoc on coastal ecosystems, and even wiping away entire islands.
China is estimated to consume more sand in three years than the U.S. consumed in the entire 20th century.
In Cambodia, researching land grabs in the western province of Koh Kong, I drove past three local estuaries where dredgers, organized by real estate tycoon and politician Ly Yong Phat, were extracting vast amounts of sand for land reclamation projects in faraway Singapore. Sand mining concessions in national parks and internationally recognized wetlands were killing mangroves and sea grasses that were home to Irrawaddy dolphins, green turtles, and hairy-nosed otters, one of the world’s rarest mammals.
Sand and gravel are mined on a huge scale around the world. But few global data are collected on this activity. The United Nations Environment Program (UNEP) estimated that the total exceeds 40 billion tons a year. But its estimate had to be based on a proxy: cement manufacture. Every ton of cement requires six to seven tons of sand and gravel to make concrete.
Concrete is the predominant use for sand. But sand also makes up 90 percent of asphalt on roads. It also is used for land reclamation in places like Singapore. And it is widely used in industries such as glass manufacturing and fracking, where it forms part of the gritty mixture injected underground to fracture shale deposits and release natural gas or oil.
Around 60 percent of sand use worldwide is in China, which is estimated to consume more sand in three years than the U.S. consumed in the entire 20th century. Yet despite the vast scale, ubiquity, and environmental footprint of sand mining, licensing is often delegated to local authorities; environmental impact assessments are rare; laws are routinely flouted; and there are no global treaties governing its extraction, use or trade, or even to promote good practice.
Not all sand is the same. Some is refined to extract high concentrations of rare earths or metals. I reported here two years ago on the assassination of an environmental and community activist in South Africa’s Eastern Cape, who was fighting plans by an Australian company to excavate local sand dunes for titanium.
But even regular sand is not suitable for all uses. Desert sand, for instance, is mostly useless for construction, because its grains have usually been rounded by wind erosion and do not bind well in concrete. Miners mostly target sand dug from pits on land, dredged from riverbeds, or scooped up from the seabed.
Marine sand is less good for concrete, however, because it has to be washed clean of salt that could otherwise corrode metal in structural building reinforcements. That makes river sand the source of first resort — even though mining it is, according to the environmental group WWF, usually the most environmentally destructive. Typically, floating platforms employ buckets on conveyor belts to gouge sand from riverbeds. Such crude methods, though cheap, can drastically alter river flow, erode riverbanks, dry up tributaries, lower water tables, and trash wetlands and fisheries. The impacts are made worse, says UNEP researcher Pascal Peduzzi, because “a lack of proper scientific methodology for river sand mining has led to indiscriminate sand mining, while weak governance and corruption have led to widespread illegal mining.”
Rivers will attempt to fill in the holes dug out by sand miners, but with twice as much sand estimated to be taken from the world’s rivers as natural processes of sedimentation can restore, they will rarely do it fast enough to undo the damage. Researchers have spoken of a “looming tragedy of the sand commons.”
Take what WWF calls “the largest sand mine in the world”: Lake Poyang on the Yangtze River in China. For many years, sand from the main stem of the Yangtze was dredged to build the megacity of Shanghai downstream, which has erected more skyscrapers in the last decade than New York. That practice was stopped in 2000 because the floating platforms were blocking the river.
But the miners simply moved from the river itself to Lake Poyang in the Yangtze’s floodplain. China’s largest lake is also Asia’s largest winter stopover for migrating birds, including 90 percent of the world’s endangered population of Siberian cranes. By 2006, the last published estimate, dredgers were annually removing more than 400 million tons of sand, mostly from the waterway that links the lake to the Yangtze.
By removing so much sand, the miners have almost doubled the waterway’s capacity, partially draining the lake and making it more vulnerable to drought. Researchers also blame the mining for reducing lake fisheries and for a catastrophic decline in the number of finless porpoises in the main river. Xijun Lai of the Chinese Academy of Science in Nanjing called for a ban on sand mining in the lake.
Equally disturbing is the situation on the Mekong River in Vietnam and Cambodia. Jean-Paul Bravard of the University of Lyon, in a detailed study for WWF, found around 55 million tons of sand was extracted from the lower reaches of the river each year, almost double the input from upstream. The Stockholm Environment Institute concluded that the mining lowered river levels by more than 3 feet, while contributing to both coastal erosion and an invasion of saltwater into the delta, where it was poisoning rice fields. Ironically, much of the sand was being used to maintain coastal defenses and raise delta roads above flood levels.
The mining could also undermine Mekong river fisheries, which directly feed more than 60 million people, says hydrologist Lois Koehnken. The biggest concern, she wrote in a study for WWF, is dredging on the river near the fast-growing Cambodian capital Phnom Penh, where a vital tributary called the Tonle Sap joins the main river. Much of the Mekong’s fish stock originates in marshland at the head of the Tonle Sap. Fish breed there and return to the main river during the monsoon season, when the swollen Mekong bursts its banks and forces the Tonle Sap to flow in reverse. Dredging could increase the main river’s capacity sufficiently to halt this reverse flow, which would dry up the fish breeding grounds.
Singapore has created an extra 50 square miles of land thanks to 500 million tons of imported sand.
River and beach mining have been largely banished in developed countries, although not entirely. America’s last beach mine is in Monterey, California. It extracts as much as half a million tons of sand a year. The controversial operation is due to shut next year, under a deal with the state authorities. There is also a push in Houston to halt sand mining on the banks of the San Jacinto River, which is alleged to have caused sedimentation that played a part in flooding during Hurricane Harvey in 2017.
But sand mining in rivers and on beaches continues to expand in many developing countries. It is often a lawless business, beset by corruption and violence. In India, the world’s second-largest sand mining country, widespread illegal extraction “occurs through the country… run by highly organized and often violent sand mafias,” reported Koehnken. Rogue operators routinely bribe officials, and even the courts prove powerless. A policeman was crushed to death by a tractor while trying to halt illegal mining in a national sanctuary for the Indian crocodile, the gharial, in Madhya Pradesh.
Violent gangs protect sand miners around Nairobi in Kenya. Malaysian officials have been charged with turning a blind eye to smuggling in a “sex-for-sand” scandal. There have been beach battles over sand from Java to Jamaica.
https://e360.yale.edu/features/the-hidden-environmental-toll-of-mining-the-worlds-sand
___________________________
Environmental impact of mining
Environmental impact of mining can occur at local, regional, and global scales through direct and indirect mining practices. Mining can cause erosion, sinkholes, loss of biodiversity, or the contamination of soil, groundwater, and surface water by chemicals emitted from mining processes. These processes also affect the atmosphere through carbon emissions which contributes to climate change.[1]
Some mining methods (lithium mining, phosphate mining, coal mining, mountaintop removal mining, and sand mining) may have such significant environmental and public health effects that mining companies in some countries are required to follow strict environmental and rehabilitation codes to ensure that the mined area returns to its original state. Mining can provide various advantages to societies, yet it can also spark conflicts, particularly regarding land use both above and below the surface.[2]
Mining operations remain rigorous and intrusive, often resulting in significant environmental impacts on local ecosystems and broader implications for planetary environmental health.[3] To accommodate mines and associated infrastructure, land is cleared extensively, consuming significant energy and water resources, emitting air pollutants, and producing hazardous waste.[4]
According to The World Counts page "The amount of resources mined from Earth is up from 39.3 billion tons in 2002. A 55 percent increase in less than 20 years. This puts Earth's natural resources under heavy pressure. We are already extracting 75 percent more than Earth can sustain in the long run."
https://en.wikipedia.org/wiki/Environmental_effects_of_mining
___________________________
The Dirty Problem With Electric Vehicles? Mining for Batteries
December 31, 2024
Mining and Its Environmental Impact
The process of mining critical metals for battery technology is fraught with environmental challenges. The extraction and refining stages typically involve considerable disruption to ecosystems, air and water pollution, and substantial greenhouse gas emissions. Mining operations often require deforestation, land clearing, and alteration of natural landscapes, which can lead to biodiversity loss and soil degradation.
Lithium Mining: Water Depletion and Pollution
Lithium, often dubbed "white gold," is primarily extracted from brine deposits found in salt flats or "salars." While brine extraction is less destructive than hard rock mining, it still raises significant environmental concerns, particularly in water-scarce regions.
In South America, vast salt flats in countries like Bolivia, Argentina, and Chile are being rapidly exploited for lithium extraction. The process typically involves pumping brine to the surface, allowing it to evaporate, and then processing the resultant lithium-rich crystals. However, this process can consume millions of liters of water, leading to profound depletion of local freshwater resources. Communities dependent on these water supplies often face dilemmas as their agricultural and personal water needs conflict with the demands of lithium extraction.
Moreover, chemical processes involved in purification can lead to contamination of local water sources with harmful substances, exacerbating existing challenges for local communities and ecosystems.
Cobalt Mining: Human Rights Violations
Cobalt has emerged as a critical component of many lithium-ion batteries, increasing energy density and stability. However, the majority of the world’s cobalt supply derives from the Democratic Republic of Congo (DRC), where mining practices are often unregulated. Reports from NGOs have documented numerous human rights abuses, including child labor, unsafe working conditions, and exploitative labor practices in artisanal mining operations.
The environmental consequences of cobalt mining are serious as well. The clearing of land for mining operations disrupts local ecosystems, while the pollutants from mining waste can contaminate the surrounding soil and waterways. Cobalt mining not only poses serious ethical questions but also highlights profound disparities in resource wealth, where rich mineral deposits do not equate to prosperity for the local population.
The Supply Chain: Extraction to Production
The journey of battery materials from extraction to production is complex and significantly impacts environmental and social outcomes. The battery supply chain often involves multiple intermediaries, including miners, processors, and manufacturers, each contributing to the overall carbon footprint.
Processors and Purifiers
After extraction, raw materials typically undergo processing and purification stages, which can be energy-intensive and result in emissions. For instance, nickel and cobalt often require extensive refining processes to achieve the purity levels necessary for battery manufacturing. This purification process frequently involves chemicals that pose additional environmental risks, further complicating efforts to create a sustainable supply chain.
Manufacturing Batteries
Battery cell manufacturing itself is an energy-intensive process that contributes to the overall carbon footprint of electric vehicles. The production of lithium-ion batteries, while less mature than traditional automotive manufacturing processes, is increasingly being scrutinized for its environmental impacts. As EV adoption grows, manufacturers are under pressure to invest in cleaner production technologies and energy sources.
https://umatechnology.org/the-dirty-problem-with-electric-vehicles-mining-for-batteries/
___________________________
Will the drive for EVs destroy Earth's last untouched ecosystem?
___________________________
Electric Car Battery Mining Operation Allegedly Hid Evidence It Was Leaching Dangerous Chemical Into Water System
May 4, 2025
One of the common misconceptions about electric vehicles is that they're a net positive for the environment. While EVs are almost certainly better for the planet than gas-powered ones, they still have a substantial impact because of factors like battery manufacturing and coal-generated electricity.
Mining the precious metals needed to build high-tech EV batteries is especially rough on the environment — and the people living nearby — as one nickel extraction operation has shown.
The Harita Group is a massive Indonesian conglomerate responsible for one of the largest nickel mining operations in the country, which is currently the world leader in nickel exports. Harita is a major player in Indonesia's metal supply chain, with its coal-fired smelters responsible for nearly one percent of Indonesia's total carbon emissions in 2023.
___________________________
Copper, Gold or Fish: How a Massive Mining Project is Threatening the World’s Largest Salmon Habitat
September 22, 2017
BRISTOL BAY, ALASKA —“Waterfall!” Rick Halford’s voice crackled over the communication system as he pointed the nose of his Cessna 185 floatplane toward the river below. My stomach did a backflip as the plane plummeted, and for a moment I forgot why the former Alaska State Senator was giving my photographer and me a private tour of the remote region behind Bristol Bay. Then the plane leveled and Halford pointed out to the right, towards a collection of buildings that he believed were an environmental catastrophe waiting to happen: a mine site with upwards of $300 billion worth in copper and gold.
“I would have said yes to the mine project 20 years ago,” the retired politician said over the headset. “What I didn’t understand then was the size of this project, nor the connection of water to everything; the blood of this system is water, and it’ll bleed everywhere...”
___________________________
EPA blocks catastrophic mining project in Bristol Bay, Alaska
January 31, 2023
https://www.worldwildlife.org/stories/epa-blocks-catastrophic-mining-project-in-bristol-bay-alaska
___________________________
New study details mining impacts to salmon habitat, even hundreds of miles downstream
Jul 13, 2022
___________________________
Canada’s oil sands are a toxic nightmare
31 January 2024
The poisonous waste, and deadly carbon emissions produced by oil-sands production is even worse than had been thought, and production must stop, argues John Clarke
Research that has been published in the journal Science, shows that toxic emissions from Canada’s notoriously dirty oil-sands project have been ‘dramatically underestimated’. The report ‘found that air pollution from the vast Athabasca oil sands in Canada exceed industry-reported emissions across the studied facilities by a staggering 1,900% to over 6,300%.’
So great is the level of the emissions ‘that damaging reactive pollutants from the oil sands are equivalent to those from all other human-made sources across Canada with severe health implications.’
These findings mean that ‘scientists have validated what downwind Indigenous communities have been saying for decades. Jesse Cardinal, from the indigenous-led Keepers of the Water, noted that ‘we are told this is all within the limits and OK but this report backs up what the communities living in these areas experience – it is so bad they cannot open their windows because it hurts their lungs to breathe – especially at night.’
The researchers used ‘aircraft to measure pollutants’ and found that ‘there are many organic compounds being released during the process that are missed by traditional ways of measuring air pollutants.’ Moreover, these ‘emission underestimates were not just observed at the more well-known surface mining operations, but also from in situ extraction facilities that represent over 50% of production with projected increases.’
Documented risk
The threat posed by the oil sands development was already well documented long before the present shocking revelations. The Narwhal, a publication that focuses on environmental issues, issued a backgrounder on the oil sands project last year that makes this very clear.
The oil sands are ‘the world’s third-largest deposit of oil, containing an estimated 165 billion barrels of oil.’ They ‘are comprised of high-carbon bitumen deposits. Bitumen requires extraction from underneath the boreal forest, either through mining or the drilling of steam injected wells.’ Given the extensive use of such methods, it isn’t surprising that for ‘many years, the oilsands have represented Canada’s fastest growing source of greenhouse gas emissions.’
The project also ‘generates a tremendous amount of contaminated water waste, called “tailings”. The tailings ponds from the Alberta oilsands cover about 220 square kilometres and hold an estimated 1.2 trillion litres of contaminated water that’s been used in bitumen mining.
’
Covering an area of roughly 142,200 square kilometres in northern Alberta, these ‘operations have contributed to a massive disturbance of Alberta’s boreal forest, through the construction of roads, refineries, processing plants, seismic lines and other oil and gas infrastructure. The result is a heavily polluted landscape, fears of water and wildlife contamination and increasing pressure on at risk species such as the boreal caribou.’
Though the roots of the oil sands project go back much further, it was taken forward in the ‘mid-1990s by rising oil prices. By 2004, Canadian production of tar sands oil had reached one million barrels per day – with much of the output bound for the United States – and Big Oil had ambitious plans to expand.’ Many of these plans have involved laying major pipelines to Canada’s west coast and the US Gulf Coast. In this way, the project’s impact extended well beyond the region immediately impacted and led to enormous confrontations and determined resistance from Indigenous communities and environmentalists.
Fossil-fuel interests and Canadian governments, at both the federal and provincial level, have pushed forward the oil sands project with scant regard for the environmental consequences. The impact on Indigenous communities has also been completely unconscionable.
The Council of Canadians points out that the ‘most immediate and significantly impacted victims of the financially lucrative and environmentally apocalyptic Athabasca tar sands are the Indigenous peoples who have lived since time immemorial in the Athabasca watershed.’
As the project was established, ‘the consent that was given for these projects was not free, prior, or informed. Leaders who entered into these agreements did so knowing that the bitumen mining projects would be going forward with or without their consent, and that these developments would further disrupt the lands they depended on for their livelihoods.’
It has been clear for decades that ‘the waste products of the tar sands were poisonous.’ The tailings ponds that the project has generated now cover an area two and half times larger than the city of Vancouver and ‘the devastating toll of the poisoned ponds’ has had a shattering impact on Indigenous lives.
The report that has now emerged on the extreme and grossly underestimated toxicity of the oil-sands project makes clear that, as dire as the impact has been on the immediate area, the venture constitutes an appalling contribution to environmental degradation and climate crisis on a global scale.
Climate wrecking
The dire impacts of a profit-driven effort to extract dirty oil in Alberta is, of course, only a particularly dreadful example of the course that fossil-fuel capitalism is pursuing everywhere. Just a few years ago, political leaders and mainstream media talked about the need to ensure that global warming was kept at or below the 1.5C threshold.
Last year was ‘the warmest in recorded history, with average global temperatures topping 1.5C of heating above preindustrial levels for more than one third of the year.’ For this year, forecasts ‘suggest the year ahead is likely to be another record breaker, with a strong possibility that this could be the first full year to go beyond 1.5C of warming.’ It is likely that ‘we will end the year with average global temperatures somewhere between 1.34C and 1.58C above preindustrial levels.’
In the midst of this dreadful situation, which threatens life on this planet, we learn that ‘Canada’s oil production is set to jump by about 10 per cent over [this] year and become one of the largest sources of increased supply around the world.’ Canada ‘produces about 4.8 million barrels per day (bpd) of crude and that figure could climb by about 500,000 bpd to about 5.3 million bpd by the end of 2024 … That would mark an all-time high for Canadian production.’
Incredibly, in ‘2024, Canada could be the largest source of growth in global crude oil production. The country’s expected jump in oil output of about 500,000 bpd is higher than the 400,000 bpd projected growth in the US.’ Moreover, ‘predicted growth over the next two years is expected to exceed the total amount added over the last five years.’
As this mad rush proceeds, we are told that ‘Alberta’s oilsands is expected to drive much of the growth.’ The utter destructive recklessness of this situation speaks to the uncontrolled nature of the climate crisis under capitalism.
The dirtiest and most carbon intensive form of oil imaginable has been extracted and transported at the cost of a process of environmental degradation that has laid waste to an area of Canada larger than some European countries. In the process, Indigenous communities that have lived for thousands of years on this land have had to cope with the toxic effects of the process and an assault on their way of life.
https://www.counterfire.org/article/canadas-oil-sands-are-a-toxic-nightmare/
___________________________
Mining Tar Sands Produces Much More Air Pollution Than We Thought
February 3, 2014
Research shows that emissions of a class of air pollutants are two to three orders of magnitude higher than previously calculated
___________________________
New tech to reduce oil sands greenhouse gas emissions
January 24, 2019
___________________________
Green Sand Could Be The Solution That Captures 100% of Human Carbon Emissions
June 26, 2020
There is a natural process of carbon sequestration known as the
carbonate-silicate cycle, in which the greenhouse gas gets stored in
rock. Over billions of years, 99.9% of all CO2 on Earth has been
reserved this way. With today’s rising urgency to remove large amounts
of carbon dioxide from the atmosphere, some scientists came up with the
idea of speeding up the carbonate-silicate cycle so it could be applied
as a method of combating climate change by naturally removing CO2 from
the air. Project Vesta is a non-profit organization dedicated to solving
the climate crisis through this sort of approach.
https://www.intelligentliving.co/green-sand/
___________________________
Green Sand is a limited resource.
___________________________
Sand becoming an endangered resource
September 13, 2016
https://asbpa.org/2016/09/13/sand-becoming-an-endangered-resource/
___________________________
Researchers develop artificial sand for concrete that can sequester CO2 (Controversial)
15 April 2025
A team of researchers from Northwestern University has developed a "carbon-negative" artificial sand that could replace conventional sand in concrete while storing CO2.
The research team, led by civil engineer Alessandro Rotta Loria, found a way to "grow" sand by injecting CO2 and electricity into seawater. The material was developed in collaboration with Cemex, a leading global cement manufacturer.
Typically, sand dredging damages ecosystems by eroding riverbeds and destroying habitats for aquatic life. Sand dredging also comes with a hefty carbon footprint, with mining and transport linked to high emissions across the construction supply chain.
A seashell-like material
Loria said that his material is "comparable" to regular sand in terms of structural integrity and could prevent a "carbon negative" alternative when put into practice.
The process builds on breakthroughs made decades earlier, which were never brought to scale.
In the late 1980s, researchers discovered that if an electrical current is applied to seawater, naturally occurring calcium and magnesium ions can turn into solid minerals. This is known as mineral electrodeposition.
The idea was informed by the way marine organisms form shells and skeletons, but instead of using the animals' metabolic energy, scientists used electricity.
https://www.dezeen.com/2025/04/15/recarbon-negative-artificial-sand-for-concrete/
___________________________
May 31, 2020
https://azgreenmagazine.com/top-environmental-issues-in-canada/
___________________________
The environmental impacts of river sand mining
2022
https://www.sciencedirect.com/science/article/pii/S0048969722029746
___________________________
Environmental Issues in Canada
2022
Canada’s Oilsands
Pipelines
Coal
Mining
Dams
Salmon Farming
https://thenarwhal.ca/topics/environmental-issues-canada/
___________________________
Mining pollution
https://en.wikipedia.org/wiki/Environmental_issues_in_Canada
Canada, like other countries with extensive mining operations, has significant environmental issues, including:
- Environmental impact of the Athabasca oil sands
- Cleanup of the Colomac Mine
- Acid mine drainage from the Northland Pyrite Mine
- Mary River Mine environmental concerns
Great Canadian Oil Sands
Shale oil boom
Fort McMurray wildfire
Development
Plastic pollution
Tar sands
Arctic melting
Pipelines
Endangered species and biodiversity
Logging
Mining
Abandoned fossil fuel wells
Air pollution
Chemical pollution
Mining pollution
Plastic pollution
Tar sands
___________________________
The Biggest Environmental Issues In Canada
2020
- Rise in temperatures, shifts in precipitation patters, air pollution, melting glaciers, road salt pollution, etc., are some of the major environmental threats in Canada in the present day.
- Canada's average temperature is rising at nearly double the rate of the global temperature rise.
- The environmental issue of road salt is one that although not uniquely Canadian, is certainly far more prominent there than in many other countries.
- 2016 saw
a devastating forest fire which blazed through Fort McMurray, Alberta,
an area which continues to see more forest fires in recent years.
https://www.worldatlas.com/articles/the-biggest-environmental-issues-in-canada.html
___________________________
Canadian mining firms worst for environment, rights: Report
Canadian mining companies are far and away the worst offenders in environmental, human rights and other abuses around the world, according to a global study commissioned by an industry association but never made public.
Oct. 19, 2010
https://www.thestar.com/news/canada/2010/10/19/canadian_mining_firms_worst_for_environment_rights_report.html
___________________________
Pervasive
Arctic lead pollution suggests substantial growth in medieval silver
production modulated by plague, climate, and conflict
2019
https://www.pnas.org/doi/10.1073/pnas.1904515116
___________________________
1.7-Billion-Year-Old Chunk of North America Found Sticking to Australia
2018
Researchers believe Australia was part of North America 1.7B years ago
Now researchers have found a series of rocks that show something surprising: part of Australia could have once been connected to part of Canada on the North American continent, around 1.7 billion years ago.
Actually, the discovery that the two continents were once connected isn't hugely surprising. Speculation about such a connection has existed since the late 1970s, when a paper proposed a connection dating back to the continent of Rodinia, around 1.13 billion years ago. However, an exact time and location for the connection has remained under debate.
Found in Georgetown, a small town of just a few hundred people in the north east of Australia, the rocks are unlike other rocks on the Australian continent.
https://www.geologyin.com/2018/01/17-billion-year-old-chunk-of-north.html
___________________________
Stationary Wave Interference and Its Relation to Tropical Convection and Arctic Warming
15 Feb 2016
Abstract
The interference between transient eddies and climatological stationary eddies in the Northern Hemisphere is investigated. The amplitude and sign of the interference is represented by the stationary wave index (SWI), which is calculated by projecting the daily 300-hPa streamfunction anomaly field onto the 300-hPa climatological stationary wave. ERA-Interim data for the years 1979 to 2013 are used. The amplitude of the interference peaks during boreal winter. The evolution of outgoing longwave radiation, Arctic temperature, 300-hPa streamfunction, 10-hPa zonal wind, Arctic sea ice concentration, and the Arctic Oscillation (AO) index are examined for days of large SWI values during the winter.
Constructive interference during winter tends to occur about one week after enhanced warm pool convection and is followed by an increase in Arctic surface air temperature along with a reduction of sea ice in the Barents and Kara Seas. The warming of the Arctic does occur without prior warm pool convection, but it is enhanced and prolonged when constructive interference occurs in concert with enhanced warm pool convection. This is followed two weeks later by a weakening of the stratospheric polar vortex and a decline of the AO. All of these associations are reversed in the case of destructive interference. Potential climate change implications are briefly discussed.
https://journals.ametsoc.org/view/journals/clim/29/4/jcli-d-15-0267.1.xml
___________________________
Exceptional sea ice loss leading to anomalously deep winter convection north of Svalbard in 2018
21 December 2023
Abstract
An important question is will deep convection sites, where deep waters are ventilated and air-gas exchange into the deep ocean occurs, emerge in the Arctic Ocean with the warming climate. As sea ice retreats northward and as Arctic sea ice becomes younger and thinner, air-sea interactions are strengthening in the high-latitude oceans. This includes new and extreme deep convection events. We investigate the associated physical processes and examine impacts and implications. Focusing on a region near the Arctic gateway of Fram Strait, our study confirms a significant sea ice cover reduction north of Svalbard in 2018 compared to the past decade, shown in observations and several numerical studies. We conduct our study using the regional configuration Arctic and North Hemisphere Atlantic of the ocean/sea ice model NEMO, running at 1/12° resolution (ANHA12). Our numerical study shows that the open water condition during the winter of 2018 allows intense winter convection over the Yermak Plateau, as more oceanic heat is lost to the atmosphere without the insulating sea ice cover, causing the mixed layer depth to reach over 600 m. Anomalous wind prior to the deep convection event forces offshore sea ice movement and contributes to the reduced sea ice cover. The sea ice loss is also attributed to the excess heat brought by the Atlantic Water, which reaches its maximum in the preceding winter in Fram Strait. The deep convection event coincides with enhanced mesoscale eddy activity on the boundary of the Yermak Plateau, especially to the east. The resulting substantial heat loss to the atmosphere also leads to a heat content reduction integrated over the Yermak Plateau region. This event can be linked to the minimum southward sea ice volume flux through Fram Strait in 2018, which is a potential negative freshwater anomaly in the subpolar Atlantic.
https://link.springer.com/article/10.1007/s00382-023-07027-8
___________________________
2023
___________________________
No emergence of deep convection in the Arctic Ocean across CMIP6 models
September 2023
___________________________
Winter Convection Transports Atlantic Water Heat to the Surface Layer in the Eastern Arctic Ocean
01 Oct 2013
Abstract
A 1-yr (2009/10) record of temperature and salinity profiles from Ice-Tethered Profiler (ITP) buoys in the Eurasian Basin (EB) of the Arctic Ocean is used to quantify the flux of heat from the upper pycnocline to the surface mixed layer. The upper pycnocline in the central EB is fed by the upward flux of heat from the intermediate-depth (~150–900 m) Atlantic Water (AW) layer; this flux is estimated to be ~1 W m−2 averaged over one year. Release of heat from the upper pycnocline, through the cold halocline layer to the surface mixed layer is, however, seasonally intensified, occurring more strongly in winter. This seasonal heat loss averages ~3–4 W m−2 between January and April, reducing the rate of winter sea ice formation. This study hypothesizes that the winter heat loss is driven by mixing caused by a combination of brine-driven convection associated with sea ice formation and larger vertical velocity shear below the base of the surface mixed layer (SML), enhanced by atmospheric storms and the seasonal reduction in density difference between the SML and underlying pycnocline.
https://journals.ametsoc.org/view/journals/phoc/43/10/jpo-d-12-0169.1.xml
___________________________
A moderator of tropical impacts on climate in Canadian Arctic Archipelago during boreal summer
05 October 2024
https://www.nature.com/articles/s41467-024-53056-0
___________________________
Enhanced jet stream waviness induced by suppressed tropical Pacific convection during boreal summer
11 March 2022
Abstract
Consensus on the cause of recent midlatitude circulation changes toward a wavier manner in the Northern Hemisphere has not been reached, albeit a number of studies collectively suggest that this phenomenon is driven by global warming and associated Arctic amplification. Here, through a fingerprint analysis of various global simulations and a tropical heating-imposed experiment, we suggest that the suppression of tropical convection along the Inter Tropical Convergence Zone induced by sea surface temperature (SST) cooling trends over the tropical Eastern Pacific contributed to the increased summertime midlatitude waviness in the past 40 years through the generation of a Rossby-wave-train propagating within the jet waveguide and the reduced north-south temperature gradient. This perspective indicates less of an influence from the Arctic amplification on the observed mid-latitude wave amplification than what was previously estimated. This study also emphasizes the need to better predict the tropical Pacific SST variability in order to project the summer jet waviness and consequent weather extremes.
https://www.nature.com/articles/s41467-022-28911-7
___________________________
Arctic amplification: does it impact the polar jet stream?
04 Oct 2016
A B S T R A C T
It
has been hypothesised that the Arctic amplification of temperature
changes causes a decrease in the northward temperature gradient in the
troposphere, thereby enhancing the oscillation of planetary waves
leading to extreme weather in mid-latitudes. To test this hypothesis, we
study the response of the atmosphere to Arctic amplification for a
projected summer sea-ice-free period using an atmospheric model with
prescribed surface boundary conditions from a state-of-the-art Earth
system model. Besides a standard global warming simulation, we also
conducted a sensitivity experiment with sea ice and sea surface
temperature anomalies in the Arctic. We show that when global climate
warms, enhancement of the northward heat transport provides the major
contribution to decrease the northward temperature gradient in the polar
troposphere in cold seasons, causing more oscillation of the planetary
waves. However, while Arctic amplification significantly enhances
near-surface air temperature in the polar region, it is not large enough
to invoke an increased oscillation of the planetary waves.
https://www.tandfonline.com/doi/pdf/10.3402/tellusa.v68.32330
___________________________
Recent Arctic amplification and extreme mid-latitude weather
17 August 2014
Abstract
The Arctic region has warmed more than twice as fast as the global average — a phenomenon known as Arctic amplification. The rapid Arctic warming has contributed to dramatic melting of Arctic sea ice and spring snow cover, at a pace greater than that simulated by climate models. These profound changes to the Arctic system have coincided with a period of ostensibly more frequent extreme weather events across the Northern Hemisphere mid-latitudes, including severe winters. The possibility of a link between Arctic change and mid-latitude weather has spurred research activities that reveal three potential dynamical pathways linking Arctic amplification to mid-latitude weather: changes in storm tracks, the jet stream, and planetary waves and their associated energy propagation. Through changes in these key atmospheric features, it is possible, in principle, for sea ice and snow cover to jointly influence mid-latitude weather. However, because of incomplete knowledge of how high-latitude climate change influences these phenomena, combined with sparse and short data records, and imperfect models, large uncertainties regarding the magnitude of such an influence remain. We conclude that improved process understanding, sustained and additional Arctic observations, and better coordinated modelling studies will be needed to advance our understanding of the influences on mid-latitude weather and extreme events.
https://www.nature.com/articles/ngeo2234
___________________________
Arctic Warming May Not Be Altering Jet Stream: Study
August 21, 2013
A new study calls into question the widely-publicized hypothesis that rapid warming of the Arctic climate, including the precipitous loss of summer sea ice cover, is altering weather patterns throughout the Northern Hemisphere. Specifically, the study, which will be published in a forthcoming issue of Geophysical Research Letters, challenges the findings of previous studies that showed a slowdown in the speed and changes in the shape of the jet stream.
In doing so, the study provides additional insight into a nascent area of research regarding how Arctic warming will affect weather patterns in the midlatitudes, notably the U.S. and Europe. As with other emerging scientific issues, consensus on the connections between Arctic warming and midlatitude weather is unlikely anytime soon, but each study can be viewed as providing more clues for future studies.
Much of the current focus centers around the jet stream, which is a channel of fast-flowing air at high altitudes that helps steer weather systems from west to east across the Northern Hemisphere, and it is powered by the huge difference in air temperatures between the equator and the poles.
Researchers such as Jennifer Francis of Rutgers University and Steven Vavrus of the University of Wisconsin have published studies showing the temperature gradient between the equator and the North pole has shrunk causing changes to the jet stream. The main reason behind this is that the Arctic has warmed at twice the rate of the rest of the Northern Hemisphere, a phenomenon known as Arctic amplification. One of the main causes for the increased warming in the Arctic is melting sea ice, which has declined precipitously since 1981 and hit a record minimum last year.
The research shows that the weaker gradient slows the speed of the jet stream in particular seasons and causes it to meander more than usual and make unusual turns like a tourist wandering through Times Square. Francis’ work has also tied rapid Arctic warming, also known as “Arctic amplification,” to an increase in blocked or stuck weather patterns that have been associated with deadly extreme weather events such as the Russian heat wave of 2010, heat and drought in the U.S. in 2012, and even Hurricane Sandy.
The new study, by Elizabeth Barnes of Colorado State University, calls this research into question by showing that what Francis, Vavrus, and others have shown may just be an artifact of their research methods.
NASA computer model animation showing the evolution of a large dip in the jet stream.
In examining trends in the waviness and speed of the jet stream, as well as the number and location of atmospheric blocking events, the study found that the evidence does not support many of the conclusions made in previous studies. Specifically, the study found no significant change in the waviness of the jet stream has been observed based on 30 years of data.
The study concluded that previous research might have construed changes in the height of different layers of the atmosphere for changes in the waviness of the jet stream. The height of specific atmospheric layers are tracked because they correspond to different weather indicators. As the atmosphere warms and air expands, the height of a given layer, measured using its pressure level, also rises. In recent years, the average height of air pressure surfaces has been increasing in the high latitudes, which is consistent with the warming climate.
“This work highlights that observed trends in midlatitude weather patterns are complex and likely not simply understood in terms of Arctic Amplification alone,” the study said. For example, the study found no statistically significant increase in atmospheric blocking events over the North Atlantic, which “suggests that Arctic Amplification over the past 30 years has not had a quantifiable impact on slow-moving weather patterns over North America or the North Atlantic.”
In an email message to Climate Central, Francis said the new study does not significantly contradict her research tying Arctic warming to extreme weather patterns well outside of the Arctic.
“The mechanisms linking Arctic amplification with large-scale circulation patterns are clearly not simple and we still have much to learn. These new results provide additional insight into those linkages,” she said.
However, Francis found fault with parts of the new study. She said that the 30 years of data that Barnes used in her research might hide some of the effects of Arctic amplification, since much of the warming and sea ice loss has taken place in just the past 15 years.
“Because Arctic amplification has emerged from the noise of natural variability only in the last 15 year or so, it is not surprising that its influence would not drive 30-year trends in a statistically significant way,” she said.
Demonstrating the heightened interest in this area of emerging research, on September 12, the National Academy of Sciences is scheduled to hold a workshop in College Park, Md., on new scientific findings related to ties between Arctic warming and midlatitude weather patterns.
https://www.climatecentral.org/news/new-study-questions-arctic-warming-extreme-weather-links-16375
___________________________
The Arctic Jet Stream Affects Global Climate. Here's Why.
10/12/21
https://www.pbs.org/wgbh/nova/video/arctic-jet-stream-affects-global-climate/
___________________________
Polar amplification
Polar amplification is the phenomenon that any change in the net radiation balance (for example greenhouse intensification) tends to produce a larger change in temperature near the poles than in the planetary average.[1] This is commonly referred to as the ratio of polar warming to tropical warming. On a planet with an atmosphere that can restrict emission of longwave radiation to space (a greenhouse effect), surface temperatures will be warmer than a simple planetary equilibrium temperature calculation would predict. Where the atmosphere or an extensive ocean is able to transport heat polewards, the poles will be warmer and equatorial regions cooler than their local net radiation balances would predict.[2] The poles will experience the most cooling when the global-mean temperature is lower relative to a reference climate; alternatively, the poles will experience the greatest warming when the global-mean temperature is higher.[1]
In the extreme, the planet Venus is thought to have experienced a very large increase in greenhouse effect over its lifetime,[3] so much so that its poles have warmed sufficiently to render its surface temperature effectively isothermal (no difference between poles and equator).[4][5] On Earth, water vapor and trace gasses provide a lesser greenhouse effect, and the atmosphere and extensive oceans provide efficient poleward heat transport. Both palaeoclimate changes and recent global warming changes have exhibited strong polar amplification, as described below.
Arctic amplification is polar amplification of the Earth's North Pole only; Antarctic amplification is that of the South Pole.
History
Amplification
Amplifying mechanisms
Feedbacks associated with sea ice and snow cover are widely cited as one of the principal causes of terrestrial polar amplification.[12][13][14] These feedbacks are particularly noted in local polar amplification,[15] although recent work has shown that the lapse rate feedback is likely equally important to the ice-albedo feedback for Arctic amplification.[16] Supporting this idea, large-scale amplification is also observed in model worlds with no ice or snow.[17] It appears to arise both from a (possibly transient) intensification of poleward heat transport and more directly from changes in the local net radiation balance.[17] Local radiation balance is crucial because an overall decrease in outgoing longwave radiation will produce a larger relative increase in net radiation near the poles than near the equator.[16] Thus, between the lapse rate feedback and changes in the local radiation balance, much of polar amplification can be attributed to changes in outgoing longwave radiation.[15][18] This is especially true for the Arctic, whereas the elevated terrain in Antarctica limits the influence of the lapse rate feedback.[16][19]
Some examples of climate system feedbacks thought to contribute to recent polar amplification include the reduction of snow cover and sea ice, changes in atmospheric and ocean circulation, the presence of anthropogenic soot in the Arctic environment, and increases in cloud cover and water vapor.[13] CO2 forcing has also been attributed to polar amplification.[20] Most studies connect sea ice changes to polar amplification.[13] Both ice extent and thickness impact polar amplification. Climate models with smaller baseline sea ice extent and thinner sea ice coverage exhibit stronger polar amplification.[21] Some models of modern climate exhibit Arctic amplification without changes in snow and ice cover.[22]
The individual processes contributing to polar warming are critical to understanding climate sensitivity.[23] Polar warming also affects many ecosystems, including marine and terrestrial ecosystems, climate systems, and human populations.[20] Polar amplification is largely driven by local polar processes with hardly any remote forcing, whereas polar warming is regulated by tropical and midlatitude forcing.[20] These impacts of polar amplification have led to continuous research in the face of global warming.
Ocean circulation
It has been estimated that 70% of global wind energy is transferred to the ocean and takes place within the Antarctic Circumpolar Current (ACC).[24] Eventually, upwelling due to wind-stress transports cold Antarctic waters through the Atlantic surface current, while warming them over the equator, and into the Arctic environment. This is especially noticed in high latitudes.[21] Thus, warming in the Arctic depends on the efficiency of the global ocean transport and plays a role in the polar see-saw effect.[24]
Decreased oxygen and low-pH during La Niña are processes that correlate with decreased primary production and a more pronounced poleward flow of ocean currents.[25] It has been proposed that the mechanism of increased Arctic surface air temperature anomalies during La Niña periods of ENSO may be attributed to the Tropically Excited Arctic Warming Mechanism (TEAM), when Rossby waves propagate more poleward, leading to wave dynamics and an increase in downward infrared radiation.[1][26]
Amplification phase
It is observed that Arctic and Antarctic warming commonly proceed out of phase because of orbital forcing, resulting in the so-called polar see-saw effect.
Paleoclimate polar amplification
Recent Arctic amplification
Suggested mechanisms leading to the observed Arctic amplification include Arctic sea ice decline (open water reflects less sunlight than sea ice), atmospheric heat transport from the equator to the Arctic,[32] and the lapse rate feedback.[16]
The Arctic was historically described as warming twice as fast as the global average,[33] but this estimate was based on older observations which missed the more recent acceleration. By 2021, enough data was available to show that the Arctic had warmed three times as fast as the globe - 3.1°C between 1971 and 2019, as opposed to the global warming of 1°C over the same period.[34] Moreover, this estimate defines the Arctic as everything above 60th parallel north, or a full third of the Northern Hemisphere: in 2021–2022, it was found that since 1979, the warming within the Arctic Circle itself (above the 66th parallel) has been nearly four times faster than the global average.[35][36] Within the Arctic Circle itself, even greater Arctic amplification occurs in the Barents Sea area, with hotspots around West Spitsbergen Current: weather stations located on its path record decadal warming up to seven times faster than the global average.[37][38] This has fuelled concerns that unlike the rest of the Arctic sea ice, ice cover in the Barents Sea may permanently disappear even around 1.5 degrees of global warming.[39][40]
The acceleration of Arctic amplification has not been linear: a 2022 analysis found that it occurred in two sharp steps, with the former around 1986, and the latter after 2000.[41] The first acceleration is attributed to the increase in anthropogenic radiative forcing in the region, which is in turn likely connected to the reductions in stratospheric sulfur aerosols pollution in Europe in the 1980s in order to combat acid rain. Since sulphate aerosols have a cooling effect, their absence is likely to have increased Arctic temperatures by up to 0.5 degrees Celsius.[42][43] The second acceleration has no known cause,[34] which is why it did not show up in any climate models. It is likely to be an example of multi-decadal natural variability, like the suggested link between Arctic temperatures and Atlantic Multi-decadal Oscillation (AMO),[44] in which case it can be expected to reverse in the future. However, even the first increase in Arctic amplification was only accurately simulated by a fraction of the current CMIP6 models.[41] Recent studies show the Arctic has warmed nearly four times faster than the global average since 1979, with areas like the Barents Sea experiencing rates up to seven times higher, highlighting the urgent need to address polar climate change.[45]
Possible impacts on mid-latitude weather
Since the early 2000s, climate models have consistently identified that global warming will gradually push jet streams poleward. In 2008, this was confirmed by observational evidence, which proved that from 1979 to 2001, the northern jet stream moved northward at an average rate of 2.01 kilometres (1.25 mi) per year, with a similar trend in the southern hemisphere jet stream.[46][47] Climate scientists have hypothesized that the jet stream will also gradually weaken as a result of global warming. Trends such as Arctic sea ice decline, reduced snow cover, evapotranspiration patterns, and other weather anomalies have caused the Arctic to heat up faster than other parts of the globe, in what is known as the Arctic amplification. In 2021–2022, it was found that since 1979, the warming within the Arctic Circle has been nearly four times faster than the global average,[48][49] and some hotspots in the Barents Sea area warmed up to seven times faster than the global average.[50][51] While the Arctic remains one of the coldest places on Earth today, the temperature gradient between it and the warmer parts of the globe will continue to diminish with every decade of global warming as the result of this amplification. If this gradient has a strong influence on the jet stream, then it will eventually become weaker and more variable in its course, which would allow more cold air from the polar vortex to leak mid-latitudes and slow the progression of Rossby waves, leading to more persistent and more extreme weather.[52]
The hypothesis above is closely associated with Jennifer Francis, who had first proposed it in a 2012 paper co-authored by Stephen J. Vavrus.[52] While some paleoclimate reconstructions have suggested that the polar vortex becomes more variable and causes more unstable weather during periods of warming back in 1997,[53] this was contradicted by climate modelling, with PMIP2 simulations finding in 2010 that the Arctic Oscillation (AO) was much weaker and more negative during the Last Glacial Maximum, and suggesting that warmer periods have stronger positive phase AO, and thus less frequent leaks of the polar vortex air.[54] However, a 2012 review in the Journal of the Atmospheric Sciences noted that "there [has been] a significant change in the vortex mean state over the twenty-first century, resulting in a weaker, more disturbed vortex.",[55] which contradicted the modelling results but fit the Francis-Vavrus hypothesis. Additionally, a 2013 study noted that the then-current CMIP5 tended to strongly underestimate winter blocking trends,[56] and other 2012 research had suggested a connection between declining Arctic sea ice and heavy snowfall during midlatitude winters.[57]
In 2013, further research from Francis connected reductions in the Arctic sea ice to extreme summer weather in the northern mid-latitudes,[58] while other research from that year identified potential linkages between Arctic sea ice trends and more extreme rainfall in the European summer.[59] At the time, it was also suggested that this connection between Arctic amplification and jet stream patterns was involved in the formation of Hurricane Sandy[60] and played a role in the early 2014 North American cold wave.[61][62] In 2015, Francis' next study concluded that highly amplified jet-stream patterns are occurring more frequently in the past two decades. Hence, continued heat-trapping emissions favour increased formation of extreme events caused by prolonged weather conditions.[63]
Studies published in 2017 and 2018 identified stalling patterns of Rossby waves in the northern hemisphere jet stream as the culprit behind other almost stationary extreme weather events, such as the 2018 European heatwave, the 2003 European heat wave, 2010 Russian heat wave or the 2010 Pakistan floods, and suggested that these patterns were all connected to Arctic amplification.[64][65] Further work from Francis and Vavrus that year suggested that amplified Arctic warming is observed as stronger in lower atmospheric areas because the expanding process of warmer air increases pressure levels which decreases poleward geopotential height gradients. As these gradients are the reason that cause west to east winds through the thermal wind relationship, declining speeds are usually found south of the areas with geopotential increases.[66] In 2017, Francis explained her findings to the Scientific American: "A lot more water vapor is being transported northward by big swings in the jet stream. That's important because water vapor is a greenhouse gas just like carbon dioxide and methane. It traps heat in the atmosphere. That vapor also condenses as droplets we know as clouds, which themselves trap more heat. The vapor is a big part of the amplification story—a big reason the Arctic is warming faster than anywhere else."[67]
In a 2017 study conducted by climatologist Judah Cohen and several of his research associates, Cohen wrote that "[the] shift in polar vortex states can account for most of the recent winter cooling trends over Eurasian midlatitudes".[68] A 2018 paper from Vavrus and others linked Arctic amplification to more persistent hot-dry extremes during the midlatitude summers, as well as the midlatitude winter continental cooling.[69] Another 2017 paper estimated that when the Arctic experiences anomalous warming, primary production in North America goes down by between 1% and 4% on average, with some states suffering up to 20% losses.[70] A 2021 study found that a stratospheric polar vortex disruption is linked with extreme cold winter weather across parts of Asia and North America, including the February 2021 North American cold wave.[71][72] Another 2021 study identified a connection between the Arctic sea ice loss and the increased size of wildfires in the Western United States.[73]
However, because the specific observations are considered short-term observations, there is considerable uncertainty in the conclusions. Climatology observations require several decades to definitively distinguish various forms of natural variability from climate trends.[74] This point was stressed by reviews in 2013[75] and in 2017.[76] A study in 2014 concluded that Arctic amplification significantly decreased cold-season temperature variability over the northern hemisphere in recent decades. Cold Arctic air intrudes into the warmer lower latitudes more rapidly today during autumn and winter, a trend projected to continue in the future except during summer, thus calling into question whether winters will bring more cold extremes.[77] A 2019 analysis of a data set collected from 35 182 weather stations worldwide, including 9116 whose records go beyond 50 years, found a sharp decrease in northern midlatitude cold waves since the 1980s.[78]
Moreover, a range of long-term observational data collected during the 2010s and published in 2020 suggests that the intensification of Arctic amplification since the early 2010s was not linked to significant changes on mid-latitude atmospheric patterns.[79][80] State-of-the-art modelling research of PAMIP (Polar Amplification Model Intercomparison Project) improved upon the 2010 findings of PMIP2; it found that sea ice decline would weaken the jet stream and increase the probability of atmospheric blocking, but the connection was very minor, and typically insignificant next to interannual variability.[81][82] In 2022, a follow-up study found that while the PAMIP average had likely underestimated the weakening caused by sea ice decline by 1.2 to 3 times, even the corrected connection still amounts to only 10% of the jet stream's natural variability.[83]
Additionally, a 2021 study found that while jet streams had indeed slowly moved polewards since 1960 as was predicted by models, they did not weaken, in spite of a small increase in waviness.[84] A 2022 re-analysis of the aircraft observational data collected over 2002–2020 suggested that the North Atlantic jet stream had actually strengthened.[85] Finally, a 2021 study was able to reconstruct jet stream patterns over the past 1,250 years based on Greenland ice cores, and found that all of the recently observed changes remain within range of natural variability: the earliest likely time of divergence is in 2060, under the Representative Concentration Pathway 8.5 which implies continually accelerating greenhouse gas emissions.
https://en.wikipedia.org/wiki/Polar_amplification
___________________________
Arctic Amplification and Extreme Weather: Controversy Lingers
11/25/2020
A recurring topic of interest and controversy among climate researchers is the potential connection between rapid Arctic warming and volatile or extreme weather in the mid-latitudes. The Arctic has warmed much faster than the rest of the globe – a phenomenon known as “Arctic amplification” – and some have argued that this is causing disruption to the jet stream and increasing volatility in weather patterns at lower latitudes.
Arctic Amplification Causes Mid-Latitude Cooling?
While it is far beyond the scope of this post to discuss the many facets of the science, one of the more counter-intuitive proposals is that Arctic amplification has caused mid-latitude winters to see “almost no warming” across land areas in recent decades (to quote Cohen at al 2020). The basic idea is that rapid Arctic warming has weakened the polar vortex, allowing cold air to spill south into the mid-latitudes more often than in previous decades. This north-south transfer of air is associated with high-latitude blocking and a more “wavy” jet stream, in contrast to the strong westerly flow that accompanies a strong polar vortex with cold “locked up” near the pole.
The hypothesis that Arctic amplification weakens the polar vortex, promotes blocking, and cools the mid-latitudes has been controversial since it was first proposed almost a decade ago, and a brief article published recently expresses the contrary view – that there is no real evidence for the proposed mechanisms. Here’s a link to a read-only version of this new article by Blackport and Screen:
Weakened evidence for mid-latitude impacts of Arctic warming
Blocking and the Polar Vortex
In light of this new contribution, it is interesting to look at a few key aspects of the problem using World Climate Service data. First, it’s worth noting – in agreement with Blackport and Screen – that Arctic-wide blocking has simply not increased in parallel with the dramatic loss of Arctic sea ice. In contrast, there’s a clear case to be made that the winter jet stream has often been stronger and more uniformly westerly in recent decades than before the era of strong Arctic warming.
The chart below shows the Arctic Oscillation (AO) index since 1950 for winter (blue) and summer (red), and it’s clear that the December-February index values have been generally more positive since 1988 than before. If we focus only on 1988-present, as Cohen et al. did, then we might claim a downward trend through about 2013, but the larger context tells a different story.
The North Atlantic Oscillation, which is closely related to the AO but
focuses on the jet stream behavior over the North Atlantic sector, shows
a similar picture; it’s been 10 years since there was a significantly
negative NAO phase in winter (see below). I see no evidence of increased
winter blocking (more negative NAO), but rather the reverse is true for
the full period since 1950. However, it certainly is interesting to see
that the summer NAO has frequently been
significantly negative in recent years. This reflects an association
between summer weather patterns and sea ice loss – but which causes the
other is difficult to say.
If we look at the strength of the winter-time westerly winds at 60°N (a latitude that’s commonly used to monitor the status of the stratospheric polar vortex), there is zero trend from 1960-present in the lower stratosphere (100mb) – see below. Higher up, at 10mb, the ERA5 reanalysis data suggest a slight decrease in winter westerly flow, but the trend is nowhere near statistically significant. At 500mb, in the mid-troposphere, there’s a slight increasing trend, but again not significant.
These results support Blackport and Screen in their contention that there’s no convincing evidence for the purported mechanism for increased mid-latitude volatility; the winter-time jet stream and polar vortex have not weakened, and if anything the large-scale circulation modes (AO and NAO) have become less favorable for mid-latitude cold outbreaks in winter.
Mid-Latitude Winter Temperatures
It also seems there is little reason to believe that mid-latitude land areas have seen “almost no warming” (to quote Cohen et al) in winter during the era of Arctic amplification (i.e. the last 30 years or so). Here’s a chart showing recent mid-latitude land area temperature trends for December-March from various sources (December-March was used by Cohen et al).
Here I’ve calculated trends for 1993-2016, which is the period for which model forecasts are available from the seasonal dynamical models included in the EU’s Copernicus program. I’ll comment on these models below. For now, notice that the smallest warming trend is found in the NCEP global reanalysis (“R1”), and this is the source that was used by Cohen at al to support their statement that “the observations show that temperatures across the midlatitude continents have remained nearly constant”. Unfortunately, the NCEP reanalysis is a 25-year-old model that runs at a very coarse resolution and simply doesn’t represent the state of the art for climate reanalysis.
In contrast, the modern ERA5 and JRA-55 data sets show greater warming trends and agree closely with each other. These also agree quite closely with data from NOAA’s surface temperature analysis, which is obtained directly from surface observations rather than estimated from a model. It’s clear that these other sources have tended to be warmer in recent years, and cooler in earlier years, than NCEP R1 (with all series having the same zero-anomaly baseline here). If we had measured the temperature trends ending in 2013, then the sequence of cold winters around 2009-2013 would have supported the idea of greater cold air discharge to the mid-latitudes, but the last several years have done the opposite.
Having said all this, it is interesting to see that the observed mid-latitude warming has not been as great as the Copernicus models expected in their November-issued forecasts for December-March (as illustrated by the green trend line above). Compare the two maps below, showing the spatial distribution of trends in the Copernicus and ERA5 data. The Copernicus forecast models show considerably more warming in central and eastern Canada and the contiguous U.S., and there’s also a much broader zone of warming in western and central Russia. ERA5 even shows a few areas of cooling, but these aren’t captured in the Copernicus forecasts.
It seems fair to say, then, that mid-latitude temperature trends in the past couple of decades have not conformed entirely to model expectations, as warming has not been as widespread and pronounced as the models predicted. This much is consistent with Cohen et al, and so I think we can’t yet rule out the possibility that Arctic amplification has a systematic effect that dampens warming in the mid-latitudes. However, if this is happening, it’s not because Arctic-wide blocking has increased or the polar vortex has weakened.
In my view, the most likely explanation for the relatively small mid-latitude warming is that natural variability of weather patterns (such as the colder period of 2009-2013) has produced a trend on the low side of what might be expected. With only about 30 years of data to work with in the era of Arctic amplification, sample size is obviously a huge problem for assessing whether the models are “right”. Time will tell, of course; but I suspect we will eventually dismiss the counter-intuitive idea that Arctic warming causes mid-latitude winter cooling.
For the sake of completeness, here are the temperature trend maps for NCEP R1 (very unrealistic cooling over Asia), JRA-55, and NOAA.
In this case the reanalysis products show more rapid warming than the Copernicus models – the opposite of the situation in the mid-latitudes. As noted by Cohen et al, the models show warming “more equitably distributed between the Arctic and midlatitudes”; they argue that this is because Arctic amplification favors greater “meridional exchange of air masses” than expected by the models, but as discussed above, the lack of increased blocking suggests this cannot be the case.
https://www.worldclimateservice.com/2020/11/25/arctic-amplification-and-extreme-weather/
___________________________
Arctic Amplification of marine heatwaves under global warming
26 September 2024
https://www.nature.com/articles/s41467-024-52760-1
___________________________
Assessments of the Arctic amplification and the changes in the Arctic sea surface
2020
https://www.sciencedirect.com/science/article/pii/S1674927820300046
___________________________
Insignificant effect of Arctic amplification on the amplitude of midlatitude atmospheric waves
Abstract
https://www.science.org/doi/10.1126/sciadv.aay2880
___________________________
Arctic Amplification
The Arctic is warming twice to three times as fast as the rest of the planet due to sea ice loss—a phenomenon known as Arctic amplification.[1] As sea ice declines, it becomes younger and thinner, and therefore more vulnerable to further melting. When the ice melts entirely, darker land or ocean surfaces can absorb more energy from the Sun, causing additional heating. Arctic amplification is driving ice sheet melt, sea level rise, more intense Arctic fire seasons, and permafrost melt. A growing body of research also shows that rapid Arctic warming is contributing to changes in mid-latitude climate and weather.
https://www.climatesignals.org/climate-signals/arctic-amplification
___________________________
Divergent consensuses on Arctic amplification influence on midlatitude severe winter weather
23 December 2019
Abstract
The
Arctic has warmed more than twice as fast as the global average since
the late twentieth century, a phenomenon known as Arctic amplification
(AA). Recently, there have been considerable advances in understanding
the physical contributions to AA, and progress has been made in
understanding the mechanisms that link it to midlatitude weather
variability. Observational studies overwhelmingly support that AA is
contributing to winter continental cooling. Although some model
experiments support the observational evidence, most modelling results
show little connection between AA and severe midlatitude weather or
suggest the export of excess heating from the Arctic to lower latitudes.
Divergent conclusions between model and observational studies, and even
intramodel studies, continue to obfuscate a clear understanding of how
AA is influencing midlatitude weather.
https://www.nature.com/articles/s41558-019-0662-y
___________________________
Polar vortex makes much of US colder than Greenland, but warmth is coming. Then more cold
February 19, 2025
___________________________
How Arctic warming triggers extreme cold waves like the Texas freeze
September 6, 2021
https://www.arctictoday.com/how-arctic-warming-triggers-extreme-cold-waves-like-the-texas-freeze/
___________________________
Historic January 2025 snowstorm in the Southern U.S.
An Arctic blast plunged into the southeastern United States on Sunday, January 19, arriving just in time for the on-average coldest stretch of the year. It brought record-breaking low temperatures and fueled a winter storm that dropped historic snowfall for parts of the South.
https://www.climate.gov/news-features/event-tracker/historic-january-2025-snowstorm-southern-us
___________________________
Polar vortex 2025: Extremely cold temperatures headed to the eastern US
December 31, 2024
___________________________
Did a Terminal Temperature Acceleration Event start in December 2024?
December 9, 2024
On December 30, 2024, the temperature was at a record high for the time of year. Given that La Niña suppresses temperatures, the question is what is driving up the temperature.
___________________________
Record-breaking Arctic blast to end, warmup finally on the way
February 21, 2025
https://abcnews.go.com/US/record-breaking-arctic-blast-end-warmup-finally/story?id=119038634
___________________________
Arctic Air Mass Brings Dangerous Temperatures to Parts of the U.S.
2-18-2025
And a winter storm could dump up to a foot of snow from the Central Plains to the East Coast.
https://www.nytimes.com/2025/02/18/weather/arctic-cold-snow.html
___________________________
Mount Washington: Home to 'the world's worst weather' with record wind speeds of 231 mph
March 14, 2025
Mount Washington is a prominent mountain in New Hampshire, known for its dramatic weather and conditions that are extremely dangerous for hikers and climbers.
Mount Washington is the tallest peak in the Northeast. The mountain is famous for attracting extreme weather, with winds that exceed the force of a hurricane more than 100 days per year.
The mountain is home to "the world's worst weather" for three main reasons. Firstly, at 6,288 feet (1,917 meters) tall, it is the highest mountain in New England. Winds pick up speed when they can blow unobstructed, and the mountain is directly exposed to winds from the west that travel for hundreds of miles without obstruction. The closest mountains of a similar height to Mount Washington along this westerly windpath are the Black Hills of South Dakota about 1,600 miles (2,500 kilometers) away, according to the Mount Washington Observatory.
Not only do these winds hit Mount Washington at full speed but they are also siphoned toward the peak by the surrounding landscape. The mountains to the west of Mount Washington form a 75-mile-wide (120 km) funnel that channels westerly winds toward the mountain, accelerating already-fast winds until they reach breakneck speeds, according to the observatory.
___________________________
How Wind Moves: High To Low Pressure Explained
May 29, 2025
Prevailing winds are the predominant surface winds in a given area, blowing from a single direction. They are caused by the uneven heating of the Earth by the sun, which creates areas of high and low pressure. Generally, winds blow from high-pressure areas to low-pressure areas, and their speed is determined by the pressure gradient. In the Northern Hemisphere, winds twist counter-clockwise, while in the Southern Hemisphere, they move in a clockwise direction due to the Coriolis effect. The Coriolis effect also causes winds to travel along the edges of high-pressure and low-pressure systems. Various factors influence the direction and speed of prevailing winds, including terrain features, sea and land breezes, mountain and valley breezes, and surface friction.
| Characteristics | Values |
|---|---|
| Direction of prevailing winds | Generally from high-pressure areas to low-pressure areas; predominantly easterly at low latitudes and westerly in mid-latitudes |
| Speed | Influenced by pressure gradient; winds are strongest when isobars are close together |
| Coriolis effect | Makes wind systems twist counter-clockwise in the Northern Hemisphere and clockwise in the Southern Hemisphere |
| Trade winds | Created by hot air flowing away from the equator, which then cools and sinks towards the low-pressure zone at the equator |
| Doldrums | Area of low pressure around the equator where prevailing winds are calm and very weak |
| Hadley cell | Nearest the equator, forms a convection cell that dominates tropical and subtropical climates |
| Ferrel cell | Mid-latitude circulation cell named in the 19th century by Ferrel |
| Polar cell | Air rises, diverges, and travels toward the poles; once over the poles, the air sinks, forming the polar highs |
| Land and sea breezes | Caused by differences in temperature over land and water; sea breezes occur during the day when the land heats more rapidly, while land breezes occur at night when the land cools |
| Jet streams | High-altitude geostrophic winds that form near the boundaries of air masses with different temperatures and humidity |
The Coriolis effect
In the Northern Hemisphere, the Coriolis effect causes moving objects to be deflected to the right, while in the Southern Hemisphere, it causes a deflection to the left. This is because the Earth rotates faster at the equator than at the poles. The Earth is wider at the equator, so the equatorial regions move faster than the regions near the poles during the Earth's rotation.
Overall, the Coriolis effect is a crucial concept in understanding the movement of objects and the development of weather patterns on our rotating planet.
Trade winds
Prevailing winds are winds that blow from a single direction over a specific area of the Earth. Generally, winds blow from high-pressure areas to low-pressure areas. The speed and direction of winds are influenced by factors such as the pressure gradient, surface friction, terrain features, and the Coriolis effect resulting from the Earth's rotation.
The term "trade winds" dates back to the 15th century when the Portuguese recognized their significance in navigation. Trade winds have facilitated sailing voyages and the establishment of trade routes across the Atlantic and Pacific Oceans. They enabled European colonization and influenced modern political geography by impacting the accessibility of certain regions during the Age of Sail.
The strength of trade winds affects weather patterns and neighbouring landmasses. Weaker trade winds result in increased rainfall, while stronger trade winds can suppress rainfall and impact air quality by transporting dust and particles. Trade winds also contribute to the formation of tropical storms and rainfall patterns in various regions, including North America, Southeast Asia, Madagascar, and East Africa.
The movement of air in the Earth's atmosphere creates distinct cells, including the Hadley cell, Ferrel cell, and Polar cell. Trade winds are associated with the Hadley cell, where surface air flows toward the equator, and the flow aloft moves toward the poles. The area near the equator characterized by calm, light variable winds is known as the doldrums or the Intertropical Convergence Zone (ITCZ). The ITCZ is a region of low pressure and wind convergence, where air masses rise and travel north and south due to intense solar heating.
Westerly winds
Prevailing winds are caused by the uneven heating of the Earth by the sun, which results in the movement of air. The Coriolis effect, caused by the rotation of the Earth, influences the direction of winds, making them twist counter-clockwise in the Northern Hemisphere and clockwise in the Southern Hemisphere.
The westerlies, or prevailing westerlies, are prevailing winds that blow from west to east in the middle latitudes between 30 and 60 degrees latitude. They originate from the high-pressure areas in the horse latitudes (around 30 degrees latitude) and move towards the poles, influencing the movement of extratropical cyclones. The westerlies are strongest in the winter hemisphere when the pressure is lower over the poles and weakest in the summer hemisphere when pressures are higher.
In the Northern Hemisphere, the westerlies are predominantly southwest winds, while in the Southern Hemisphere, they are predominantly northwest winds. The westerlies play a crucial role in transporting warm, equatorial waters and winds to the western coasts of continents, particularly in the Southern Hemisphere due to its vast oceanic expanse. The strongest westerly winds in the middle latitudes can occur in the roaring forties, between 40 and 50 degrees south latitude.
The currents in the Northern Hemisphere are generally weaker than those in the Southern Hemisphere due to differences in the strength of the westerlies between the two hemispheres. The westerlies of the Southern Hemisphere are less affected by standing disturbances and exhibit strong and consistent wind patterns, earning names like the roaring forties, furious fifties, or shrieking sixties.
The westerlies have a significant impact on weather patterns and the movement of air masses. For example, dust plumes from the Gobi Desert can combine with pollutants and spread over long distances downwind into North America due to the westerlies. Additionally, tropical cyclones that interact with the westerlies can be deflected towards low-pressure areas, influencing their track and behaviour.
Polar easterlies
Prevailing winds are caused by the uneven heating of the Earth by the sun. Generally, these winds blow from east to west, rather than north to south, due to the Coriolis effect, which is generated by the Earth's rotation. The Coriolis effect makes wind systems twist counter-clockwise in the Northern Hemisphere and clockwise in the Southern Hemisphere.
The polar easterlies, also known as the Polar Hadley cells, are prevailing winds that blow from the high-pressure areas of the polar highs at the North and South Poles towards the low-pressure areas within the westerlies at high latitudes. These winds are cold and dry and, unlike the westerlies, blow from east to west. They are often weak and irregular. The polar easterlies are one of three prevailing wind belts, the other two being the trade winds and the prevailing westerlies.
The polar easterlies are formed when cold air builds up and subsides at the poles, creating surface high-pressure areas. This outflow of air is deflected westward by the Coriolis effect. As the polar easterlies move toward the equator, they become warmer and less dense. At about 60 degrees north, part of the air mass rises and moves northward back toward the North Pole at high altitude, creating a band of low-pressure air known as the polar cell. This circulation cell is driven by the difference in pressure between the poles and 60 degrees north latitude.
The polar easterlies are important in driving the movement of air in the upper atmosphere. The pressure gradient causes air to move horizontally from high-pressure regions to low-pressure regions. This movement of air helps to balance out the pressure differences between the poles and lower latitudes.
The strength and direction of prevailing winds, including the polar easterlies, can be influenced by various factors such as terrain features, temperature differences, and the interaction with other wind systems. For example, in mountainous regions, local variations in wind can extend up to 2000 feet above the ground. Additionally, the interaction of polar easterlies with the trade winds and prevailing westerlies can impact their behaviour.
Jet streams
There are several jet streams circulating the globe, and they can be found in both the Northern and Southern Hemispheres. The polar jet streams are typically located between latitudes 30° and 60° (closer to 60°), while the subtropical jet streams are found near the equator, at a latitude of around 30°. These two types of jet streams can merge at certain locations and times, while at other times they remain separate. The polar jet streams are stronger and more influential on weather and aviation, often intruding into mid-latitudes. The northern polar jet flows over the northern latitudes of North America, Europe, and Asia, while the southern hemisphere polar jet mostly circles Antarctica. The subtropical jet streams are weaker and located at a higher altitude.
The formation and behaviour of jet streams are influenced by various factors. One key factor is the interaction between warm and cold air masses. Jet streams form when warm air rises and meets cold air in the atmosphere, creating an air current. This interaction is influenced by the uneven heating of the Earth by the sun, resulting in warmer air near the equator and colder air near the poles. Additionally, the Coriolis force, caused by the planet's rotation, affects the movement of air masses and contributes to the east-to-west flow of jet streams.
The El Niño-Southern Oscillation is a weather phenomenon that influences the location of jet streams, affecting weather patterns in the tropical Pacific Ocean and the climate of the tropics and subtropics. Jet streams have also been detected in the atmospheres of other planets in our solar system, such as Venus, Jupiter, Saturn, Uranus, and Neptune.
https://quartzmountain.org/article/do-prevailing-winds-travel-from-high-to-love-pressure
___________________________
Jet stream not getting 'wavier' despite Arctic warming
February 19, 2020
Rapid Arctic warming has not led to a "wavier" jet stream around the mid-latitudes in recent decades, pioneering new research has shown.
Scientists from the University of Exeter have studied the extent to which Arctic amplification—the faster rate of warming in the Arctic compared to places farther south—has affected the fluctuation of the jet stream's winding course over the North Hemisphere.
Recent studies have suggested the warming Arctic region has led to a "wavier" jet stream—which can lead to extreme weather conditions striking the US and Europe.
However, the new study by Dr. Russell Blackport and Professor James Screen, shows that Arctic warming does not drive a more meandering jet stream.
Instead, they believe any link is more likely to be a result of random fluctuations in the jet stream influencing Arctic temperatures, rather than the other way around.
The study is published in leading journal Science Advances on Wednesday 19 February 2020.
Dr. Blackport, a Research Fellow in Mathematics and lead author of the study, said: "While there does appear to be a link between a wavier jet stream and Arctic warming in year-to-year and decade-to-decade variability, there has not been a long-term increase in waviness in response to the rapidly warming Arctic."
Scientists have studied whether the jet stream's meandering course across the Northern Hemisphere is amplified by climate change in recent years.
https://phys.org/news/2020-02-jet-stream-wavier-arctic.html
___________________________
Blaming a wiggly jet stream on climate change? Not so fast
Feb 22, 2021
Some songs are earworms—catchy whether you like them or not. (I won’t infect the rest of your day with an example.) Some explanations in science seem to be the earworm equivalent: inherently intuitive, making them stick readily in the mind. That’s obviously the case for the hypothesis that a warming Arctic leads to a wigglier jet stream, producing weather extremes in the mid-latitudes like the recent epic cold snap in the central US.
The cold arrived after the spinning “polar vortex” in the upper atmosphere above the Arctic was disturbed in January, unleashing its contents southward as the jet stream detoured from its usual commute. Could this behavior actually be a consequence of global warming? The suggestion has appeared in news articles and Twitter threads across the land. But the idea is stickier than the science says it should be.
Jet setting
Although the specifics vary, the general idea is based on the fact that the Arctic is warming faster than the mid-latitudes. As a result, the temperature difference between them is getting a little smaller. The jet stream forms at the boundary between the Arctic and mid-latitude air, so a smaller temperature difference would weaken the jet stream. And a weaker jet stream is more prone to great, wiggling meanders that can bring you cold air from the north or warm air from the south.
Weather data from the last few decades contains some trends in the mid-latitudes, implying that the warming Arctic could be messing with weather patterns there. However, this is a case where the mantra “correlation is not causation” serves well. Climate scientists don’t just hunt for trends and then blame them all on human-caused climate change. They study the mechanisms that could drive those trends to evaluate which hypothesis (sometimes among many) can actually explain them.
Some modeling has found plausible linkages between certain patterns in our weather and things like Arctic warming, sea ice loss, and even snow-cover decline. But more commonly—as detailed by Carbon Brief after another US winter chill in 2019—models fail to demonstrate a linkage. It’s certainly possible that the models aren’t getting it right, but this should at least give us pause regarding any connections.
A 2017 study, for one example, concluded that trends in the stratospheric polar vortex were likely to be the result of natural variability rather than human-caused sea ice loss. And an article published in the journal Nature Climate Change last November noted that observations and studies in the last few years haven’t strengthened the case. “The short-term tendencies from the late 1980s through to early 2010s that fueled the initial speculation of Arctic influence have not continued over the past decade,” the authors wrote. “Long-term trends in the Arctic Oscillation and [jet stream] waviness, updated to winter 2019/20, are small and indistinguishable from internal variability.”
IPCC reports, too, have evaluated the state of the science on this question. The 2019 Special Report on the Ocean and Cryosphere in a Changing Climate checked in quite recently. “There is only low to medium confidence in the current nature of Arctic/mid-latitude weather linkages because conclusions of recent analyses are inconsistent,” the report stated. “Overall, changes in the stratospheric polar vortex and [Arctic Oscillation] are not separable from natural variability, and so cannot be attributed to greenhouse gas forced sea ice loss.”
Not conclusive
That said, some climate scientists do find the evidence that climate change helped cause the event convincing, even as others don’t. And this isn’t a fake debate involving a few contrarian gadflies, like those who reject human-caused warming altogether. There truly isn’t a consensus either way because the research doesn’t dictate a clear answer yet. That means that confident statements linking jet stream weirdness to a human-caused trend make many climate scientists grumpy.
So what can be said about the chill that just stretched down through the central US to Texas? While rare and extreme, it was not unprecedented. And as the Arctic gets warmer, the air that sometimes spills southward won’t be quite as frigid as it used to be. But science does not yet have a clear answer as to whether the mechanisms that control that spilling are changing with global warming. Instead, multiple competing answers are being tested.
Apart from assigning blame, this is significant for defining what weather extremes we can expect in the future. For now, climate science can’t tell you whether opening a winter coat business in Texas is a smart long-term investment—even if the wiggly jet stream hypothesis seems to make sense. Climate science can, however, confirm that winter still exists. It’s always wise to prepare for weather extremes that can trigger cascading failures of the systems that are meant to keep us safe.
https://arstechnica.com/science/2021/02/blaming-a-wiggly-jet-stream-on-climate-change-not-so-fast/
___________________________
Jet stream
https://en.wikipedia.org/wiki/Jet_stream
Jet streams are fast flowing, narrow air currents in the Earth's atmosphere.[1]
The main jet streams are located near the altitude of the tropopause and are westerly winds, flowing west to east around the globe. The northern hemisphere and the southern hemisphere each have a polar jet around their respective polar vortex at around 30,000 ft (5.7 mi; 9.1 km) above sea level and typically travelling at around 110 mph (180 km/h) although often considerably faster.[2] Closer to the equator and somewhat higher and somewhat weaker is a subtropical jet.[2]
The northern polar jet flows over the middle to northern latitudes of North America, Europe, and Asia and their intervening oceans, while the southern hemisphere polar jet mostly circles Antarctica.[3] Jet streams may start, stop, split into two or more parts, combine into one stream, or flow in various directions including opposite to the direction of the remainder of the jet.[4]
The El Niño–Southern Oscillation affects the location of the jet streams, which in turn affects the weather over the tropical Pacific Ocean and affects the climate of much of the tropics and subtropics, and can affect weather in higher-latitude regions. The term "jet stream" is also applied to some other winds at varying levels in the atmosphere, some global (such as the higher-level polar-night jet), some local (such as the African easterly jet). Meteorologists use the location of some of the jet streams as an aid in weather forecasting. Airlines use them to reduce some flight times and fuel consumption. Scientists have considered whether the jet streams might be harnessed for power generation. In World War II, the Japanese used the jet stream to carry Fu-Go balloon bombs across the Pacific Ocean to launch small attacks on North America.
Jet streams have been detected in the atmospheres of Venus, Jupiter, Saturn, Uranus, and Neptune.
Polar jet stream
The thermal wind relation does not explain why the winds are organized into tight jets, rather than distributed more broadly over the hemisphere. One factor that contributes to the creation of a concentrated polar jet is the undercutting of sub-tropical air masses by the more dense polar air masses at the polar front. This causes a sharp north–south pressure (south–north potential vorticity) gradient in the horizontal plane, an effect which is most significant during double Rossby wave breaking events.[35] At high altitudes, lack of friction allows air to respond freely to the steep pressure gradient with low pressure at high altitude over the pole. This results in the formation of planetary wind circulations that experience a strong Coriolis deflection and thus can be considered 'quasi-geostrophic'. The polar front jet stream is closely linked to the frontogenesis process in midlatitudes, as the acceleration/deceleration of the air flow induces areas of low/high pressure respectively, which link to the formation of cyclones and anticyclones along the polar front in a relatively narrow region.[24]
Subtropical jet
A second factor which contributes to a concentrated jet is more applicable to the subtropical jet which forms at the poleward limit of the tropical Hadley cell, and to first order this circulation is symmetric with respect to longitude. Tropical air rises to the tropopause, and moves poleward before sinking; this is the Hadley cell circulation. As it does so it tends to conserve angular momentum, since friction with the ground is slight. Air masses that begin moving poleward are deflected eastward by the Coriolis force (true for either hemisphere), which for poleward moving air implies an increased westerly component of the winds[36]
Changes due to climate cycles
Effects of ENSO
El Niño–Southern Oscillation (ENSO) influences the average location of upper-level jet streams, and leads to cyclical variations in precipitation and temperature across North America, as well as affecting tropical cyclone development across the eastern Pacific and Atlantic basins. Combined with the Pacific Decadal Oscillation, ENSO can also impact cold season rainfall in Europe.[56] Changes in ENSO also change the location of the jet stream over South America, which partially affects precipitation distribution over the continent.[57]
El Niño
During El Niño events, increased precipitation is expected in California due to a more southerly, zonal, storm track.[58] During the Niño portion of ENSO, increased precipitation falls along the Gulf coast and Southeast due to a stronger than normal, and more southerly, polar jet stream.[59] Snowfall is greater than average across the southern Rockies and Sierra Nevada mountain range, and is well below normal across the Upper Midwest and Great Lakes states.[60] The northern tier of the lower 48 exhibits above normal temperatures during the fall and winter, while the Gulf coast experiences below normal temperatures during the winter season.[61][62] The subtropical jet stream across the deep tropics of the northern hemisphere is enhanced due to increased convection in the equatorial Pacific, which decreases tropical cyclogenesis within the Atlantic tropics below what is normal, and increases tropical cyclone activity across the eastern Pacific.[63] In the southern hemisphere, the subtropical jet stream is displaced equatorward, or north, of its normal position, which diverts frontal systems and thunderstorm complexes from reaching central portions of the continent.[57]
La Niña
Low-level jets
There are wind maxima at lower levels of the atmosphere that are also referred to as jets.
Barrier jet
A barrier jet in the low levels forms just upstream of mountain chains, with the mountains forcing the jet to be oriented parallel to the mountains. The mountain barrier increases the strength of the low level wind by 45 percent.[113] In the North American Great Plains a southerly low-level jet helps fuel overnight thunderstorm activity during the warm season, normally in the form of mesoscale convective systems which form during the overnight hours.[114] A similar phenomenon develops across Australia, which pulls moisture poleward from the Coral Sea towards cut-off lows which form mainly across southwestern portions of the continent.[115]
Coastal jet
Coastal low-level jets are related to a sharp contrast between high temperatures over land and lower temperatures over the sea and play an important role in coastal weather, giving rise to strong coast parallel winds.[116] Most coastal jets are associated with the oceanic high-pressure systems and thermal low over land and are mainly located along cold eastern boundary marine currents, in upwelling regions offshore California, Peru–Chile, Benguela, Portugal, Canary and West Australia, and offshore Yemen–Oman.[116]
Valley exit jet
A valley exit jet is a strong, down-valley, elevated air current that emerges above the intersection of the valley and its adjacent plain. These winds frequently reach speeds of up to 20 m/s (72 km/h; 45 mph) at heights of 40–200 m (130–660 ft) above the ground. Surface winds below the jet tend to be substantially weaker, even when they are strong enough to sway vegetation.
Valley exit jets are likely to be found in valley regions that exhibit diurnal mountain wind systems, such as those of the dry mountain ranges of the US. Deep valleys that terminate abruptly at a plain are more impacted by these factors than are those that gradually become shallower as downvalley distance increases.[117]
Africa
There are several important low-level jets in Africa. Numerous low-level jets form in the Sahara, and are important for the raising of dust off the desert surface. This includes a low-level jet in Chad, which is responsible for dust emission from the Bodélé Depression,[118] the world's most important single source of dust emission. The Somali Jet, which forms off the East African coast is an important component of the global Hadley circulation,[119] and supplies water vapour to the Asian Monsoon.[120] Easterly low-level jets forming in valleys within the East African Rift System help account for the low rainfall in East Africa and support high rainfall in the Congo Basin rainforest.[121] The formation of the thermal low over northern Africa leads to a low-level westerly jet stream from June into October, which provides the moist inflow to the West African monsoon.[122]
While not technically a low-level jet, the mid-level African easterly jet (at 3000–4000 m above the surface) is also an important climate feature in Africa. It occurs during the northern hemisphere summer between 10°N and 20°N above in the Sahel region of West Africa.[123] It is considered to play a crucial role in the West African monsoon,[124] and helps form the tropical waves which move across the tropical Atlantic and eastern Pacific oceans during the warm season.
Other planets
For other planets, internal heat rather than solar heating is believed to drive their jet streams. Jupiter's atmosphere has multiple jet streams caused by the convection cells driven by internal heating. These form the familiar banded color structure.
___________________________
One Mystery of Jet Streams Explained
October 17, 2008
Planetary scientists have long puzzled over why fast-movingrivers of air called jet streams flow eastward at the equator of Jupiter and Saturn, but go westward on Uranus and Neptune. Now a new simulation has begununraveling that mystery by showing how turbulent thunderstorms create the jetstreams.
Whether a jet stream flows east or west seems to dependon the amount of water vapor in a planet's atmosphere — but researchers confessthat the "how" stilleludes them.
"Under these conditions, the eastward equator flowprefers low water vapor abundance," said Yuan Lian, an atmosphericdynamics researcher at the University of Arizona in Tucson. "The westwardequator flow prefers high water vapor abundance. However, we still don't knowexactly how this happens."
The equatorial jet stream goes westward onEarth, but all the other jet streams on our planet go eastward, including theone that frequently dipsdown from the Arctic to bring winter storms across North America.
Rivers of air
Jet streams feed on swirling eddies that can form thebasis of thunderstorms on giant planets. Eddies don't necessarily all mergetogether to form a jet stream — some can simply spin off their angular momentuminto the jet to sustain howling wind speeds.
Some jet streams have clocked in at 400 mph (644 km/h) onJupiter, and almost 900 mph (1,448 km/h) on Saturn and Neptune. Wind speedson Venus can hit almost230 mph (370 km/h).
"You have a little vortex that gets stretched outand sheared apart by the wind," said Adam Showman, a planetary scientistat the University of Arizona. "As it's shearing apart, it gives the jetstream a little push."
Eddies and vortexes themselves form from rising watervapor. The vapor condenses in the cooler upper latitudes of planet atmospheresand releases energy in the form of heat, which disturbs the surroundingatmosphere.
Simulating the flow
Showman and Lian estimated that Uranus and Neptunecontain 10 times as much water vapor as Jupiterand Saturn. They plugged the data into their simulation runs and found thatthey came up with jet streams with directions matching those observed on eachplanet.
"We took our best guess with our best models foreach of the planets," Showman told SPACE.com. "We did a bunchof simulations varying the water. Even if we don't think the planet has thatamount, it allows us to understand role of water in that simulation."
The simulations also came up with the 20 jet streams eachfor Jupiter and Saturn, as well as three jet streams each for Uranus andNeptune. Likewise, they produced simulated storms similar to thunderstorms previouslyspotted on Jupiter and Saturn.
Yet the question remains as to why jet streams at theequator go either east or west.
Stability, stability
Without knowing the details, researchers can onlyspeculate on water vapor condensation creating a topsy-turvyatmosphere. A more unstable atmosphere may result in jet streams thathappen to form in an eastward- or westward-running direction.
"When you have this occurring in a complicated 3-Dcirculation, it can develop latitudinal temperature differences," Showmannoted. "More water vapor means more temperature differences that changethe stability of the atmosphere."
However, a better understanding will have to wait forimproved simulations. Lian pointed out that the simulated jet streams did notquite reach the high speeds of real jet streams. The current model also ignoredsome processes such as precipitation, evaporation and cloud formation.
"We want to include as many factors as we can,"Lian said. "That way, we can probably produce jet speeds similar toobservations."
The findings were detailed at the 40th annual meeting ofDivision of Planetary Sciences of the American Astronomy Society in Ithaca, NewYork.
https://www.space.com/5991-mystery-jet-streams-explained.html
___________________________
Eddies and the Distribution of Eddy Kinetic Energy in the Arctic Ocean
April 27, 2022
Mesoscale eddies are important to many aspects of the dynamics of the Arctic Ocean. Among others, they maintain the halocline and interact with the Atlantic Water circumpolar boundary current through lateral eddy fluxes and shelf-basin exchanges. Mesoscale eddies are also important for transporting biological material and for modifying sea ice distribution. Here, we review what is known about eddies and their impacts in the Arctic Ocean in the context of rapid climate change. Eddy kinetic energy (EKE) is a proxy for mesoscale variability in the ocean due to eddies. We present the first quantification of EKE from moored observations across the entire Arctic Ocean and compare those results to output from an eddy resolving numerical model. We show that EKE is largest in the northern Nordic Seas/Fram Strait and it is also elevated along the shelf break of the Arctic Circumpolar Boundary Current, especially in the Beaufort Sea. In the central basins, EKE is 100–1,000 times lower. Generally, EKE is stronger when sea ice concentration is low versus times of dense ice cover. As sea ice declines, we anticipate that areas in the Arctic Ocean where conditions typical of the North Atlantic and North Pacific prevail will increase. We conclude that the future Arctic Ocean will feature more energetic mesoscale variability.
___________________________
Eddy activity in the Arctic Ocean projected to surge in a warming world
10 January 2024
Abstract
Ocean eddies play a critical role in climate and marine life. In the rapidly warming Arctic, little is known about how ocean eddy activity will change because existing climate models cannot resolve Arctic Ocean mesoscale eddies. Here, by employing a next-generation global sea ice–ocean model with kilometre-scale horizontal resolution in the Arctic, we find a surge of eddy kinetic energy in the upper Arctic Ocean, tripling on average in a four-degree-warmer world. The driving mechanism behind this surge is an increase in eddy generation due to enhanced baroclinic instability. Despite the decline of sea ice, eddy killing (a process in which eddies are dampened by sea ice and winds) will not weaken in its annual mean effect in the considered warming scenario. Our study suggests the importance of adequately representing Arctic eddy activity in climate models for understanding the impacts of its increase on climate and ecosystems.
https://www.nature.com/articles/s41558-023-01908-w
___________________________
Arctic Ocean Amplification in a warming climate in CMIP6 models
27 Jul 2022
https://www.science.org/doi/10.1126/sciadv.abn9755
___________________________
Arctic amplification study examines Atlantic meridional overturning circulation's influence on accelerated warming
October 9, 2024
https://phys.org/news/2024-10-arctic-amplification-atlantic-meridional-overturning.html
___________________________
Impact of ocean vertical-mixing parameterization on Arctic sea ice and upper-ocean properties using the NEMO-SI3 model
___________________________
The Vertical Structure of Turbulence Kinetic Energy Near the Arctic Sea-Ice Surface
10 November 2024
Abstract
Atmospheric turbulence over the Arctic sea-ice surface has been understudied due to the lack of observational data. In this study, we focus on the turbulence kinetic energy (TKE) over sea ice and distinguish its two different vertical structures, the “Surface” type and the “Elevated” type, using observations during the Multidisciplinary drifting Observatory for the Study of Arctic Climate expedition (MOSAiC). The “Surface” type has the maximum TKE near the surface (at 2 m), while the “Elevated” type has the maximum TKE at a higher level (6 m). The TKE budget analysis indicates that the “Elevated” type is caused by the increased shear production of TKE at 6 m. In addition, spectral analysis reveals that the contribution to TKE by horizontal large eddies is enhanced in the “Elevated” type. Finally, how the vertical structure of TKE affects the parameterization of turbulent momentum flux is discussed.
Key Points
-
The vertical structures of turbulence kinetic energy (TKE) over the Arctic sea-ice surface are investigated using MOSAiC data
-
Budget analysis and spectral analysis are used to analyze TKE vertical structures near the Arctic sea-ice surface
-
The TKE vertical structures affect the performance of commonly used turbulence parameterizations
Plain Language Summary
In recent years, the Arctic near-surface temperature has increased at a rate that is 3–4 times faster than the global average, which has significant impacts on the global climate. Explaining this phenomenon and predicting future scenarios are urgently needed. Turbulent motions within the Arctic atmospheric boundary layer over the sea-ice surface play an important role in determining near-surface temperature variations, but these turbulent motions and their impacts are not thoroughly understood. To enhance our understanding of the turbulent characteristics of the Arctic boundary layer, the Multidisciplinary drifting Observatory for the Study of Arctic Climate (MOSAiC) was conducted in the central Arctic and collected a wealth of data. Based on the MOSAiC observational data, we investigate the vertical structures of turbulence kinetic energy (TKE) in the surface layer and two different vertical structures of TKE are distinguished. We then compare the production of TKE between these two vertical structures. In addition, we evaluate the performance of parameterization schemes for momentum flux under different vertical TKE structures.
https://agupubs.onlinelibrary.wiley.com/doi/full/10.1029/2024GL110792
___________________________
Spatial Scales of Kinetic Energy in the Arctic Ocean
16 March 2024
Despite the importance of the Arctic Ocean for the large‐scale circulation and climate, there is still a knowledge gap in our understanding of the spatial characteristics of the Arctic Ocean circulation, especially for the mesoscale. This paper investigates the spatial characteristics of the Arctic Ocean circulation using a simulation with 1 km horizontal resolution. We revealed that there are two peaks in the kinetic energy (KE) spectral density at the 400 m depth, one at the gyre scale of the Arctic Circumpolar Boundary Current (centered at 1,700–2,000 km), and the other associated with the mesoscale (at about 60 km). However, at the 70 m depth, the boundary currents tend to mask the spectrum peak associated with the mesoscale. The KE spectrum exhibits a power‐law scaling typical for ocean eddies. We found that about 80% (50%) of the KE is on scales smaller than 100 km (30 km). The maximum KE content is in the 10–20 km scale band in most of the eddy‐rich regions of the abyssal ocean. The seasonality of the KE spectrum and KE content inside the Arctic Ocean follow the seasonality of eddy activity and baroclinicity, with low values in spring and maxima in late summer to autumn, and the seasonal variation is stronger at the 70 m depth than the 400 m depth. The strong concentration of KE on the very small spatial scales warrants future studies on energy transfer between scales in the Arctic Ocean.
https://agupubs.onlinelibrary.wiley.com/doi/10.1029/2023JC020013
___________________________
Jet Stream Manipulation Is Fueling Weather Extremes
January 11, 2015
Jet Stream Re-Mangled: Record Winds Rage Over Scotland As Polar Amplification Ramps Up Yet Again
https://www.geoengineeringwatch.org/jet-stream-manipulation-is-fueling-weather-extremes/
___________________________
Polar vortex crystals: Emergence and structure
April 19, 2022
Significance
https://www.pnas.org/doi/10.1073/pnas.2120486119
___________________________
Vortex crystals at Jupiter’s poles: Emergence controlled by initial small-scale turbulence
2024
https://www.sciencedirect.com/science/article/pii/S0019103524004986
___________________________
Moiré polar vortex, flat bands, and Lieb lattice in twisted bilayer BaTiO3
20 Nov 2024
https://www.science.org/doi/10.1126/sciadv.adq0293
___________________________
Kinematics analysis of polar vortex identifies new transport barrier involved in ozone depletion
Ozone holes typically occur near Earth’s poles in part due to a stratospheric polar vortex’s ability to confine the chemical reactions required for ozone depletion. Geodesic vortex detection is used to objectively identify transient vortices that defy the typical deformation found in such two-dimensional turbulence but is limited by the three-dimensional shape of polar stratospheric circulation.
Researchers have previously developed a refined model for geodesic vortex detection to accommodate 2D Riemannian manifolds that allows them to analyze the life cycle of a polar vortex from birth to death. Focusing on the kinematic characteristics of a sudden warming event in 2002 in.which the Southern Hemisphere stratospheric polar vortex split, the methodology of Andrade-Canto et al. offers new insights into the kinematics of ozone depletion within vortices.
As a result of a rare warming event in 2002, the polar vortex in the Southern Hemisphere bifurcated, generating data the group used to study the full life cycle of a vortex.
Previous methodologies using geodesic vortex detection at poles remain challenging because the polar stratospheric circulation evolves on a curved surface representing a spherical cap, which makes studying such phenomena as a flat plane an oversimplification.
While prior studies focused on the confinement effects at the edges of vortices, the group’s model identified a new, initial confinement effect attributed to the inner, shorter-lived transport barrier.
“Our extension involves enabling the method to function on curved surfaces thereby expanding its applicability beyond Euclidean geometry,” said author Fernando Andrade-Canto. “This enhancement is particularly significant for the analysis of the stratospheric polar vortex.”
The group next looks to further study underlying mechanisms for formation of this inner transport barrier.
___________________________
Evidence linking rapid Arctic warming to mid-latitude weather patterns
13 July 2015
Abstract
The effects of rapid Arctic warming and ice loss on weather patterns in the Northern Hemisphere is a topic of active research, lively scientific debate and high societal impact. The emergence of Arctic amplification—the enhanced sensitivity of high-latitude temperature to global warming—in only the last 10–20 years presents a challenge to identifying statistically robust atmospheric responses using observations. Several recent studies have proposed and demonstrated new mechanisms by which the changing Arctic may be affecting weather patterns in mid-latitudes, and these linkages differ fundamentally from tropics/jet-stream interactions through the transfer of wave energy. In this study, new metrics and evidence are presented that suggest disproportionate Arctic warming—and resulting weakening of the poleward temperature gradient—is causing the Northern Hemisphere circulation to assume a more meridional character (i.e. wavier), although not uniformly in space or by season, and that highly amplified jet-stream patterns are occurring more frequently. Further analysis based on self-organizing maps supports this finding. These changes in circulation are expected to lead to persistent weather patterns that are known to cause extreme weather events. As emissions of greenhouse gases continue unabated, therefore, the continued amplification of Arctic warming should favour an increased occurrence of extreme events caused by prolonged weather conditions.
https://royalsocietypublishing.org/doi/10.1098/rsta.2014.0170
___________________________
Study finds Arctic warming three-fold compared to global patterns
June 12, 2024
https://phys.org/news/2024-06-arctic-global-patterns.html
___________________________
Why Polar Air Keeps Breaking out of the Arctic
Every once in a while, cold Arctic air comes to visit the mid-latitudes. The polar jet stream, which marks the boundary between cold polar air and warmer mid-latitude air, can dip south from its usual perch circling the Arctic and bring freezing cold temperatures. But what is the polar jet stream? It is easy to confuse the polar jet stream with the term “polar vortex,” but they are not the same thing. The polar vortex is a band of strong westerly winds located 16-50 kilometers (10-30 miles) above Earth’s surface in the stratosphere. The polar jet stream occurs in the troposphere at altitudes of 8-14 km (5-9 miles). The stratospheric polar vortex and the tropospheric polar jet stream can interact, but the polar jet stream also varies in association with weather events and large-scale atmospheric circulations.
Meanders in the Polar Jet Stream Can Bring Cold Arctic Air South
The polar jet stream is the culprit affecting mid-latitude winter weather. A complex combination of factors sets up these interactions between cold Arctic air and the mid-latitudes. While the polar jet stream tends to mark the boundary between warmer air at lower latitudes and the colder air that often remains contained over the Arctic, the polar jet stream can sometimes develop a more “wavy” or meandering pattern. The meandering causes the large mass of cold air situated over the Arctic to wobble, and, like a toupee that goes askew, cold polar air can slip southward to affect locations in the United States, Europe, and Asia. When the polar jet stream meanders southward across the United States, the cold polar air can push as far south as Texas and the Gulf Coast.
A Warming Arctic Complicates This Pattern
The pattern is further complicated by the overall warming of the Arctic, which is occurring at a faster rate than for other areas of the planet. This rapid warming has already been linked to sea ice losses in the Arctic, and scientists are exploring the effects of these changes across other parts of the planet.
The effects of Arctic warming and sea ice loss on the polar jet
stream aren’t fully understood, but it’s possible that more frequent
visits of polar air to mid-latitudes could occur as a result of these
changes. Mid-latitude extreme cold events will continue to happen
because of natural variability in the climate system. It
is currently uncertain from the observational record whether these
meanderings of the jet stream are becoming more or less frequent, and
there is an active debate within the scientific community on this topic.
As the outbreaks of cold Arctic air to mid-latitudes happen, the
overall warming in the climate system means that the temperature swings
felt at mid-latitudes can be quite large. Temperatures can be warmer
than normal for the season but quickly drop by 16°C (30°F) or more as
Arctic air moves south.
https://scied.ucar.edu/learning-zone/climate-change-impacts/why-polar-vortex-keeps-breaking-out-arctic
___________________________
Crazy weather traced to Arctic's impact on jet stream
2014
https://www.newscientist.com/article/dn26278-crazy-weather-traced-to-arctics-impact-on-jet-stream/
___________________________
A strong North Pacific ridge rises into the Arctic Circle, pushing the jet stream and colder weather deeper across the United States in January 2022
___________________________
Inter-model diversity in jet stream changes and its relation to Arctic climate in CMIP5
19 September 2015
https://link.springer.com/article/10.1007/s00382-015-2833-5
___________________________
Scientists discuss how strongly a warming Arctic is implicated in extreme weather
9 January 2015
The possibility that a warming Arctic could be influencing extreme weather elsewhere in the world seemed to receive a boost this week. A new paper presented further evidence linking diminishing Arctic sea ice to extreme cold winters elsewhere in the northern hemisphere.
Lead author, Prof Jennifer Francis from Rutgers University, tells us: “Our new results, together with other new studies in this field of research, are adding substantial evidence in support of the connection.”
But not everyone is so sure. We asked a few scientists in the field how strong they consider the evidence linking Arctic sea ice and extreme weather to be. Here’s what they told us.
Arctic amplification
The US, Canada, Japan and UK have all experienced very cold and snowy winters in recent years. In 2012, a paper by Francis and Dr Stephen Vavrus suggested that this extreme weather was a result of rapid warming in the Arctic.
Temperatures in the Arctic are increasing around twice as fast as the global average, a phenomenon known as Arctic amplification. As Arctic sea-ice diminishes, energy from the sun that would have been reflected away by sea-ice is instead absorbed by the ocean.
Francis and Vavrus suggested that warmer Arctic temperatures weaken the jet stream, a fast-flowing river of air high up in the atmosphere. The theory goes that a weaker jet stream becomes ‘wavier’ and leads to more persistent weather conditions, such as long cold spells in winter and heatwaves in summer.
The new paper by the same authors, published this week in Environmental Research Letters, offers further evidence to support the link.
Jet stream waviness
Francis and Vavrus’ work triggered what has become a lively area of research. One of the difficulties with the theory proposed is that it’s very hard to measure the ‘waviness’ of the jet stream directly. Instead, Francis and Vavrus use a number of metrics to measure it in other ways.
One method tries to see the mechanism in action by looking for evidence of temperature differences causing wind patterns to change and the jet stream to get wavier. Another way looks at whether these wavy jet stream patterns are occurring more frequently across the northern hemisphere.
Identifying these patterns of waviness is important because they lead to ‘blocking’, which causes cold weather patterns to hold on for longer. In the 2013-14 US winter, the prolonged spell of very cold weather caused 91 per cent of the Great Lakes to freeze over.
Francis says we’re seeing more of this persistent extreme weather as the Arctic warms up:
“Occurrence of these events has increased during recent decades when Arctic amplification has emerged as a strong signal.”
Arctic amplification is greatest in autumn and winter (see graph below), which is why it mainly results in persistent cold weather events, Francis explains.
Controversial theory
Understanding the effect Arctic amplification could be having in other parts of the world is tricky because it’s a relatively recent phenomenon. Francis and Vavrus define the ‘Arctic amplification era’ as beginning in 1995, which gives scientists less than 20 years’ of data to work with.
As Dr James Screen from Exeter University tells us:
“The changes are only seen over a very short period, so it is impossible to say if they are secular trends or just natural variability.”
Another issue is how you define jet stream ‘waviness’, as Prof Ian Simmonds from the University of Melbourne explains:
“Getting an appropriate definition is important, as conclusions as to whether waviness is increasing or decreasing seem to depend on the metrics being used.”
As a result, not all scientists have been won over by the theory. Francis acknowledges that Arctic warming contributing to a wavier jet stream is the “most controversial aspect of the hypothesis we proposed in our 2012 paper.”
The Arctic may not be to blame
Scientists also haven’t ruled out other factors being involved in the extreme weather, as Screen tells us:
“Correlation and trends doesn’t tell you cause and effect. It is still impossible to pin the blame on the Arctic, so to speak.”
A paper published in October last year, for example, finds that temperature changes in the Atlantic ocean could be triggering warm conditions in the Arctic, and cold weather over Europe and Asia. Simmonds says findings such as these mean there is still doubt regarding the Arctic’s influence:
“Seen in this light, the magnitude of the direct influence of a warm Arctic on mid-latitude extremes becomes more problematic.”
So it seems that scientists are still some way from agreeing on what’s causing these cold winters. As Screen puts it:
“Without evidence of causality or a convincing dynamical mechanism, I would say the evidence still remains suggestive but far from conclusive.”
Pinpointing if and how the Arctic is implicated in extreme weather around the rest of the world is clearly of huge interest, stretching beyond just scientific circles. But teasing out the details is still a very new and active area of research, making this topic one to watch in 2015.
___________________________
Extreme cold prompted by jet stream 'not because of Arctic warming', scientists say
19 February 2020
https://www.standard.co.uk/news/uk/arctic-warming-cold-weather-uk-jet-stream-a4366531.html
___________________________
A simple climatology of westerly jet streams in global reanalysis datasets part 1: mid-latitude upper tropospheric jets
19 March 2015
https://link.springer.com/article/10.1007/s00382-015-2560-y
___________________________
Weak jet stream likely to blame for region's mild winter, persisting drought
___________________________
Arctic-midlatitude weather linkages in North America
2018
https://www.sciencedirect.com/science/article/pii/S1873965217301160
___________________________
Polar vortex: What are they and why are they happening?
16 February 2021
A freezing air mass from the Arctic Circle is pushing downwards through Alaska to the Midwest and East Coast of the US.
https://news.sky.com/story/polar-vortex-what-are-they-and-why-are-they-happening-12219938
___________________________
Jet Stream - Current of Rapidly Moving Air
2010
http://ww2010.atmos.uiuc.edu/(Gh)/guides/mtr/cyc/upa/jet.rxml
___________________________
The southern jet stream is moving back to normal thanks to global efforts
2020
Have you ever heard of the southern jet stream? It’s a powerful wind that shapes weather patterns and ocean currents in the southern hemisphere, particularly in the summer. Up until about 2000, it had been shifting from its usual course and moving southwards towards the Antarctic at a rate of one degree of latitude each decade, affecting storm tracks and rainfall over South America, East Africa, and Australia.
Affected by holes in the ozone layer
Previous research has shown this was primarily driven by the depletion of the ozone layer by manmade chemical compounds such as chlorofluorocarbons and hydrochlorofluorocarbons, found in fridges, aerosols and other industrial processes. These chemicals, which were used in vast quantities until they started to be phased out under the United Nations 1987 Montreal protocol, thinned the ozone layer, causing a widening “hole” high above the south pole that affected wind patterns.
Back on track
But according to a paper, the Montreal protocol made a huge impact. Not only has it allowed the ozone repair itself, but its also helping to return the southern jet stream to a normal state after decades of human-caused disruption. The new paper, published in the journal Nature, shows that the Montreal protocol has paused the southward movement of the jet stream since the turn of the century and may even be starting to reverse it as the ozone hole begins to close.
Last September, satellite images revealed the ozone hole annual peak had shrunk to 16.4m sq km, the smallest extent since 1982. It’s a success story in international cooperation and should motivate us further as we fight to spare the planet from the climate crisis.
___________________________
When the jet stream weakens
06/11/2022
The northern polar jet stream is weakening in strength as a result of
climate change. That's causing the band of wind to sway off course.
Meteorologist Marion Maturilli is carrying out research to understand
the wide-ranging impact of this trend.
https://www.dw.com/en/when-the-jet-stream-weakens/av-62097932
___________________________
Distribution of Jet Streams in the North Atlantic, Europe and the Mediterranean, 1957–8
18 January 2010
https://www.cambridge.org/core/journals/journal-of-navigation/article/abs/distribution-of-jet-streams-in-the-north-atlantic-europe-and-the-mediterranean-19578/DC87B90C962F839BFC0B8712352687F5
___________________________
Ozone depletion trumps greenhouse gas increase in jet-stream shift
January 31, 2013
UNIVERSITY PARK, Pa. -- Depletion of Antarctic ozone is a more important factor than increasing greenhouse gases in shifting the Southern Hemisphere jet stream in a southward direction, according to researchers at Penn State.
"Previous research suggests that this southward shift in the jet stream has contributed to changes in ocean circulation patterns and precipitation patterns in the Southern Hemisphere, both of which can have important impacts on people's livelihoods," said Sukyoung Lee, professor of meteorology.
According to Lee, based on modeling studies, both ozone depletion and greenhouse gas increase are thought to have contributed to the southward shift of the Southern Hemisphere jet stream, with the former having a greater impact. But until now, no one has been able to determine the extent to which each of these two forcings has contributed to the shift using observational data.
"Understanding the differences between these two forcings is important in predicting what will happen as the ozone hole recovers," she said. "The jet stream is expected to shift back toward the north as ozone is replenished, yet the greenhouse-gas effect could negate this."
Lee and her colleague, Steven Feldstein, professor of meteorology, developed a new method to distinguish between the effects of the two forcings. The method uses a cluster analysis to investigate the effects of ozone and greenhouse gas on several different observed wind patterns.
"When most people look at ozone and greenhouse gases, they focus on one wind pattern, but my previous research suggests that, by looking at several different but similar patterns, you can learn more about what is really happening," said Feldstein.
In their study, the researchers analyzed four wind patterns. The first wind pattern corresponded to an equatorward shift of the midlatitude westerlies toward the equator. The second pattern also described an equatorward shift, but included a strong tropical component. The third pattern corresponded to a poleward shift of the westerlies toward the South Pole with a weakening in the maximum strength of the jet. The fourth pattern corresponded to a smaller poleward jet shift with a strong tropical component.
In addition to their novel inclusion of more than one wind pattern in their analysis, the scientists investigated the four wind patterns at very short time scales.
"Climate models are usually run for many years; they don't look at the day-to-day weather," said Feldstein. "But we learned that the four wind patterns fluctuate over about 10 days, so they change on a time scale that is similar to daily weather. This realization means that by taking into account fluctuations associated with the daily weather, it will be easier to test theories about the mechanism by which ozone and greenhouse gases influence the jet stream."
The researchers used an algorithm to examine the relationship between daily weather patterns and the four wind patterns. They found that the first wind pattern -- which corresponded to an equatorward shift of the midlatitude westerlies -- was associated with greenhouse gases. They also found that the third pattern -- which corresponded to a poleward shift of the westerlies -- was associated with ozone. The other two wind patterns were unrelated to either of the forcings. The researchers found that a long-term decline in the frequency of the first pattern and a long-term increase in the frequency of the third pattern can explain the changes in the Southern Hemisphere jet stream.
"Ozone had the bigger impact on the change in the position of the jet stream," said Lee. "The opposite is likely true for the Northern Hemisphere; we think that ozone has a limited influence on the Northern Hemisphere. Understanding which of these forcings is most important in certain locations may help policy makers as they begin to plan for the future."
In addition to finding that ozone is more important than greenhouse gases in influencing the jet-stream shift, the scientists also found evidence for a mechanism by which greenhouse gases influence the jet-stream shift. They learned that greenhouse gases may not directly influence the jet-stream shift, but rather may indirectly influence the shift by changing tropical convection or the vertical transfer of heat in large-scale cloud systems, which in turn, influences the jet shift. The researchers currently are further examining this and other possible mechanisms for how greenhouse gases and ozone influence the jet stream as well as Antarctic sea ice.
The results will appear in the Feb. 1 issue of the journal Science.
"Not only are the results of this paper important for better understanding climate change, but this paper is also important because it uses a new approach to try to better understand climate change; it uses observational data on a short time scale to try to look at cause and effect, which is something that is rarely done in climate research," said Feldstein. "Also, our results are consistent with climate models, so this paper provides support that climate models are performing well at simulating the atmospheric response to ozone and greenhouse gases."
https://www.psu.edu/news/research/story/ozone-depletion-trumps-greenhouse-gas-increase-jet-stream-shift/
___________________________
Dominoes fall: Vanishing Arctic ice shifts jet stream, which melts Greenland glaciers
___________________________
Aerosols have an outsized impact on extreme weather
Scientists have tied a shift in winter weather patterns in Europe and northern Eurasia to a reduction in aerosols -- solid particles polluting the atmosphere from activities such as burning coal.
Over
the past 50 years, the occurrence of extremely cold days has decreased
throughout the region, which includes Russia. Combining long-term
observations with a state-of-the-art climate model revealed what
researchers describe as an "unambiguous signature" of the reduced
release of man-made aerosols over that time.
That
has caused changes in the wintertime Northern Hemisphere polar jet
stream (a swiftly moving channel of air flowing from west to east) and
surface temperature variability.
The
National Science Foundation-supported work suggests that aerosols can
have a stronger impact on extreme winter weather than greenhouse gases
at the regional scale, although the relationship between aerosols and
extreme weather is complex.
"This
discovery underscores the importance of understanding the effects of
anthropogenic aerosols for accurate climate projection of extreme
weather events, which is crucial to formulating climate mitigation and
adaptation strategies," says Yuan Wang, a scientist at Caltech and the
Jet Propulsion Laboratory and lead author of the study published in
Nature Climate Change.
Wang
and his colleagues found that warmer temperatures in Europe led to a
stronger temperature gradient between Europe and the North Pole, which
in turn helped lock the jet stream into a stable, relatively straight
position.
When
the jet stream meanders, dipping south, it can carry cold arctic air to
more southern latitudes. Some climate models have predicted that the
steady increase in arctic temperature, caused by greenhouse gas-driven
global warming, could weaken the jet stream and cause it to meander.
Wang's team has found a complicated underlying mechanism.
"The
importance of this study lies in revealing the link between human-made
atmospheric particles and long-term variability of extreme winter
weather," says Chungu Lu, a program director in NSF's Division of
Atmospheric and Geospace Sciences.
https://beta.nsf.gov/news/aerosols-have-outsized-impact-extreme-weather
___________________________
Global Ban on Ozone-Eating Chemicals Credited in Change to Southern Jet Stream
March 25, 2020
International efforts to curb ozone-depleting chemicals have paused and potentially reversed shifting jet stream winds that affect storm patterns, ocean temperatures and Antarctic sea ice in the Southern Hemisphere, scientists found in a study released Wednesday.
https://www.courthousenews.com/global-ban-on-ozone-eating-chemicals-credited-in-change-to-southern-jet-stream/
___________________________
Spring Reveals Saturn’s Hexagon Jet Stream
2009

https://science.nasa.gov/resource/spring-reveals-saturns-hexagon-jet-stream/
___________________________
Scientists Strive to Explain the Strange Weather on Other Planets
Dec 18, 2024
What the swirling storms on alien worlds can tell us about the climate on Earth.
A somewhat alarming new phrase entered the American lexicon when parts of the United States were plunged into an especially bitter deep freeze in January 2014: “polar vortex.”
News reports cast the polar vortex as a previously unknown phenomenon that had suddenly descended upon the country. “What is the polar vortex and why is it doing this to us?” asked NPR, echoing the complaints of increasingly fed-up Americans.
Despite
the heightened public awareness, however, a polar vortex is nothing new
(and what most of us refer to as a polar vortex might not actually be
one). Scientists first identified a vortex—a mass of whirling air or
fluid—high above Earth’s North Pole in the early 1950s, and they later
discovered that vortices appear every winter over both the North and
South Pole.
https://airandspace.si.edu/air-and-space-quarterly/issue-13/solar-system-vortices
___________________________
The stratospheric polar vortex and sudden stratospheric warmings
21 October 2020
https://rmets.onlinelibrary.wiley.com/doi/10.1002/wea.3868
___________________________
Pineapple Express
https://en.wikipedia.org/wiki/Pineapple_Express
Pineapple Express is a specific recurring atmospheric river both in the waters immediately northeast of the Hawaiian Islands and extending northeast to any location along the Pacific coast of North America. It is a non-technical term and a meteorological
phenomenon. It is characterized by a strong and persistent large-scale
flow of warm moist air, and the associated heavy precipitation. A
Pineapple Express is an example of an atmospheric river, which is a more
general term for such relatively narrow corridors of enhanced water
vapor transport at mid-latitudes around the world.
A Pineapple Express is driven by a strong, southern branch of the polar jet stream and is marked by the presence of a surface frontal boundary which is typically either slow or stationary, with waves of low pressure traveling along its length. Each of these low-pressure systems brings enhanced rainfall.
The conditions are often created by the Madden–Julian oscillation, an equatorial rainfall pattern which feeds its moisture into this pattern. They are also present during an El Niño episode.
The combination of moisture-laden air, atmospheric dynamics, and orographic enhancement resulting from the passage of this air over the mountain ranges of the western coast of North America causes some of the most torrential rains to occur in the region. Pineapple Express systems typically generate heavy snowfall in the mountains and Interior Plateau, which often melts rapidly because of the warming effect of the system. After being drained of their moisture, the tropical air masses reach the inland prairies as a Chinook wind or simply "a Chinook", a term which is also synonymous in the Pacific Northwest with the Pineapple Express.[citation needed]
Extreme cases
Many Pineapple Express events follow or occur simultaneously with major arctic troughs in the northwestern United States, often leading to major snow-melt flooding with warm, tropical rains falling on frozen, snow laden ground.[1] Examples of this are the Christmas flood of 1964, Willamette Valley flood of 1996, New Year's Day Flood of 1997, January 2006 Flood in Northern California and Nevada, Great Coastal Gale of 2007, January 2008 Flood in Nevada, January 2009 Flood in Washington, the January 2012 Flood in Oregon, the 2019 Valentine's Day Flood in Southern California,[2] and the February 2020 floods in Oregon and Washington.[3]
West coast, 1862
Early in 1862, extreme storms riding the Pineapple Express[4][5] battered the west coast for 45 days. In addition to a sudden snow melt, some places received an estimated 8.5 feet (2,600 mm) of rain,[5] leading to the worst flooding in recorded history of California, Oregon, and Nevada, known as the Great Flood of 1862. Both the Sacramento and San Joaquin valleys flooded, and there was extensive flooding and mudslides throughout the region.[6]
Northern California, 1952
The San Francisco Bay Area is another locale along the Pacific Coast which is occasionally affected by a Pineapple Express. When it visits, the heavy, persistent rainfall typically causes flooding of local streams as well as urban flooding. In the decades before about 1980, the local term for a Pineapple Express was "Hawaiian Storm".[7] During the second week of January 1952, a series of "Hawaiian" storms swept into Northern California, causing widespread flooding around the Bay Area.
The same storms brought a blizzard of heavy, wet snow to the Sierra Nevada Mountains, notoriously stranding the train City of San Francisco on 13 January.
Northern California, 1955
The greatest flooding in Northern California since the 1800s occurred in 1955 as a result of a series of Hawaiian storms, with the greatest damage in the Sacramento Valley around Yuba City.[8]
Southern California, 2005
A Pineapple Express related storm battered Southern California from January 7–11, 2005. This storm was the largest to hit Southern California since the storms that hit during the 1997–98 El Niño event.[9] The storm caused mud slides and flooding, with one desert location just north of Morongo Valley receiving about 9 inches (230 mm) of rain, and some locations on south and southwest-facing mountain slopes receiving spectacular totals: San Marcos Pass, in Santa Barbara County, received 24.57 inches (624 mm), and Opids Camp (AKA Camp Hi-Hill) in the San Gabriel Mountains of Los Angeles County was deluged with 31.61 inches (803 mm) of rain in the five-day period.[10] In some areas the storm was followed by over a month of near-continuous rain.[citation needed]
Alaska, 2006
The unusually intense rainstorms that hit south-central Alaska in October 2006 were called "Pineapple Express" rains locally.[11]
Pacific Northwest, 2006
The Puget Sound region from Olympia, Washington to Vancouver, British Columbia received several inches of rain per day in November 2006 from a series of successive Pineapple Express related storms that caused massive flooding in all major regional rivers and mudslides which closed the mountain passes. These storms included heavy winds which are not usually associated with the phenomenon. Regional dams opened their spillways to 100% as they had reached capacity because of rain and snowmelt. Officials referred to the storm system as "the worst in a decade" on 8 November 2006. Portions of Oregon were also affected, including over 14 inches (360 mm) in one day at Lees Camp in the Coast Range, while the normally arid and sheltered Interior of British Columbia received heavy, coastal-magnitude rains.[citation needed]
Southern California, December 2010
In December 2010, a Pineapple Express system ravaged California from 15 to 22 December, bringing with it as much as 2 feet (610 mm) of rain to the San Gabriel Mountains, and over 13 feet (4.0 m) of snow in the Sierra Nevada. Although the entire state was affected, the Southern California counties of San Bernardino, Orange, Riverside, San Diego, and Los Angeles bore the brunt of the system of storms, as coastal and hillside areas were impacted by mudslides and major flooding.[12]
California, December 2014
In December 2014, a powerful winter storm enhanced by a Pineapple Express feature struck California, resulting in snow, wind, and flood watches.[13] A blizzard warning was issued by the National Weather Service for the Northern Sierra Nevada for the first time in California since October 2009 and January 2008.[14] The storm caused power outages for more than 50,000 people.[15] It was thought to be the most powerful storm to impact California since the January 2010 California winter storms.[16][17] A rare tornado touched down in Los Angeles on 12 December.[18]
West Coast, 2017
Historically strong storms associated with the Pineapple Express brought flooding and mudslides to California, particularly the San Francisco Bay Area, destroying homes and closing numerous roads, including State Route 17, State Route 35, State Route 37, Interstate 80, State Route 12, State Route 1, State Route 84, State Route 9 and State Route 152.[19][20]
The storm brought major snow to the Sierra Nevada and San Gabriel Mountains. A state record was recorded with places on the Sierra reaching up to 800 inches (20 m) of snow. The storm also brought not only significant flooding to the Los Angeles area and most of southern California (killing about 3 people), but also significant severe weather in that area.
California, January 2021
A powerful winter storm channeled a Pineapple Express into California from 26 to 29 January. One person was injured in one of the mudslides in Northern California, and many structures suffered damage.[21] The storm killed at least two people in California.[22][23] A significant length of California State Route 1 along the Big Sur collapsed into the ocean after massive amounts of rain were dumped, causing a debris flow onto the highway, which in turn triggered the collapse.[24] In Southern California, the storm triggered widespread flooding and debris flows, forcing the evacuations of thousands of people and also causing widespread property damage.[25] Salinas received 4 in (100 mm) of rainfall for the entire event causing mudflows that forced 7,000 people to evacuate. Across the State of California, the storm knocked out power to an estimated 575,000 people at one point, according to power outage tracking maps and PG&E.[26][25] In the mountainous parts of the state, the winter storm dropped tremendous amounts of heavy snow, with Mammoth Mountain Ski Area receiving 94 in (240 cm) within 72 hours, and a total of 107 in (270 cm) of snowfall for the entire event.[27] Blizzard conditions were also recorded on parts of the Sierra Nevada.[26] Very high wind gusts were also observed, with gusts over 100 mph (160 km/h) observed at Alpine Meadows, peaking at 126 mph (203 km/h).[28]
Pacific Northwest, 2021
Heavy rains attributed to a Pineapple Express event heavily impacted the Puget Sound region from Bellingham, Washington into the British Columbia Interior and the Lower Mainland from 14 to 15 November.[29] At the peak of the rainstorm on 15 November, Bellingham received 2.78 inches (71 mm) of rain while Hope, B.C. measured rainfall of 277.5 millimetres (10.93 in) from 14 to 15 November.[30] The resulting floods and ensuing mass wasting events forced the closure of all major Canadian road connections to Vancouver, British Columbia including Highway 1, the Coquihalla, and the Sea to Sky Highway.[31]
California, 2022–2023
Heavy rains attributed to a Pineapple Express caused widespread flooding in the Bay Area.[32]
California, February 2024
A Pineapple Express storm hit the state from 1 to 2 February 2024, before moving over the United States and settling over the I-25 corridor in Colorado, where heavy snow fell. Another one hit 3 February and last until 5 February, with the National Weather Service calling it "potentially life-threatening." Other news sources estimated that Los Angeles received six-months' worth of rain in the 48-hour period, while the Sierra Nevada mountains got 1 to 3 ft (30 to 91 cm) of snow, with over 4 feet (120 cm) of snow expected in higher elevations, such as Mammoth Lakes, CA. Parts of the San Bernardino Mountains' foothills received 10 to 12 in (250 to 300 mm) of rain.[33]
___________________________
What Is Arctic Amplification? Definition, Causes, and Environmental Implications
October 08, 2021
Arctic amplification is the increasingly ramped-up warming that’s taking place in the area of the world north of 67 degrees N latitude. For more than four decades, temperatures in the Arctic have risen at two to three times the pace of the rest of the world.12 High temperatures are melting snow covers and glaciers. Permafrost is thawing and collapsing. Sea ice is disappearing.
Dismayingly, some or all of these effects of heat trigger further temperature increases. Effect becomes cause, which becomes larger effect, which becomes stronger cause. Arctic amplification is an accelerating feedback loop that accelerates climate change throughout the rest of the world.
The Causes and Mechanisms of Arctic Amplification
While scientists are in general agreement that the Arctic has been warming more quickly than the rest of the world, there is still some debate about why. The almost universal best guess, however, is that greenhouse gases are to blame.
How Arctic Amplification Starts
Greenhouse gases like carbon dioxide (CO2) and methane (CH4) allow the sun’s warming rays in through the atmosphere. A warmed Earth radiates heat back toward space. However, CO2 allows only about half of the heat energy radiating skyward from Earth to escape the troposphere (Earth’s lowest atmospheric layer) into the stratosphere (the next layer up) and eventually out into space.3 According to the United States Environmental Protection Agency (EPA), CH4 is about 25 times as effective as CO2 in trapping heat.
Together with the sun’s rays, heat trapped by greenhouse gases further warms polar air and thaws significant areas of the Arctic. It decreases the amount of sea ice, which causes more warming. Which decreases even more sea ice. Which causes even more warming.
Sea-Ice Melt and Arctic Amplification
New research from a team of scientists from the State University of New York at Albany and the Chinese Academy of Sciences in Beijing suggests that the melting of sea ice is the single factor most responsible for the accelerating pace of Arctic warming.
According to the investigative team, the white color of sea ice helps the ice remain frozen. It does this by reflecting about 80% of the sun’s rays away from the ocean.
Lindsey, Rebecca, and Michon Scott. "Climate Change: Arctic Sea Ice." National Oceanic and Atmospheric Administration, 2021.
Thawing Permafrost Also Contributes to Arctic Amplification
Permafrost is frozen ground that is composed largely of decayed plants. It is full of carbon because, as part of the photosynthesis process, living plants continuously extract CO2 from the air.
Carbon
Scientists once thought that the carbon in permafrost binds tightly with iron and is therefore safely sequestered from the atmosphere.8 However, in a study published in the peer-reviewed journal Nature Communications, a team of international scientists demonstrates that iron doesn’t permanently trap CO2. This is because, as permafrost melts, bacteria frozen inside the soil activate. They use the iron as a food source. When they consume it, once-captive carbon is released. In a process called photomineralization, sunlight oxidizes the released carbon into CO2. (To paraphrase a Biblical phrase: “From CO2 the carbon came, and to CO2 it shall return.”)
Added into the atmosphere, CO2 helps the already-present CO2 melt snow, glaciers, permafrost, and even more sea ice.
The international team of scientists acknowledges that they do not yet know how much CO2 is released into the atmosphere as permafrost melts. Even so, they estimate the amount of carbon contained in permafrost to be two to five times the amount in the total load of CO2 emitted by human activities annually.
Methane
Meanwhile, CH4 is the second most common greenhouse gas. It, too, is frozen in permafrost. According to the EPA, CH4 is about 25 times more powerful than CO2 at trapping heat in Earth’s lower atmosphere.
Wildfires and Arctic Amplification
As temperatures rise and permafrost thaws and dries out, grasslands become tinderboxes. When they burn, the CO2 and CH4 in the vegetation combust. Airborne in smoke, they add to the atmosphere greenhouse gas load.
Nature reports that the Russian Wildfires Remote Monitoring System catalogued 18,591 separate Arctic wildfires in Russia in the summer of 2020; more than 35 million acres burned.10 The Economist reported that, in June, July, and August of 2019, 173 tons of carbon dioxide were dumped into the atmosphere by arctic wildfires.
The Current and Expected Climate Consequences Beyond the Arctic Circle of Arctic Amplification
With a new Arctic climate taking hold, higher temperatures and extreme weather events are radiating out into Earth’s middle latitudes.
The Jet Stream
As explained by the National Weather Service (NWS), jet streams are particularly fast-moving currents of air. They are like rivers of strong wind in the “tropopause,” which is the border between the troposphere and the stratosphere.
Like any wind, they are formed by differences in air temperatures. When rising equatorial air and sinking cold polar air move past each other they create the current. The greater the temperature differential, the faster the jet stream. Because of the direction in which Earth rotates, jet streams move from west to east, though the flow can also temporarily shift from north to south. It can temporarily slow down and even reverse itself, as well. Jet streams create and push weather.
Air temperature differences between the poles and equator are shrinking, which means that jet streams are weakening and meandering. This can cause unusual weather as well as extreme weather events. Weakening jet streams can also cause heat waves and cold snaps to linger in the same location for longer than usual.
The Polar Vortex
In the stratosphere at the Arctic circle, cold air currents swirl counterclockwise. Many studies show that warming temperatures disrupt that vortex.11 The disorder that creates further slows the jet stream. In winter, this can create heavy snows and extreme cold spells in middle latitudes.
What About the Antarctic?
According to NOAA, the Antarctic is not warming as quickly as the Arctic.13 Many reasons have been offered.14 One is that winds and weather patterns of the ocean surrounding it may serve a protective function.
The winds in the seas surrounding Antarctica are among the fastest in the world. According to the U. S. National Ocean Service, during the “Age of Sail” (the 15th to 19th centuries), sailors named the winds after the latitude lines near the southern tip of the world, and told tales of wild rides courtesy of the “roaring forties,” “furious fifties,” and “screaming sixties.”
These buffeting winds may divert warm-air jet streams from Antarctica. Even so, Antarctica is warming. NASA reports that, between 2002 and 2020, Antarctica lost an average of 149 billion metric tons of ice per year.
Some Environmental Implications of Arctic Amplification
Arctic amplification is expected to increase in the coming decades. NOAA notes that “the 12-month period of October 2019–September 2020 was the second-warmest year on record for surface air temperatures over land in the Arctic.” The extremities of that year’s temperatures were a continuation of “a seven-year-long streak of the warmest temperatures recorded since at least 1900.”
NASA also reports that, on September 15, 2020, the area within the Arctic circle covered by sea ice was only 1.44 million square miles, the smallest extent in the 40-year history of satellite record-keeping.
Meanwhile, a 2019 study led by John Mioduszewski of Rutgers University’s Arctic Hydroclimatology Research Lab and published in the peer-reviewed journal The Cyrosphere, suggests that, by the late 21st century, the Arctic will be nearly ice-free.
None of this bodes well for planet Earth.
https://www.treehugger.com/what-is-arctic-amplification-5203873
___________________________
Intensified warming of the Arctic: Causes and impacts on middle latitudes
2014
https://www.sciencedirect.com/science/article/abs/pii/S0921818114000575
___________________________
Global warming leading to alarming recession of the Arctic sea-ice cover: Insights from remote sensing observations and model reanalysis
July 2020
https://www.researchgate.net/publication/343318035_Global_warming_leading_to_alarming_recession_of_the_Arctic_sea-ice_cover_Insights_from_remote_sensing_observations_and_model_reanalysis
___________________________
Arctic Stratosphere Dynamical Response to Global Warming
01 Sep 2017
https://journals.ametsoc.org/view/journals/clim/30/17/jcli-d-16-0781.1.xml
___________________________
Saturn's Mysterious Hexagon Behaves Like Earth's Ozone Hole
December 5, 2013
https://www.universetoday.com/106959/saturns-mysterious-hexagon-behaves-like-earths-ozone-hole/
___________________________
Inventory and distribution of tritium in the oceans in 2016
https://www.sciencedirect.com/science/article/abs/pii/S0048969718348034
___________________________
Electrolytic enrichment method for tritium determination in the Arctic Ocean using liquid scintillation counter
12 October 2020
https://link.springer.com/article/10.1007/s13131-020-1647-4
___________________________
Tritium and plutonium in waters from the Bering and Chukchi Seas
1999
https://pubs.er.usgs.gov/publication/70185682
___________________________
Thorium and Uranium Isotopes in Arctic Sediments
1989
https://link.springer.com/chapter/10.1007/978-1-4613-0677-1_22
___________________________
Thorium is not an environmentally safe alternative type of nuclear energy, Norwegian report says
October 19, 2008
https://bellona.org/news/nuclear-issues/2008-10-thorium-is-not-an-environmentally-safe-alternative-type-of-nuclear-energy-norwegian-report-says
___________________________
Scavenging of thorium isotopes in the Canada Basin of the Arctic Ocean
June 2004
https://www.researchgate.net/publication/222689675_Scavenging_of_thorium_isotopes_in_the_Canada_Basin_of_the_Arctic_Ocean
___________________________
Scavenging of thorium isotopes in the Arctic regions: implications for the fate of particle-reactive pollutants
2001
Abstract
The sources of inorganic pollutants to the Arctic areas are reviewed using previously published results. The removal of particle-reactive pollutants is discussed using thorium scavenging as an analog. The scavenging of 234Th from the upper water column (approximately 100 m) and sediment inventory of 230Th from the deep Arctic waters is compared to different ocean basins in the subarctic areas. Such a comparison shows that 234Th is in equilibrium with its parent, 238U, in certain regions of the Canada Basin of the Arctic Ocean, while it is deficient in other regions of the arctic as well as in sub-polar ocean basins. This implies that the particle-reactive pollutants in the deep Arctic of the Canada Basin are less likely to be removed from the deep waters and will eventually be transported out of this area. We have utilized the 230Th inventory in sediments from the Arctic area to determine the removal rates of particle-reactive nuclides. The 230Th inventory in the deep Arctic Ocean of the Canada Basin is much lower than the Norwegian Sea and the Fram Strait of the Arctic as well as all other sub-polar world oceans. These observations suggest that any pollutants into the deep Arctic areas of the Canada Basin are less likely to be removed locally and may be transported out of this area. In those areas, the colloidal material could potentially play a major role in the removal of particle-reactive contaminants.
https://pubmed.ncbi.nlm.nih.gov/11382979/
___________________________
Tritium Tracer in Arctic Problems
1959
https://pubmed.ncbi.nlm.nih.gov/17830836/
___________________________
Permafrost thaw and implications for the fate and transport of tritium in the Canadian north
2018 Jul 14
Abstract
Layers of permafrost developed during the 1950s and 1960s incorporated tritium from the atmosphere that originated from global nuclear weapons testing. In regions underlain by substantial permafrost, this tritium has been effectively trapped in ice since it was deposited and subject to radioactive decay alone, which has substantially lengthened its environmental half-life compared to areas with little or no permafrost where the weapons-test era precipitation has been subject to both decay and hydrodynamic dispersion. The Arctic is warming three times faster than other parts of the world, with northern regions incurring some of the most pronounced effects of climate change, resulting in permafrost degradation. A series of 23 waterbodies across the Canadian sub-Arctic spanning the continuous, discontinuous and isolated patches permafrost zones in northern Manitoba, Northwest Territories and Labrador were sampled. Surface water and groundwater seepage samples were collected from each lake and analyzed for tritium, stable isotopes (δ18O and δ2H) and general water chemistry characteristics. Measured tritium was significantly higher in surface waters (SW) and groundwater seepage (GW) in water bodies located in the sporadic discontinuous (64 ± 15 T U. in SW and 52 ± 9 T U. in GW) and extensive discontinuous (53 ± 7 T U. in SW and 61 ± 7 T U. in GW) permafrost regions of the Northwest Territories than in regions underlain by continuous permafrost in northern Manitoba (<12 T U. in both SW and GW) or those within isolated patches of permafrost in Labrador (16 ± 2 T U. in SW and 21 ± 4 T U. in GW). The greatest tritium enrichment (up to 128 T U.) was observed in lakes near Jean Marie River in the Mackenzie River valley, a region known to be experiencing extensive permafrost degradation. These results demonstrate significant permafrost degradation in the central Mackenzie River basin and show that tritium is becoming increasingly mobile in the sub-Arctic environment-at concentrations higher than expected-as a result of a warming climate. A better understanding of the cycling of tritium in the environment will improve our understanding of Arctic radioecology under changing environmental conditions.
https://pubmed.ncbi.nlm.nih.gov/30015315/
___________________________
Past and recent tritium levels in Arctic and Antarctic polar caps
May 2006
Abstract
___________________________
Tree Taxa Affirm A Much Warmer Alpine Climate Than Today For Nearly All Of The Last 10,000 Years
2023
“Chironomid‐based temperature reconstructions in the central eastern Alps showed…between ca. 10 000 and 8600 cal a BP…a thermal maximum of up to 4.5°C higher temperatures than present” – Caf et al., 2023
With the exception of a century or two during the Little Ice Age (~1500-1900 CE), the European Alps have had a much higher concentration of beech (Fagus) and spruce (Picea) forest presence than today for nearly all of the last 10,000 years (Caf et al., 2023).
The much more heavily vegetated and forested area – which coincides with a warmer climate – can be clearly observed in the reconstructions of Holocene tree and shrub presence.
In the images below, notice how much greater the Alpine forest coverage was during the Medieval Warm Period (~600 to 1000 CE) and the 8 to 10 millennia preceding it.
Even during the last 400-500 years, encompassing the Little Ice Age, there were as-warm or warmer periods than today.
So, once again, we have another study affirming the modern climate is not only not unusually warm, but actually we are currently living in one the coldest climatic periods since the end of the last glacial.
___________________________
Primates colonised the Arctic during a period of ancient global warming—their fate offers a lesson
January 30, 2023
https://phys.org/news/2023-01-primates-colonised-arctic-period-ancient.html
___________________________
Arctic oscillation excitation by torsional oscillations
February 2009
https://www.researchgate.net/publication/226055748_Arctic_oscillation_excitation_by_torsional_oscillations
___________________________
Arctic oscillation
https://en.wikipedia.org/wiki/Arctic_oscillation
___________________________
How is the polar vortex related to the Arctic Oscillation?
___________________________
Climate Variability: Arctic Oscillation
___________________________
Physiological Ecology of Mesozoic Polar Forests in a High CO2 Environment
2001
https://www.ncbi.nlm.nih.gov/pmc/articles/PMC4233824/
___________________________
Greenland Has Yet Another Methane Leak
January 3, 2019
https://www.scientificamerican.com/article/greenland-has-yet-another-methane-leak/
___________________________
Biomarker insights into a methane-enriched Holocene peat-setting from “Doggerland” (central North Sea)
July 1, 2022
https://journals.sagepub.com/doi/full/10.1177/09596836221106958
___________________________
Arctic methane levels reach new heights
September 16, 2019
https://eandt.theiet.org/content/articles/2019/09/arctic-methane-levels-reach-new-heights-data-shows/
___________________________
The isotopic composition of methane in Polar ice cores
1988
https://ntrs.nasa.gov/citations/19890034403
___________________________
Methane cycling within sea ice: results from drifting ice during late spring, north of Svalbard
2021
https://tc.copernicus.org/articles/15/2701/2021/
___________________________
Ancient plant wax reveals how global warming affects methane in Arctic lakes
September 29, 2023
https://phys.org/news/2023-09-ancient-wax-reveals-global-affects.html
___________________________
Methane-eating microorganisms help regulate emissions from wetlands
June 30, 2015
Without this process, methane emissions from freshwater wetlands could be 30 to 50 percent higher
https://beta.nsf.gov/news/methane-eating-microorganisms-help-regulate-emissions-wetlands
___________________________
Reduced methane emissions in former permafrost soils driven by vegetation and microbial changes following drainage
14 March 2022
https://onlinelibrary.wiley.com/doi/10.1111/gcb.16137
___________________________
Coexisting methane and oxygen excesses in nitrate-limited polar water (Fram Strait) during ongoing sea ice melting
2011
https://bg.copernicus.org/preprints/8/5179/2011/bgd-8-5179-2011.pdf
___________________________
Perhaps World’s Largest Methane Leak Traced to Russian Coal Mine
June 18, 2022
https://www.ecowatch.com/methane-leak-russia-coal-mine.html
___________________________
Global methane emissions soar to record high
July 14, 2020
https://earth.stanford.edu/news/global-methane-emissions-soar-record-high#gs.5jloes
___________________________
Methane clathrate
https://en.wikipedia.org/wiki/Methane_clathrate
___________________________
Widespread soil bacterium that oxidizes atmospheric methane
April 8, 2019
https://www.pnas.org/doi/10.1073/pnas.1817812116
___________________________
Atmospheric methane
https://en.wikipedia.org/wiki/Atmospheric_methane
___________________________
Is the destruction or removal of atmospheric methane a worthwhile option?
December 6, 2021
https://www.ncbi.nlm.nih.gov/pmc/articles/PMC8646139/
___________________________
Methane transport from the active layer to lakes in the Arctic using Toolik Lake, Alaska, as a case study
March 9, 2015
https://www.pnas.org/doi/10.1073/pnas.1417392112
___________________________
NASA Has Detected Millions of Methane Hotspots Littering The Arctic
17 February 2020
https://www.sciencealert.com/nasa-flights-uncover-millions-of-methane-hotspots-hiding-in-clumps-in-the-arctic
___________________________
Toward a statistical description of methane emissions from arctic wetlands
2017 Jan 23
https://www.ncbi.nlm.nih.gov/pmc/articles/PMC5258667/
___________________________
What Are The Differences Between Geographic Poles And Magnetic Poles Of The Earth?
https://www.worldatlas.com/articles/what-are-the-differences-between-geographic-poles-and-magnetic-poles-of-the-earth.html
___________________________
Magnetic north is shifting fast. What’ll happen to the northern lights?
May 22, 2019
https://earthsky.org/earth/magnetic-north-pole-shift-northern-lights/
___________________________
Organochlorines and possible biochemical effects in glaucous gulls (Larus hyperboreus) from Bjørnøya, the Barents Sea
2000
https://pubmed.ncbi.nlm.nih.gov/10629287/
___________________________
Chlorinated
pesticide concentrations, with an emphasis on polychlorinated camphenes
(toxaphenes), in relation to cytochrome P450 enzyme activities in harp
seals ( Phoca groenlandica ) from the Barents Sea
1999
https://www.deepdyve.com/lp/wiley/chlorinated-pesticide-concentrations-with-an-emphasis-on-TW166bwi0K
___________________________
Arctic cooperation and politics
https://en.wikipedia.org/wiki/Arctic_cooperation_and_politics
Arctic
cooperation and politics are partially coordinated via the Arctic
Council, composed of the eight Arctic nations: the United States,
Canada, Iceland, Norway, Sweden, Finland, Russia, and Denmark with
Greenland and the Faroe Islands.[1] The dominant governmental power in
Arctic policy resides within the executive offices, legislative bodies,
and implementing agencies of the eight Arctic nations, and to a lesser
extent other nations, such as United Kingdom, Germany, European Union
and China. NGOs and academia play a large part in Arctic policy. Also
important are intergovernmental bodies such as the United Nations
(especially as relates to the Law of the Sea Treaty) and NATO.
___________________________
ASSESSMENT OF BARENTS SEA FLOATING MARINE MACRO LITTER POLLUTION DURING THE VESSEL SURVEY IN 2019
March 2021
https://www.researchgate.net/publication/349847090_ASSESSMENT_OF_BARENTS_SEA_FLOATING_MARINE_MACRO_LITTER_POLLUTION_DURING_THE_VESSEL_SURVEY_IN_2019
___________________________
Organotin
compounds (OTs) in surface sediments, bivalves and algae from the
Russian coast of the Barents Sea (Kola Peninsula) and the Fram Strait
(Svalbard Archipelago)
18 January 2022
https://link.springer.com/article/10.1007/s11356-021-18091-0
___________________________
Nitrate assimilation and regeneration in the Barents Sea: insights from nitrate isotopes
2021
https://bg.copernicus.org/articles/18/637/2021/bg-18-637-2021-discussion.html
___________________________
Nitrogen cycling in the Barents Sea-Seasonal dynamics of new and regenerated production in the marginal ice zone
1994
https://aslopubs.onlinelibrary.wiley.com/doi/pdfdirect/10.4319/lo.1994.39.7.1630
___________________________
A large methane plume east of Bear Island (Barents Sea): implications for the marine methane cycle
February 1995
https://link.springer.com/article/10.1007/BF00192242
___________________________
Methane cycle in the Barents Sea
September 2008
https://www.researchgate.net/publication/225457784_Methane_cycle_in_the_Barents_Sea
___________________________
New study reveals cracks beneath giant, methane gushing craters
June 4, 2020
https://www.sciencedaily.com/releases/2020/06/200604111619.htm
___________________________
Craters in the Barents Sea Point to Explosive End to the Last Ice Age
June 6, 2017
https://www.21stcentech.com/craters-barents-sea-point-explosive-ice-age/
___________________________
Methane exploded from Arctic sea-floor as Ice Age ended
01 June 2017
https://www.nature.com/articles/nature.2017.22095
___________________________
Huge Underwater Eruptions Blasted Craters into Arctic Seafloor
June 01, 2017
https://www.livescience.com/59334-exploding-gases-made-giant-craters-arctic-seafloor.html
___________________________
Massive frozen methane domes at the bottom of Arctic sea could soon explode
06/06/17
https://www.ibtimes.co.uk/massive-frozen-methane-domes-bottom-arctic-sea-could-soon-explode-1625027
___________________________
Sulfate reduction and anaerobic oxidation of methane in sediments of the South-Western Barents Sea
2021
https://bg.copernicus.org/preprints/bg-2021-58/bg-2021-58.pdf
___________________________
Massive blow-out craters formed by hydrate-controlled methane expulsion from the Arctic seafloor
2 Jun 2017
https://www.science.org/doi/10.1126/science.aal4500
___________________________
Phosphorus dynamics in the Barents Sea
23 September 2020
https://aslopubs.onlinelibrary.wiley.com/doi/10.1002/lno.11602
___________________________
Microbial Communities Involved in Methane, Sulfur, and Nitrogen Cycling in the Sediments of the Barents Sea
2021
https://pubmed.ncbi.nlm.nih.gov/34835487/
___________________________
New Arctic life on barren seabed thrives on methane jets
20 April 2016
https://www.newscientist.com/article/2085232-new-arctic-life-on-barren-seabed-thrives-on-methane-jets/
___________________________
Mercury in Barents Sea fish in the Arctic polar night: Species and spatial comparison
2021
https://www.sciencedirect.com/science/article/pii/S0025326X2100535X
___________________________
Persistent organic pollutants and mercury in dead and dying glaucous gulls (Larus hyperboreus) at Bjørnøya (Svalbard)
https://citeseerx.ist.psu.edu/viewdoc/summary?doi=10.1.1.511.4813
___________________________
Nitrate assimilation and regeneration in the Barents Sea: insights from nitrogen isotopes
October 2020
https://www.researchgate.net/publication/344561636_Nitrate_assimilation_and_regeneration_in_the_Barents_Sea_insights_from_nitrogen_isotopes
___________________________
Spatial Patterns of Carbon and Nitrogen in Soils of the Barents Sea Coastal Area (Khaypudyrskaya Bay)
10 June 2019
https://link.springer.com/article/10.1134/S1064229319030098
___________________________
Areas vulnerable to acute oil pollution in the Norwegian Barents Sea
2005
http://awsassets.panda.org/downloads/dnvreport2005vulnerableareas.pdf
___________________________
What is Barents Sea Warming and Atlantification?
June 20, 2022
One
of the most emotional impacts of an unnatural weather change is found
in the Arctic area. Lately, the ice in the Arctic Sea has been
liquefying quickly. In 2007, an enormous piece of the Arctic Sea became
without ice in the summer for the first time in living history. It
resulted in Barents Sea warming and Atlantification.
https://www.thewonderowl.com/barents-sea-warming-atlantification-2022-upsc/
___________________________
Cryosphere-controlled methane release throughout the last glacial cycle
2018
https://munin.uit.no/bitstream/handle/10037/15559/thesis.pdf
___________________________
Diversity and Abundance of Aerobic and Anaerobic Methane Oxidizers at the Haakon Mosby Mud Volcano, Barents Sea
16 March 2007
https://www.semanticscholar.org/paper/Diversity-and-Abundance-of-Aerobic-and-Anaerobic-at-L%C3%B6sekann-Knittel/9a9488afb084c4f8f3e49078260eed54b8a09cdf
___________________________
Concentrations
of trace elements and iron in the Arctic soils of Belyi Island (the
Kara Sea, Russia): patterns of variation across landscapes
2017 Apr 8
https://pubmed.ncbi.nlm.nih.gov/28389848/
___________________________
Kara Sea
https://en.wikipedia.org/wiki/Kara_Sea
There
is concern about radioactive contamination from nuclear waste the
former Soviet Union dumped in the sea and the effect this will have on
the marine environment. According to an official "White Paper" report
compiled and released by the Russian government in March 1993, the
Soviet Union dumped six nuclear submarine reactors and ten nuclear
reactors into the Kara Sea between 1965–1988.[14] Solid high- and
low-level wastes unloaded from Northern Fleet nuclear submarines during
reactor refuelings were dumped in the Kara Sea, mainly in the shallow
fjords of Novaya Zemlya, where the depths of the dumping sites range
from 12 to 135 meters, and in the Novaya Zemlya Trough at depths of up
to 380 meters. Liquid low-level wastes were released in the open Barents
and Kara Seas. A subsequent appraisal by the International Atomic
Energy Agency showed that releases are low and localized from the 16
naval reactors (reported by the IAEA as having come from seven
submarines and the icebreaker Lenin) which were dumped at five sites in
the Kara Sea. Most of the dumped reactors had suffered an accident.
The
Soviet submarine K-27 was scuttled in Stepovogo Bay with its two
reactors filled with spent nuclear fuel.[16] At a seminar in February
2012 it was revealed that the reactors on board the submarine could
re-achieve criticality and explode (a buildup of heat leading to a steam
explosion vs. nuclear). The catalogue of waste dumped at sea by the
Soviets, according to documents seen by Bellona, includes some 17,000
containers of radioactive waste, 19 ships containing radioactive waste,
14 nuclear reactors, including five that still contain spent nuclear
fuel; 735 other pieces of radioactively contaminated heavy machinery,
and the K-27 nuclear submarine with its two reactors loaded with nuclear
fuel.
___________________________
Light-absorption
enhancement of black carbon in the Asian outflow inferred from airborne
SP2 and in-situ measurements during KORUS-AQ
2021 Jun 15
https://koreauniv.pure.elsevier.com/en/publications/light-absorption-enhancement-of-black-carbon-in-the-asian-outflow
___________________________
Observations on plutonium in the oceans
1995
https://www.sciencedirect.com/science/article/abs/pii/0969804395001638
___________________________
Arctic Ocean was once a tub of fresh water covered with a half-mile of ice
February 03, 2021
At at least two points in history, the Arctic was cut off from other oceans.
https://www.livescience.com/arctic-ocean-freshwater.html
___________________________
The Arctic Ocean was covered by a shelf ice and filled with freshwater
February 3, 2021
https://phys.org/news/2021-02-arctic-ocean-shelf-ice-freshwater.html
___________________________
Scavenging of Thorium Isotopes in the Arctic Regions: Implications for the Fate of Particle-reactive Pollutants
2001
https://www.sciencedirect.com/science/article/abs/pii/S0025326X00001946
___________________________
Anthropogenic Radionuclides in the Arctic Ocean Distribution and Pathways
1998
https://www.osti.gov/etdeweb/servlets/purl/629697
___________________________
Links
Between Barents‐Kara Sea Ice and the Extratropical Atmospheric
Circulation Explained by Internal Variability and Tropical Forcing
2019
https://agupubs.onlinelibrary.wiley.com/doi/epdf/10.1029/2019GL085679
___________________________
Revision of data on the activity of wastes dumped in the arctic seas
1999
https://www.deepdyve.com/lp/springer-journals/revision-of-data-on-the-activity-of-wastes-dumped-in-the-arctic-seas-H2OPgTe9eI
___________________________
‘It will take 10 years to remove all the rusty barrels…’
November 14, 2024
As activists hold a massive clean-up in the Russian Arctic, environmental experts warn that the barrels are just a way of masking more pressing environmental problems.
https://www.arctictoday.com/it-will-take-10-years-to-remove-all-the-rusty-barrels-2/
___________________________
Ships traveling into a warming Arctic are leaving garbage in their wake, scientists warn
December 14, 2021
https://www.arctictoday.com/ships-traveling-into-a-warming-arctic-are-leaving-garbage-in-their-wake-scientists-warn/
___________________________
Arctic Council eyes action plan to reduce Arctic marine litter, microplastics
August 30, 2018
https://www.arctictoday.com/arctic-council-eyes-action-plan-reduce-arctic-marine-litter-microplastics/
___________________________
Papers in the Earth and Atmospheric Sciences
1994
https://digitalcommons.unl.edu/geosciencefacpub/180/
___________________________
228Ra and 226Ra in the Kara and Laptev seas
2003
https://www.sciencedirect.com/science/article/abs/pii/S0278434302001693
___________________________
Recent changes in winter Arctic clouds and their relationships with sea ice and atmospheric conditions
2016
https://a.tellusjournals.se/articles/10.3402/tellusa.v68.29130/
___________________________
The distribution of radiocesium and plutonium in sea ice-entrained arctic sediments in relation to potential sources and sinks
1998
https://www.sciencedirect.com/science/article/abs/pii/S0265931X97000581
___________________________
Murmansk Hosts Discussion on Raising Submerged and Dangerous Objects in the Seas of the Arctic Ocean
04-08-2022
https://www.devdiscourse.com/article/headlines/2133032-murmansk-hosts-discussion-on-raising-submerged-and-dangerous-objects-in-the-seas-of-the-arctic-ocean
___________________________
Remote identification of radioactive contamination by satellite measurements
2003
https://www.sciencedirect.com/science/article/abs/pii/S0273117703004769
___________________________
Transport
and transformation of riverine neodymium isotope and rare earth element
signatures in high latitude estuaries: A case study from the Laptev Sea
2017
Highlights
First comprehensive seawater Nd isotope and REE data for the Laptev Sea.
•
Dissolved Nd isotopes, salinity and stable oxygen isotopes trace water masses.
•
No evidence for REE release from particles of the organic-rich Siberian Rivers.
•
Preferential estuarine LREE removal follows increasing salinity from 10 to 34.
•
Formation and melting of sea ice redistribute REEs within water column.
https://www.sciencedirect.com/science/article/abs/pii/S0012821X17304491
___________________________
Seawater-Particle Interactions of Rare Earth Elements and Neodymium Isotopes in the Deep Central Arctic Ocean
15 July 2021
Abstract
In the central Arctic Ocean, dissolved rare earth element concentrations ([dREE]) and the neodymium (Nd) isotope compositions are constant throughout the deep water column (>1,000 m water depth), indicating unique conditions among the ocean basins and therefore requiring an investigation of seawater-particle interactions. Here, we present the first high-resolution particulate REE and Nd isotope data from the Arctic Ocean and discuss the possible seawater-particle processes affecting the Arctic Ocean. Our results show that particulate [REE] are on the same order of magnitude as in other ocean basins, suggesting that particle composition is the main cause for a lack of pREE release to the dissolved pool. The lithogenic fraction dominates throughout the water column while the biogenic material contribution is very small. This paucity of biogenic material results in reduced particle-seawater exchanges of REEs and Nd isotopes. Moreover, we note only slight differences in the dissolved Nd isotope composition between the Eurasian and Canadian Basins. This is due to the different source regions supplying different dissolved and particulate Nd isotope signatures to both basins. The dissolved [REE] and Nd isotope composition of Atlantic waters are modified during their flow paths through contributions from the Kara Sea, lowering the salinity and increasing [dREE] and dNd isotope compositions. Hydrothermal influence from the Gakkel Ridge on dissolved and particulate [REE] and Nd isotopes could not be detected.
https://agupubs.onlinelibrary.wiley.com/doi/10.1029/2021JC017423
___________________________
German scientists warn of changes in Arctic Ocean circulation
19/02/2008
https://www.expatica.com/de/general/german-scientists-warn-of-changes-in-arctic-ocean-circulation-96047/
___________________________
Influence of brine formation on Arctic Ocean circulation over the past 15 million years
02 December 2007
Abstract
The early oceanographic history of the Arctic Ocean is important in regulating, and responding to, climatic changes. However, constraints on its oceanographic history preceding the Quaternary (the past 1.8 Myr) have become available only recently, because of the difficulties associated with obtaining continuous sediment records in such a hostile setting. Here, we use the neodymium isotope compositions of two sediment cores recovered near the North Pole to reconstruct over the past ∼15 Myr the sources contributing to Arctic Intermediate Water, a water mass found today at depths of 200 to 1,500 m. We interpret high neodymium ratios for the period between 15 and 2 Myr ago, and for the glacial periods thereafter, as indicative of weathering input from the Siberian Putoranan basalts into the Arctic Ocean. Arctic Intermediate Water was then derived from brine formation in the Eurasian shelf regions, with only a limited contribution of intermediate water from the North Atlantic. In contrast, the modern circulation pattern, with relatively high contributions of North Atlantic Intermediate Water and negligible input from brine formation, exhibits low neodymium isotope ratios and is typical for the interglacial periods of the past 2 Myr. We suggest that changes in climatic conditions and the tectonic setting were responsible for switches between these two modes.
https://www.nature.com/articles/ngeo.2007.5
___________________________
Variations
of North Atlantic inflow to the central Arctic Ocean over the last 14
million years inferred from hafnium and neodymium isotopes
2012
https://www.sciencedirect.com/science/article/abs/pii/S0012821X12004396
___________________________
Coastal environments of the western Kara and eastern Barents Seas
1995
https://www.sciencedirect.com/science/article/pii/096706459500047X
___________________________
History of heavy metal accumulation in the Svalbard area: Distribution, origin and transport pathways
2017 Aug 19
https://pubmed.ncbi.nlm.nih.gov/28830017/
___________________________
Holocene hydrographical changes of the eastern Laptev Sea (Siberian Arctic) recorded in δ18O profiles of bivalve shells
20 January 2017
Abstract
Oxygen isotope profiles along the growth axis of fossil bivalve shells of Macoma calcarea
were established to reconstruct hydrographical changes in the eastern
Laptev Sea since 8400 cal yr B.P. The variability of the oxygen isotopes
(δ18O) in the individual records is mainly
attributed to variations in the salinity of bottom waters in the Laptev
Sea with a modern ratio of 0.50‰/salinity. The high-resolution δ18O
profiles exhibit distinct and annual cycles from which the seasonal and
annual salinity variations at the investigated site can be
reconstructed. Based on the modern analogue approach oxygen isotope
profiles of radiocarbon-dated bivalve shells from a sediment core
located northeast of the Lena Delta provide seasonal and subdecadal
insights into past hydrological conditions and their relation to the
Holocene transgressional history of the Laptev Sea shelf. Under the
assumption that the modern relationship between δ18Ow and salinity has been constant throughout the time, the δ18O
of an 8400-cal-yr-old bivalves would suggest that bottom-water salinity
was reduced and the temperature was slightly warmer, both suggesting a
stronger mixture of riverine water to the bottom water. Reconstruction
of the inundation history of the Laptev Sea shelf indicates local sea
level ∼27 m below present at this time and a closer proximity of the
site to the coastline and the Lena River mouth. Due to continuing sea
level rise and a southward retreat of the river mouth, bottom-water
salinity increased at 7200 cal yr B.P. along with an increase in
seasonal variability. Conditions comparable to the modern hydrography
were achieved by 3800 cal yr B.P.
https://www.cambridge.org/core/journals/quaternary-research/article/abs/holocene-hydrographical-changes-of-the-eastern-laptev-sea-siberian-arctic-recorded-in-18o-profiles-of-bivalve-shells/49C615FA036B1468382E5E2539979742
___________________________
Heavy metal accumulation in zooplankton and impact of water quality on its community structure
07 January 2022
https://link.springer.com/article/10.1007/s12517-021-09424-x
___________________________
Transport of plutonium in surface and sub-surface waters from the Arctic shelf to the North Pole via the Lomonosov Ridge
2002
https://lup.lub.lu.se/search/publication/eff7d72c-b775-4473-be68-d233e443ac76
___________________________
Stable
oxygen and carbon isotopes in modern benthic foraminifera from the
Laptev Sea shelf: implications for reconstructing proglacial and
profluvial environments in the Arctic
2004
https://www.sciencedirect.com/science/article/abs/pii/S0377839804000039
___________________________
Transport
and transformation of riverine neodymium isotope and rare earth element
signatures in high latitude estuaries: A case study from the Laptev Sea
November 2017
https://www.researchgate.net/publication/319441315_Transport_and_transformation_of_riverine_neodymium_isotope_and_rare_earth_element_signatures_in_high_latitude_estuaries_A_case_study_from_the_Laptev_Sea
___________________________
Determination of 137Cs and 90Sr in the bottom sediments from the Barents Sea
04 July 2010
https://link.springer.com/article/10.1007/s10967-010-0657-7
___________________________
The impact of black carbon emissions from projected Arctic shipping on regional ice transport
18 May 2021
https://link.springer.com/article/10.1007/s00382-021-05814-9
___________________________
Thawing Arctic hillsides are major climate change contributors
August 12, 2022
https://www.sciencedaily.com/releases/2022/08/220812224205.htm
___________________________
The impact of climate variations on fluxes of oxygen in the Barents Sea
May 2002
https://www.researchgate.net/publication/248520507_The_impact_of_climate_variations_on_fluxes_of_oxygen_in_the_Barents_Sea
___________________________
Clumped isotope constraints on the origins of reservoir methane from the Barents Sea
04 Apr 2022
https://www.earthdoc.org/content/journals/10.1144/petgeo2021-037
___________________________
Press release: Mercury pollution risk and copper mine waste pollution danger in the Barents Sea
15. February 2019
https://www.nmf.no/2019/02/15/press-release-mercury-pollution-risk-and-copper-mine-waste-pollution-danger-in-the-barents-sea/
___________________________
Impact of shipping emissions on air pollution and pollutant deposition over the Barents Sea
January 2022
https://www.researchgate.net/publication/357818847_Impact_of_shipping_emissions_on_air_pollution_and_pollutant_deposition_over_the_Barents_Sea
___________________________
Climate-driven benthic invertebrate activity and biogeochemical functioning across the Barents Sea polar front
31 August 2020
https://royalsocietypublishing.org/doi/10.1098/rsta.2019.0365
___________________________
History of heavy metal accumulation in the Svalbard area: Distribution, origin and transport pathways
2017 Aug 19
https://pubmed.ncbi.nlm.nih.gov/28830017/
___________________________
Food webs and carbon flux in the Barents Sea
2006
https://www.sciencedirect.com/science/article/abs/pii/S0079661106001315
___________________________
Heavy metals of inshore benthic invertebrates from the Barents Sea
2002
https://pubmed.ncbi.nlm.nih.gov/12699921/
___________________________
Sediment
composition and heavy metal distribution in Barents Sea surface
samples: results from Institute of Marine Research 2003 and 2004
2008
https://www.ngu.no/en/publikasjon/sediment-composition-and-heavy-metal-distribution-barents-sea-surface-samples-results
___________________________
Atmospheric forcing dominates winter Barents-Kara sea ice variability on interannual to decadal time scales
August 29, 2022
https://www.pnas.org/doi/10.1073/pnas.2120770119
___________________________
Arctic mercury levels drop during the depths of the winter
August 18, 2022
https://phys.org/news/2022-08-arctic-mercury-depths-winter.html
___________________________
Ocean Heat Transport Into the Barents Sea: Distinct Controls on the Upward Trend and Interannual Variability
06 September 2019
https://agupubs.onlinelibrary.wiley.com/doi/10.1029/2019GL083837
___________________________
List of oil and gas fields of the Barents Sea
https://en.wikipedia.org/wiki/List_of_oil_and_gas_fields_of_the_Barents_Sea
___________________________
Endocrine-Disrupting Chemicals and Climate Change: A Worst-Case Combination for Arctic Marine Mammals and Seabirds?
2006
https://ehp.niehs.nih.gov/doi/full/10.1289/ehp.8057
___________________________
Puffin Hunting In Iceland Gives A Unique Insight Into Climate Effects
June 2021
https://www.jonaa.org/content/puffin-hunting-in-iceland-gives-a-unique-insight-into-climate-effects
___________________________
Biomagnification of organochlorines along a Barents Sea food chain
2001
https://www.sciencedirect.com/science/article/abs/pii/S0269749100001718
___________________________
First detection of microplastics in deep marine sediments from the Kveithola Trough, Barents Sea
May 2021
https://www.researchgate.net/publication/362015733_First_detection_of_microplastics_in_deep_marine_sediments_from_the_Kveithola_Trough_Barents_Sea
___________________________
Plutonium in the arctic marine environment--a short review
2004
https://pubmed.ncbi.nlm.nih.gov/15258672/
___________________________
Monitoring the environmental contamination of Kara Sea and shallow bays of Novaya Zemlya
07 January 2017
https://link.springer.com/article/10.1007/s10967-016-5163-0
___________________________
Glacial
freshwater discharge events recorded by authigenic neodymium isotopes
in sediments from the Mendeleev Ridge, western Arctic Ocean
2013
https://www.sciencedirect.com/science/article/abs/pii/S0012821X13001398
___________________________
Arctic sea ice algae need less light to grow than researchers thought. Here’s why that matters
February 13, 2018
https://www.arctictoday.com/arctic-sea-ice-algae-need-less-light-grow-researchers-thought-heres-matters/
___________________________
Researchers are finding more signs of dangerous toxins from algae in Alaska wildlife
April 21, 2021
The poisons pose a threat to Alaska's marine ecosystems and the humans who depend on them.
https://www.arctictoday.com/researchers-are-find-more-signs-of-dangerous-toxins-from-algae-in-alaska-wildlife/
___________________________
Rising CO2 levels in the ocean could benefit toxic algae, study says
19.11.2018
https://www.carbonbrief.org/rising-co2-levels-ocean-could-benefit-toxic-algae/
___________________________
Microscopic plants called algae grow inside the top layer of sea ice
https://gmatclub.com/forum/microscopic-plants-called-algae-grow-inside-the-top-layer-of-sea-ice-192162.html
___________________________
Seawater-Particle Interactions of Rare Earth Elements and Neodymium Isotopes in the Deep Central Arctic Ocean
2021
https://epic.awi.de/id/eprint/54429/1/2021JC017423.pdf
___________________________
Glacial and environmental changes in northern Svalbard over the last 16.3 ka inferred from neodymium isotopes
2021
https://www.sciencedirect.com/science/article/abs/pii/S0921818121000680
___________________________
The Influence of Water Mass Mixing and Particle Dissolution on the Silicon Cycle in the Central Arctic Ocean
2020
https://www.frontiersin.org/articles/10.3389/fmars.2020.00202/full
___________________________
Geochemical evidence for seabed fluid flow linked to the subsea permafrost outer border in the South Kara Sea
2019
https://www.sciencedirect.com/science/article/abs/pii/S0009281918300904
___________________________
Paleo-sea ice distribution and polynya variability on the Kara Sea shelf during the last 12 ka
23 March 2018
https://link.springer.com/article/10.1007/s41063-018-0040-4
___________________________
Prediction of Oil and Gas Presence in Jurassic-Cretaceous Sediments within the Area of Ob and Taz Gulfs at Kara Sea
December 14, 2018
https://www.rogtecmagazine.com/prediction-of-oil-and-gas-presence-in-jurassic-cretaceous-sediments-within-the-area-of-ob-and-taz-gulfs-at-kara-sea/
___________________________
Particulate
matter fluxes in the southern and central Kara Sea compared to
sediments: Bulk fluxes, amino acids, stable carbon and nitrogen
isotopes, sterols and fatty acids
2007
https://www.academia.edu/15965425/Particulate_matter_fluxes_in_the_southern_and_central_Kara_Sea_compared_to_sediments_Bulk_fluxes_amino_acids_stable_carbon_and_nitrogen_isotopes_sterols_and_fatty_acids
___________________________
Rosneft and ExxonMobil’s Karmorneftegaz Start Drilling With West Alpha in the Kara Sea
August 9, 2014
https://www.rogtecmagazine.com/rosneft-and-exxonmobil-s-karmorneftegaz-start-drilling-with-west-alpha-in-the-kara-sea/
___________________________
Evidence
for Holocene centennial variability in sea ice cover based on IP25
biomarker reconstruction in the southern Kara Sea (Arctic Ocean)
10 February 2017
https://link.springer.com/article/10.1007/s00367-017-0501-y
___________________________
Hydrographic structure and variability of the Kara Sea: Implications for pollutant distribution
1995
https://www.sciencedirect.com/science/article/pii/0967064595000461
___________________________
Particulate
matter fluxes in the southern and central Kara Sea compared to
sediments: Bulk fluxes, amino acids, stable carbon and nitrogen
isotopes, sterols and fatty acids
2007
https://www.sciencedirect.com/science/article/abs/pii/S0278434307002142
___________________________
Changes in Ocean Temperature in the Barents Sea in the 21st Century
10 January 2018
https://ams.confex.com/ams/98Annual/webprogram/Paper323259.html
___________________________
Microplastics: A global disaster in the Arctic Ocean
29 Jan, 2016
https://www.iucn.org/content/microplastics-a-global-disaster-arctic-ocean
___________________________
Assessment of Marine Litter in the Barents Sea, a Part of the Joint Norwegian–Russian Ecosystem Survey
March 2018
https://www.researchgate.net/publication/323581023_Assessment_of_Marine_Litter_in_the_Barents_Sea_a_Part_of_the_Joint_Norwegian-Russian_Ecosystem_Survey
___________________________
Plastic piling up in Arctic Ocean
2017
https://www.grandforksherald.com/newsmd/plastic-piling-up-in-arctic-ocean
___________________________
Current State of Sea Ice Cover
Background
The sea ice cover is one of the key components of the polar climate system. It has been a focus of attention in recent years, largely because of a strong decrease in the Arctic sea ice cover and modeling results that indicate that global warming is amplified in the Arctic on account of ice-albedo feedback. This results from the high reflectivity (albedo) of the sea ice compared to ice-free waters. A satellite-based data record starting in late 1978 shows that indeed rapid changes have been occurring in the Arctic, where the ice coverage has been declining at a substantial rate. In contrast, in the Antarctic the sea ice coverage has been increasing although at a lesser rate than the decreases in the Arctic. Shown below are up-to-date satellite observations of the sea ice covers of both the Arctic and the Antarctic, along with comparisons with the historical satellite record of more than 4 decades. The plots and color-coded maps are chosen to provide information about the current state of the sea ice cover and how the most current daily data available compare with the record lows and record highs for the same date during the satellite era. Sea ice concentration is the percent areal coverage of ice within the data element (grid cell). Sea ice extent is the integral sum of the areas of all grid cells with at least 15% ice concentration, while sea ice area is the integral sum of the product of ice concentration and area of all grid cells with at least 15% ice concentration. The dashed vertical line indicates the date of the latest plotted and mapped data.
https://earth.gsfc.nasa.gov/cryo/data/current-state-sea-ice-cover
___________________________
Arctic ice pack
The Arctic ice pack is the sea ice cover of the Arctic Ocean and its vicinity. The Arctic ice pack undergoes a regular seasonal cycle in which ice melts in spring and summer, reaches a minimum around mid-September, then increases during fall and winter. Summer ice cover in the Arctic is about 50% of winter cover.[1] Some of the ice survives from one year to the next. Currently, 28% of Arctic basin sea ice is multi-year ice,[2] thicker than seasonal ice: up to 3–4 m (9.8–13.1 ft) thick over large areas, with ridges up to 20 m (65.6 ft) thick. Besides the regular seasonal cycle there has been an underlying trend of declining sea ice in the Arctic in recent decades as well.
https://en.wikipedia.org/wiki/Arctic_ice_pack
___________________________
Pack Ice
https://www.earthdata.nasa.gov/topics/cryosphere/pack-ice
___________________________
Drift or pack ice
https://www.antarctica.gov.au/about-antarctica/ice-and-atmosphere/sea-ice/pack-ice/
___________________________
NASA’s ICESat-2 Measures Arctic Ocean’s Sea Ice Thickness, Snow Cover
May 14, 2020
___________________________
Arctic sea ice ecology and history
Dating Arctic ice
Estimates of how long the Arctic Ocean has had perennial ice cover vary.[1] Those estimates range from 700,000 years in the opinion of Worsley and Herman,[2] to 4 million years in the opinion of Clark.[3] Here is how Clark refuted the theory of Worsley and Herman:
Recently, a few coccoliths have been reported from late Pliocene and Pleistocene central Arctic sediment (Worsley and Herman, 1980). Although this is interpreted to indicate episodic ice-free conditions for the central Arctic, the occurrence of ice-rafted debris with the sparse coccoliths is more easily interpreted to represent transportation of coccoliths from ice-free continental seas marginal to the central Arctic. The sediment record as well as theoretical considerations make strong argument against alternating ice-covered and ice-free....The probable Middle Cenozoic development of an ice cover, accompanied by Antarctic ice development and a late shift of the Gulf Stream to its present position, were important events that led to the development of modern climates. The record suggests that altering the present ice cover would have profound effects on future climates.[3]
More recently, Melnikov has noted that, "There is no common opinion on the age of the Arctic sea ice cover."[4] Experts apparently agree that the age of the perennial ice cover exceeds 700,000 years but disagree about how much older it is.[1] However, some research indicates that a sea area north of Greenland may have been open during the Eemian interglacial 120,000 years ago. Evidence of subpolar foraminifers (Turborotalita quinqueloba) indicate open water conditions in that area. This is in contrast to Holocene sediments that only show polar species.
https://en.wikipedia.org/wiki/Arctic_sea_ice_ecology_and_history
___________________________
Arctic ecology
https://en.wikipedia.org/wiki/Arctic_ecology
___________________________
Dynamic and history of methane seepage in the SW Barents Sea: new insights from Leirdjupet Fault Complex
23 February 2021
https://www.nature.com/articles/s41598-021-83542-0
___________________________
New data on the concentration of plutonium isotopes in the sediments of the Barents Sea
09 November 2011
https://link.springer.com/article/10.1134/S1028334X11100151
___________________________
Disequilibrium Uranium (234U/238U) in Natural Aqueous Objects and Climatic Variations: World Ocean
02 September 2021
https://link.springer.com/article/10.1134/S001670292109007X
___________________________
A 160,000-year-old history of tectonically controlled methane seepage in the Arctic
7 Aug 2019
https://www.science.org/doi/10.1126/sciadv.aaw1450
___________________________
The Arctic is warming four times faster than the rest of the planet, new research shows
August 11, 2022
https://www.cnn.com/2022/08/11/us/arctic-rapid-warming-climate/index.html
___________________________
Relating temporal and spatial patterns of DMSP in the Barents Sea to phytoplankton biomass and productivity
2015
https://www.docin.com/p-1410531299.html
___________________________
Heavy metals in fish from the Barents Sea (summer 1994)
1999
https://pubmed.ncbi.nlm.nih.gov/10231981/
___________________________
A Closer Look at the Sea Ice Situation in the Barents Sea
Apr 19 2021
https://www.highnorthnews.com/en/closer-look-sea-ice-situation-barents-sea
___________________________
Energy exchange processes in the marginal ice zone of the Barents Sea, Arctic Ocean, during spring 1999
08 September 2017
https://www.cambridge.org/core/journals/journal-of-glaciology/article/energy-exchange-processes-in-the-marginal-ice-zone-of-the-barents-sea-arctic-ocean-during-spring-1999/1ADD7585AC4E246C9857E8B2105C2F1A
___________________________
Radiological status of the marine environment in the Barents Sea
2012
https://www.academia.edu/es/18268726/Radiological_status_of_the_marine_environment_in_the_Barents_Sea
___________________________
Norway's Aker BP to drill in Arctic Barents Sea, CEO says
29 August 2022
https://sg.news.yahoo.com/norways-aker-bp-drill-arctic-120604696.html
___________________________
Changes in Ocean Temperature in the Barents Sea in the Twenty-First Century
2017
https://www.jstor.org/stable/26388519
___________________________
Selected anthropogenic and natural radioisotopes in the Barents Sea and off the western coast of Svalbard
2013 Sep 17
https://pubmed.ncbi.nlm.nih.gov/24056048/
___________________________
Adaptation of the light-harvesting complex of the Barents Sea brown seaweed Fucus vesiculosus L. to light conditions
2012 Mar 17
https://pubmed.ncbi.nlm.nih.gov/22427226/
___________________________
The Arctic sea ice-cloud radiative negative feedback in the Barents and Kara Sea region
16 July 2022
https://link.springer.com/article/10.1007/s00704-022-04137-x
___________________________
Organic
carbon and nitrogen composition in the sediment of the Kara Sea, Arctic
Ocean during the Last Glacial Maximum to Holocene times
26 June 2007
https://agupubs.onlinelibrary.wiley.com/doi/full/10.1029/2007GL030068
___________________________
Radioactivity in the Ocean: Diluted, But Far from Harmless
April 7, 2011
With
contaminated water from Japan’s crippled Fukushima nuclear complex
continuing to pour into the Pacific, scientists are concerned about how
that radioactivity might affect marine life. Although the ocean’s
capacity to dilute radiation is huge, signs are that nuclear isotopes
are already moving up the local food chain.
https://e360.yale.edu/features/radioactivity_in_the_ocean_diluted_but_far_from_harmless
___________________________
Distribution Patterns of Methane, Hydrogen, and Helium in the Water Column of the Kara Sea
30 January 2022
https://link.springer.com/article/10.1134/S000143702106028X
___________________________
Environment and biology of the Kara Sea: a general view for contamination studies
2001
https://pubmed.ncbi.nlm.nih.gov/11601532/
___________________________
Coastal environments of the western Kara and eastern Barents Seas
1995
https://www.sciencedirect.com/science/article/pii/096706459500047X
___________________________
Trace Contaminant Concentrations in the Kara Sea and its Adjacent Rivers, Russia
2001
https://www.sciencedirect.com/science/article/abs/pii/S0025326X00002368
___________________________
Sorption/desorption of radioactive contaminants by sediment from the Kara Sea
1997
https://www.sciencedirect.com/science/article/abs/pii/S0048969797001010
___________________________
Two nuclear generators missing in Arctic
2013
https://barentsobserver.com/en/arctic/2013/08/two-nuclear-generators-missing-arctic-26-08
___________________________
Microbial processes of the carbon and sulfur cycles in the Kara Sea
29 December 2010
https://link.springer.com/article/10.1134/S0001437010060093
___________________________
Sources and sink of black carbon in Arctic Ocean sediments
2019
https://www.sciencedirect.com/science/article/abs/pii/S0048969719330104
___________________________
PLEISTOCENE-HOLOCENE PALAEOENVIRONMENTAL RECORDS FROM PERMAFROST SEQUENCES AT THE KARA SEA COAST (NW SIBERIA, RUSSIA)
2013
https://ges.rgo.ru/jour/article/view/140
___________________________
Sea birds drop radioactivity on land
4 January 2003
https://www.newscientist.com/article/dn3220-sea-birds-drop-radioactivity-on-land/
___________________________
Shallow carbon storage in ancient buried thermokarst in the South Kara Sea
25 September 2018
https://www.nature.com/articles/s41598-018-32826-z
___________________________
Arctic seabirds build nests with plastic waste
May 16, 2018
The Barents Sea is one of the global oceans' dead ends, which means plastic from elsewhere is accumulating there.
https://www.arctictoday.com/arctic-seabirds-build-nests-plastic-waste/
___________________________
How do intermittency and simultaneous processes obfuscate the Arctic influence on midlatitude winter extreme weather events?
2021-03-18
https://www.osti.gov/biblio/1853654
___________________________
New study strengthens link between Arctic sea-ice loss and extreme winters
October 26. 2014
https://www.carbonbrief.org/new-study-strengthens-link-between-arctic-sea-ice-loss-and-extreme-winters/
___________________________
Geomagnetic storm
https://en.wikipedia.org/wiki/Geomagnetic_storm
___________________________
Thorium and Uranium Isotopes in Arctic Sediments
1989
https://www.semanticscholar.org/paper/Thorium-and-Uranium-Isotopes-in-Arctic-Sediments-Somayajulu-Sharma/0164278a065aa51d56d284f40c281770d903719a
___________________________
Neodymium concentrations and isotopes help disentangling Siberian river influences on the Arctic Ocean
5 May 2021
https://www.geotraces.org/neodymium-siberian-river-influences/
___________________________
Shewanella polaris sp. nov., a psychrotolerant bacterium isolated from Arctic brown algae
January 2020
https://www.researchgate.net/publication/338932841_Shewanella_polaris_sp_nov_a_psychrotolerant_bacterium_isolated_from_Arctic_brown_algae
___________________________
A red tide in the pack ice of the Arctic Ocean
02 July 2019
https://pubmed.ncbi.nlm.nih.gov/31266996/
___________________________
Harmful Algal Blooms in the Arctic
2018
https://www.arctic.noaa.gov/Report-Card/Report-Card-2018/ArtMID/7878/ArticleID/789/Harmful-Algal-Blooms-in-the-Arctic
___________________________
Red Tides Are The Auroras of the Sea
January 27, 2016

A cloud of neon algae surrounds St. Matthew Island in the Bering Sea
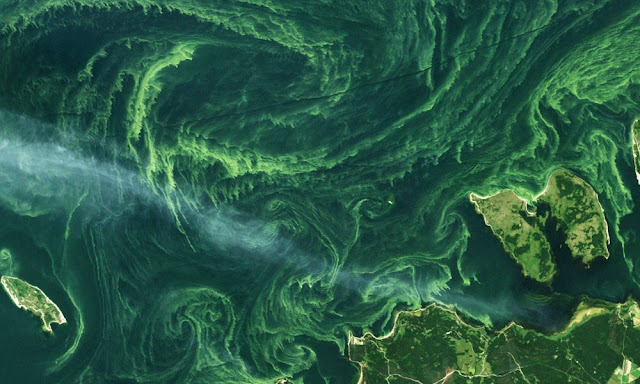
The coast of Estonia
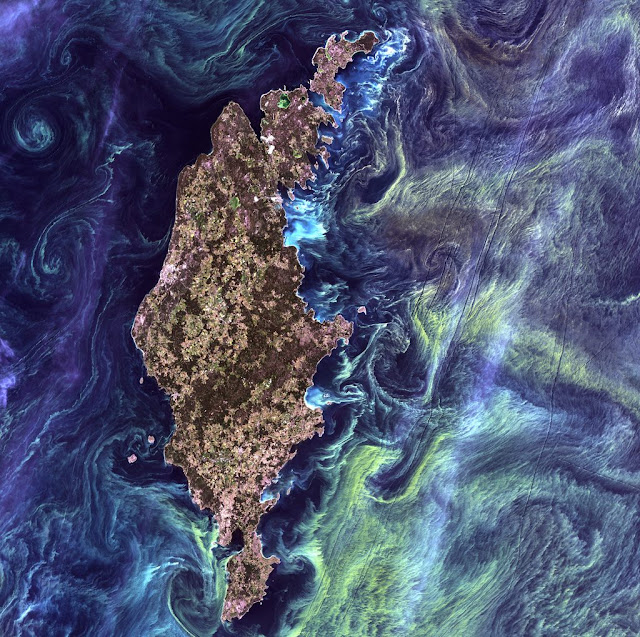
The Swedish island of Gotland

Off the coast of South Africa

Barents Sea

Off the coast of Argentina

Barents Sea
https://www.atlasobscura.com/articles/red-tides-are-the-auroras-of-the-sea
___________________________
Harmful Algae & Red Tides
https://www.whoi.edu/know-your-ocean/ocean-topics/ocean-human-lives/harmful-algae-red-tides/
___________________________
Harmful Algal Blooms in Arctic Waters
2020
https://www.polartrec.com/expeditions/harmful-algal-blooms-in-arctic-waters
___________________________
In a First, Alaska’s Arctic Waters Appear Poised for Dangerous Algal Blooms
December 2, 2021
https://hakaimagazine.com/news/in-a-first-alaskas-arctic-waters-appear-poised-for-dangerous-algal-blooms/
___________________________
What Exactly Is a Red Tide?
https://ocean.si.edu/ocean-life/plants-algae/what-exactly-red-tide
___________________________
Toxic red tides and harmful algal blooms: A pratical challenge in coastal oceanography
July 1995
https://www.researchgate.net/publication/253706985_Toxic_red_tides_and_harmful_algal_blooms_A_pratical_challenge_in_coastal_oceanography
___________________________
A toxic ‘tide’ is creeping over bountiful Arctic waters
06 October 2021
Off the Alaskan coast, scientists find dense beds of algal cysts from a species that make marine animals poisonous to eat.
https://www.nature.com/articles/d41586-021-02715-z
___________________________
Researchers discover that 'red tide' species is deadlier than first thought
July 23, 2012
https://phys.org/news/2012-07-red-tide-species-deadlier-thought.html
___________________________
Deadly Algae Are Creeping Northward
October 29, 2019
In a warming ocean, Alexandrium algae are shredding marine food webs—and disrupting beloved Alaska traditions.
https://www.theatlantic.com/science/archive/2019/10/plague-toxic-algae-making-shellfish-deadly/600406/
___________________________
Evidence for massive and recurrent toxic blooms of Alexandrium catenella in the Alaskan Arctic
October 4, 2021
Significance
The
neurotoxin-producing dinoflagellate Alexandrium catenella is shown to
be distributed widely and at high concentrations in bottom sediments and
surface waters of the Alaskan Arctic. Future blooms are likely to be
large and frequent given hydrographic and bathymetric features that
support high cell and cyst accumulations, and warming temperatures that
promote bloom initiation from cysts in bottom sediments and cell
division in surface waters. As the region undergoes an unprecedented
regime shift, the exceptionally widespread and dense cyst and cell
distributions represent a significant threat to Arctic communities that
are heavily dependent upon subsistence harvesting of marine resources.
These observations also highlight how warming can facilitate range
expansions of harmful algal bloom species into waters where temperatures
were formerly unfavorable.
https://www.pnas.org/doi/10.1073/pnas.2107387118
___________________________
Chemical Composition and Potential Practical Application of 15 Red Algal Species from the White Sea Coast (the Arctic Ocean)
2021 Apr 24
https://www.ncbi.nlm.nih.gov/pmc/articles/PMC8123152/
___________________________
What is the Difference Between Red Brown and Green Algae
March 18, 2019

https://pediaa.com/what-is-the-difference-between-red-brown-and-green-algae/
___________________________
Harmful Algal Blooms in the Alaskan Arctic: An Emerging Threat as the Ocean Warms
April 18, 2022
https://tos.org/oceanography/article/harmful-algal-blooms-in-the-alaskan-arctic-an-emerging-threat-as-the-ocean-warms
___________________________
Arctic Coralline Algae Elevate Surface pH and Carbonate in the Dark.
25 Sep 2018
https://europepmc.org/article/MED/30319676
___________________________
How an accelerated warming cycle in Alaska’s Bering Sea is creating ecological havoc
July 31, 2019
https://www.arctictoday.com/how-an-accelerated-warming-cycle-in-alaskas-bering-sea-is-creating-ecological-havoc/
___________________________
Nitrate supply and uptake in the Atlantic Arctic sea ice zone: seasonal cycle, mechanisms and drivers
31 August 2020
https://royalsocietypublishing.org/doi/10.1098/rsta.2019.0361
___________________________
Shelf-basin gradients shape ecological phytoplankton niches and community composition in the coastal Arctic Ocean (Beaufort Sea)
19 April 2017
https://aslopubs.onlinelibrary.wiley.com/doi/10.1002/lno.10554
___________________________
Effects of Reversal of Water Flow in an Arctic Floodplain River on Fluvial Emissions of CO2 and CH4
23 December 2021
When organic matter from thawed permafrost is released, the sources and
sinks of greenhouse gases (GHGs), like carbon dioxide (CO2) and methane (CH4)
in Arctic rivers will be influenced in the future. However, the
temporal variation, environmental controls, and magnitude of the Arctic
riverine GHGs are largely unknown. We measured in situ high temporal
resolution concentrations of CO2, CH4, and oxygen (O2)
in the Ambolikha River in northeast Siberia between late June and early
August 2019. During this period, the largely supersaturated riverine CO2 and CH4 concentrations decreased steadily by 90% and 78%, respectively, while the O2
concentrations increased by 22% and were driven by the decreasing water
temperature. Estimated gas fluxes indicate that during late June 2019,
significant emissions of CO2 and CH4 were
sustained, possibly by external terrestrial sources during flooding, or
due to lateral exchange with gas-rich downstream-flowing water. In July
and early August, the river reversed its flow constantly and limited the
water exchange at the site. The composition of dissolved organic matter
and microbial communities analyzed in discrete samples also revealed a
temporal shift. Furthermore, the cumulative total riverine CO2 emissions (36.8 gC-CO2 m−2) were nearly five times lower than the CO2 uptake at the adjacent floodplain. Emissions of riverine CH4 (0.21 gC-CH4 m−2) were 16 times lower than the floodplain CH4
emissions. Our study revealed that the hydraulic connectivity with the
land in the late freshet, and reversing flow directions in Arctic
streams in summer, regulate riverine carbon replenishment and emissions.
https://agupubs.onlinelibrary.wiley.com/doi/10.1029/2021JG006485
___________________________
Arctic marine phytobenthos of northern Baffin Island
31 March 2016
https://onlinelibrary.wiley.com/doi/10.1111/jpy.12417
___________________________
Fatty acid and elemental composition of littoral “green tide” algae from the Gulf of Finland, the Baltic Sea
07 June 2014
https://link.springer.com/article/10.1007/s10811-014-0349-8
___________________________
Nutrient fluxes during extended blooms of Arctic ice algae
1987
https://www.academia.edu/18822911/Nutrient_fluxes_during_extended_blooms_of_Arctic_ice_algae
___________________________
A red tide in the pack ice of the Arctic Ocean.
02 Jul 2019
https://europepmc.org/article/MED/31266996
___________________________
Algae: Encyclopedia Arctica 5: Plant Sciences (General)
https://collections.dartmouth.edu/teitexts/arctica/diplomatic/EA05-06-diplomatic.html
___________________________
Flora and Vegetation of Arctic Alaska, Yukon, and Northwestern Canada: Encyclopedia Arctica 6: Plant Sciences (Regional)
Written By Stefansson, Vilhjalmur, 1879-1962
https://collections.dartmouth.edu/teitexts/arctica/diplomatic/EA06-12-diplomatic.html
___________________________
Arctic marine phytobenthos of northern Baffin Island
2016
https://www.deepdyve.com/lp/wiley/arctic-marine-phytobenthos-of-northern-baffin-island-xcTE9AWGcp
___________________________
Marine Benthic Algae of the Russian Coasts of the Bering Sea (from Ozernoi Gulf to Dezhnev Bay, including Karaginskii Island)
2002
https://ucjeps.berkeley.edu/constancea/83/selivanova/Selivanova.html
___________________________
'Red tide' algal blooms appearing around B.C. coastal waters
Jul 18, 2018
https://www.cbc.ca/news/canada/british-columbia/red-tide-algal-blooms-algae-bc-coastal-waters-1.4749546
___________________________
Red tide may be linked to Quebec whale deaths
Aug 14, 2008
https://www.cbc.ca/news/canada/montreal/red-tide-may-be-linked-to-quebec-whale-deaths-1.747525
___________________________
A recurring bloom of toxic marine cyanobacteria above the Arctic Circle
https://www.academia.edu/9575271/A_recurring_bloom_of_toxic_marine_cyanobacteria_above_the_Arctic_Circle
___________________________
Green Tides
Definition
Green
tides are ecological disasters in which massive biomass of one or
multiple green seaweed species accumulates in either shallow coastal or
open waters, forming drifting canopies and harming the local environment
and ecosystem.
Scientific Fundamentals
Green tides are
vast accumulations of unattached green macroalgae in either coastal or
open waters, causing significant detrimental environmental impacts. As a
type of harmful algal blooms (HABs), green tides differ from the other
HABs (e.g., red tides, brown tides, and golden tides) obviously with the
blooming species, which are predominated by one or multiple green
macroalga species. Green microalgae or cyanobacteria blooms (e.g.
microcystis blooms in Taihu Lake, China), although, in green color, are
blooms of single-cell microalgae, which do not fall into the category of
green tides. The green tide is increasing globally, especially along
the coasts of America,...
https://link.springer.com/referenceworkentry/10.1007/978-981-10-6963-5_313-1
___________________________
Phytoplankton and red tide
https://www.dfo-mpo.gc.ca/science/data-donnees/plankton-plancton/plankton-plancton-eng.html
___________________________
The fate of the Arctic seaweed Fucus distichus under climate change: an ecological niche modeling approach
16 February 2016
https://onlinelibrary.wiley.com/doi/full/10.1002/ece3.2001
___________________________
Seaweeds in Cold Seas: Evolution and Carbon Acquisition
https://www.ncbi.nlm.nih.gov/pmc/articles/PMC4240374/
___________________________
17 Plants in The Ocean Biome
https://deepoceanfacts.com/plants-in-the-ocean-biome
___________________________
The Scientific Reason Oceans Appear To Be Different Colors
April 19, 2022
https://www.grunge.com/836969/the-scientific-reason-oceans-appear-to-be-different-colors/
___________________________
Siberian Wildfires Doubly Dangerous to Distracted Russia
May 21, 2022
https://www.yourearth.net/siberian-wildfires-doubly-dangerous-to-distracted-russia/
___________________________
New study finds black spruce trees struggling to regenerate amid more frequent arctic fires
October 25, 2021
https://phys.org/news/2021-10-black-spruce-trees-struggling-regenerate.html
___________________________
15+ Various Tundra Plants That Can Be Found in Tundra Region
https://www.conserve-energy-future.com/various-tundra-plants.php
___________________________
Northern Lights in Iceland
https://adventures.is/information/about-northern-lights/
___________________________
Cycles of 12,000 and 24,000 years leading to cataclysms on Earth | Joe Blundell
Mar 19, 2022
https://www.youtube.com/watch?v=PMNJ4Lwoo48
___________________________
Ep092 Winter Solstice 2012-2022 / Arctic Ice Death Spiral? -Kosmographia The Randall Carlson Podcast
Jan 20, 2023
https://www.youtube.com/watch?v=FDkff73zoYI
___________________________
Sunspots and Sea Surface Temperature
2014
I thought I was done with sunspots … but as the well-known climate scientist Michael Corleone once remarked, “Just when I thought I was out … they pull me back in”. In this case Marcel Crok, the well-known Dutch climate writer, asked me if I’d seen the paper from Nir Shaviv called “Using the Oceans as a Calorimeter to Quantify the Solar Radiative Forcing”, available here. Dr. Shaviv’s paper claims that both the ocean heat content and the ocean sea surface temperature (SST) vary in step with the ~11 year solar cycle. Although it’s not clear what “we” means when he uses it, he says:
“We find that the total radiative forcing associated with solar cycles variations is about 5 to 7 times larger than just those associated with the TSI variations, thus implying the necessary existence of an amplification mechanism, though without pointing to which one.” Since the ocean heat content data is both spotty and incomplete, I looked to see if the much more extensive SST data actually showed signs of the claimed solar-related variation.
https://wattsupwiththat.com/2014/06/06/sunspots-and-sea-surface-temperature/
___________________________
Solar Storm Threat Is Back as Giant Sunspot Cluster Reappears
https://gizmodo.com/sunspot-cluster-returns-auroras-repeat-possible-sun-1851503363
___________________________
Sunspots and the Solar Cycle explained
December 2, 2023
The darker coloured spots on the sun are Sunspots – areas on the sun where there is magnetic activity causing the intense heat surrounding the sunspot. Think of it as an inverted volcano, caused by magnetic polarity changes, where the interior (the dark spot) is cooling magma whilst surrounding this is intense activity that boils and bubbles and very often erupts in spouts of flames, thrusting material from the sun out in to space.
It takes roughly two weeks for the earth to receive the heat and energy from these spots as the sun revolves, spitting out this energy which causes the Aurora Borealis; it is like a revolving leaking hose (ball shaped obviously) that consistently frees energy into the atmosphere with occasional sun flares pushing extra, huge amounts of energy out.
The more sunspots there are, the more activity there is, and every 11 years or so there is an increase in the amount of sunspots until the peak, which is called the Solar maximum, this then gradually subsides to the solar minimum, and so on in a cycle.
The increase is caused by the polarity of the sun changing – this huge electrically charged mass of seething hot hydrogen and other gases swops northern and southern electrical poles around and this causes the sun’s polarity to weaken and then disappear. The solar polarity then reappears in the reverse format.
The period of the solar maximum can cause electrical disruptions and satellite and communications problems due to the intense radiation storms that are produced that collide with the outer atmospheres of earth where our satellites rotate and these geomagnetic storms can last several days. These violent storms sometimes mean that the Northern lights can be seen as far south as Scotland in the United Kingdom.
The period of the solar maximum can cause electrical disruptions and satellite and communications problems due to the intense radiation storms that are produced that collide with the outer atmospheres of earth where our satellites rotate and these geomagnetic storms can last several days. These violent storms sometimes mean that the Northern lights can be seen as far south as Scotland in the United Kingdom.
Scientists believe that the solar activity definitely affects the earth’s weather and there is evidence that the solar maximum causes fiercer storms like the cyclones. It is also thought that the solar cycle is connected in some way to global and regional climate change, where a prolonged solar minimum is thought to have caused the ice age.
In summary the more sunspots the higher the chances of you seeing the Northern Lights!
However, at the time of writing (2019) we are in a Solar minimum meaning that we are the low end of solar activity. However we are still seeing spectacular Northern lights at the Arctic circle because of the substorm effect – this is caused by electrical disturbances in the magnetosphere near to Earth, or various other unstable elements caused originally by sunspots. Research into this field is still ongoing and we do not fully understand the causes but know that the Northern Lights will only appear closer to the poles during a solar minimum and we know that we can still get superb Northern lights even if it means that we have to go further north to see them.
https://aurora-nights.co.uk/aurora-academy/what-are-the-northern-lights/sunspots-and-solar-cycle/
___________________________
Solar storm is powerful enough to disrupt communications: Why NOAA says not to worry
May 10, 2024
Any solar storm of this magnitude has the potential to interfere with Earth's infrastructure. While NOAA alerted satellite and grid operators, most people are encouraged to catch some rare auroras.
An uncommonly strong solar storm is hurtling toward Earth, bringing with it the power to disrupt some communications and even produce some dazzling northern lights.
The storm's impending arrival prompted the National Oceanic and Atmospheric Administration to issue a rare storm watch Thursday to warn about the possible toll it could take when the solar eruption reaches Earth as early as Friday evening.
But before you go preparing for some sort of emergency, most of those at risk of enduring the storm's wrath are power plant operators and those aboard spacecrafts. Instead, if you live anywhere in the northern part of the United States, tonight may be a good time to head outside and try to catch some auroras, NOAA officials said at a Friday news conference.
The last G4 level solar storm hit Earth in March, one of only three storms of that severity observed since 2019, according to NOAA's Space Weather Prediction Center. The last time Earth was hit by a G5 storm was October 2003, when power outages were reported in Sweden and transformers were damaged in South Africa, NOAA officials said Friday.
Solar flares unleash coronal mass ejections toward Earth
NOAA has been tracking the explosive bursts of radiation known as solar flares since Wednesday from a sunspot cluster that's a whopping 16 times wider than Earth.
The solar flares have unleashed at least five coronal mass ejections – clouds of plasma and charged particles – that are now making their way toward our planet at a breakneck pace, said Brent Gordon, chief of the space services branch of the Space Weather Prediction Center.
By releasing solar particles and electromagnetic radiation toward our planet, the coronal mass ejections are what drive the geometric storms toward Earth. Such electromagnetic activity will only increase as the sun continues to reach the height of its 11-year solar cycle, which NASA said is expected to be in 2025.
Last December, a powerful burst of energy created the largest solar flare that NASA had detected since 2017.
A destructive solar storm in 1989 caused electrical blackouts across Quebec for 12 hours, according to NASA, plunging millions of Canadians into the dark and closing schools and businesses. The most intense solar storm on record, the Carrington Event, occurred in 1859 – sparking fires at telegraph stations and preventing messages from being sent.
Forecasters use a five-level scale to measure geometric storms. At a G4, this one is just a single level away from being the most severe solar storm possible, according to NOAA. The Severe (G4) Geomagnetic Storm Watch the agency posted on Thursday marked its first since 2005...
https://www.usatoday.com/story/news/nation/2024/05/10/severe-solar-storm-2024/73642315007/
___________________________
Solar storm could bring auroras, power and telecoms disruptions to Earth
10 May 2024
African region experienced interruptions
The South African National Space Agency (SANSA) said the African region experienced interruptions in high frequency communications due to two X-class flares and several M-class flares that were observed in the past 24 hours.
When ranking ranking solar flares based on intensity, five categories are used — A, B, C, M and X. SANSA said A-class are the weakest, while X-class are the most energetic.
___________________________
Geomagnetic storm to impact Earth over the weekend
10/2024
The origin of this storm is a solar flare that erupted from sunspot 3842 on Thursday, 3 October at 14h18. This is the strongest Earth-facing solar flare recorded by SANSA in the past seven years and measured X9.05. Solar flares are measured in five categories, A, B, C, M and X with X being the strongest.
Thursday’s X9 flare impacted high frequency radio communications resulting in a total radio blackout over the African region which lasted for up to 20 minutes. SANSA has been monitoring sunspot region 3842 since Sunday, 29 September 2024, when it appeared on the Sun’s visible disk and is about 1,5 times larger than the Earth’s surface area. The Sunspot produced several significant solar flares and associated coronal mass ejections (CMEs), which are waves of charged energetic particles. These waves of energetic particles will impact Earth over the weekend, causing geomagnetic storms.
The impact of the CME recorded on 1 October, is expected later today (Friday, 4 October 2024) and a minor (G1) storm has been forecast. The CME recorded on 3 October (associated with the major X9 flare) is expected to impact the Earth tomorrow (Saturday, 5 October 2024) and geomagnetic conditions are expected to range from G1/Minor storm to G3/strong with storm levels possibly reaching G4/Severe storm throughout the day.
South Africans had a rare glimpse of the Aurora Australis or Southern Lights on 10 May this year during the “Mother’s Day Storm” and many photos of red aurora were captured during the G5/Extreme storm.
Dr Mpho Tshisaphungo, SANSA Head of Space Weather believes that if this CME reaches Earth later tonight into the early morning hours tomorrow, there might be a small chance of spotting the Southern Lights. However, confidence is low as this is dependent on the strength of the geomagnetic storm. She explains that aurora is only visible during the night and with no cloud cover.
Geomagnetic storms can have a severe impact on communication and
navigation systems as well as the power grid. Industries using these
systems should take note of possible disruptions over the weekend.
https://www.antarcticacruises.com/guide/antarctica-sunrise-sunset-and-the-green-flash
___________________________
There's still a chance to see the Northern Lights from lower latitudes
May 12, 2024
https://www.npr.org/2024/05/12/1250812592/northern-lights-solar-storm-power-grid-satellites
___________________________
The Arctic Circle

Northern lights or Aurora Borealis
The Arctic is one of the Earth’s great un-spoilt wildernesses and everyone knows that at its centre is the North Pole. It is bounded by an imaginary line known as the Arctic Circle.
Rather than simply being defined as a simple line of latitude, the position of the Arctic Circle is dependent on the degree of axial tilt of the Earth in relation to the plane of its orbit, known in astronomical terms as obliquity. It is probably not widely known that the Earth’s tilt is constantly changing and varies between 22.1 degrees and 24.5 degrees over a 41,000 year period. It is difficult to relate to time scales such as this but in simple terms, the Earth’s tilt is currently in the phase of reduction, the effect of which is that the position of the Arctic Circle is steadily advancing northwards at a rate of about fifteen metres per year...
https://www.beautifulworld.com/north-america/the-arctic-circle/
___________________________
Antarctica's Sunrise, Sunset & The Green Flash Phenomenon
May 23rd, 2024
The Green Flash at Sunset (or Sunrise)
Speaking of mirages: Among the most famous and elusive optical phenomena that can be observed in Antarctica’s pristine skies is the rarely observed and much-coveted green flash. The green flash describes a generally very fleeting smudge, disc, or rim of emerald—or, sometimes, blue—flaring out above the Sun when it’s nearly or entirely below the horizon.
Clear, clean, still air and a very level horizon provide the best conditions for observing the green flash. The White Continent’s icy seascapes and high, flat (and little-visited) Polar Plateau offer a prime setup, even if the odds of spotting the green flash during any given Antarctica sunset are low.
Indeed, so uncommon and unpredictable is the green flash that over the centuries it’s sometimes been passed off as a mariner’s myth. Yet photographs exist that prove its existence, and some Antarctic tourists have indeed lucked out with a once-in-a-lifetime glimpse.
The 1929 Green Flash Observation at Little America in Antarctica
On October 16, 1929, members of Admiral Richard Byrd’s first Antarctic expedition enjoyed one heck of a green-flash spectacle—perhaps the most impressive ever recorded by human observers—from the Little America base on the Ross Ice Shelf.
They saw the green flash on and off for more than a half-hour, much longer than the usual momentary, don’t-blink-or-you’ll-miss-it firing. An academic analysis in 2015 suggested that a combination of factors likely accounted for this extended show. These included “strong atmospheric refraction” facilitating a so-called Novaya Zemyla-style mirage—which can produce a distorted image of the Sun when it’s actually several degrees below the horizon—as well as the expedition members effectively landing themselves two sunsets by climbing up Little America’s radio towers during the event.
https://www.antarcticacruises.com/guide/antarctica-sunrise-sunset-and-the-green-flash
___________________________
Africa: A Geomagnetic Storm Has Hit Earth - a Space Scientist Explains What Causes Them
8 October 2024
https://allafrica.com/stories/202410080323.html
___________________________
Quebec Blackout 1989: Lessons From the Geomagnetic Storm That Shocked an Entire Nation
Jul 21 202
https://www.sciencetimes.com/articles/44957/20230721/quebec-blackout-1989-lessons-geomagnetic-storm-shocked-entire-nation.htm
___________________________
March 1989 geomagnetic storm
The March 1989 geomagnetic storm occurred as part of severe to extreme solar storms during early to mid March 1989, the most notable being a geomagnetic storm that struck Earth on March 13. This geomagnetic storm caused a nine-hour outage of Hydro-Québec's electricity transmission system. The onset time was exceptionally rapid.[1] Other historically significant solar storms occurred later in 1989, during a very active period of solar cycle 22.
https://en.wikipedia.org/wiki/March_1989_geomagnetic_storm
___________________________
Solar Storm Threat Is Back as Giant Sunspot Cluster Reappears
It’s back! After unleashing the strongest geomagnetic storm in more than 20 years, the notorious sunspot cluster AR3664 is once again visible and still spewing copious amounts of radiation into space.
The National Oceanic and Atmospheric Administration’s (NOAA) Space Weather Prediction Center recorded a solar flare erupting from the southeast limb of the Sun on Monday. Sunspot AR3664 is likely responsible for the flare, which was classified as a strong X2.8.
https://gizmodo.com/sunspot-cluster-returns-auroras-repeat-possible-sun-1851503363
___________________________
Arctic News: Accelerating Temperature Rise
The Northern Hemisphere temperature was 12.68°C on March 18, 2025, a record daily high and 1.57°C higher than 1979-2000.
Very high temperature anomalies are forecast over the Arctic Ocean for November 2025.
One such mechanisms is loss of sea ice. Loss of Arctic sea ice volume is illustrated by the image on the right.
An additional mechanism is sunspots that are expected to reach their maximum in this cycle in July 2025, while the number of sunspots is also higher than predicted.
https://chrr.biz/2025/03/24/arctic-news-accelerating-temperature-rise/
___________________________
Sunspots, the QBO, and the Stratosphere in the North Polar Region: An Update
2008
Abstract
The 11-year sunspot cycle (SSC) strongly affects the lower stratosphere. However, in order to detect the solar signal it is necessary to group the data according to the phase of the Quasi-Biennial Oscillation (QBO). Although this is valid throughout the year the effect of the SSC and the QBO on the stratosphere was largest during the northern winters (January/February). As the stratosphere can affect weather at the ground, the SSC effect on the lower stratosphere might provide a mechanism for solar-climate links. Here we analyse an extended, 65-year long data set of solar variability, QBO, and lower stratospheric dynamics. The results fully confirm earlier findings and suggest a significant effect of the SSC on the strength of the stratospheric polar vortex and on the mean meridional circulation.
https://link.springer.com/chapter/10.1007/978-1-4020-6766-2_24
___________________________
Sunspots
https://arctic-news.blogspot.com/p/sunspots.html
___________________________
How the Sun Controls Arctic Sea Ice and Temperatures
2021
https://perhapsallnatural.blogspot.com/2021/10/how-sun-controls-arctic-sea-ice-and.html
___________________________
The sun takes a rare hiatus
April 7, 2025
Sunspot activity may be entering a lull for the first time in almost 400 years, offering scientists a rare chance to gauge how solar conditions affect Earth’s climate. “This is highly unusual and unexpected” says Frank Hill, a researcher at the National Solar Observatory. Three new NSO studies suggest that the sun’s fluctuating magnetic field may soon become too weak to produce sunspots, those dark regions of gas on the solar surface that normally wax and wane every 11 years. The sun should reach the peak of that cycle next year, but its recent calm “weather” including slower surface wind patterns and fewer solar flares could signal it’s entering a period of relative dormancy. That would mean less solar radiation reaching the Earth.
The last time sunspots disappeared, in 1645, their absence lasted for 70 years, during which Earth experienced a frigid period known as the “Little Ice Age.” Hill says there’s not “enough evidence either way” to say whether that dip in the sun’s magnetic activity caused the Earth’s cooling. But he says the coming sunspot hiatus will be “a splendid opportunity” to figure out how the sun’s weather affects our climate.
https://www.antarcticajournal.com/the-sun-takes-a-rare-hiatus/
___________________________
Correlation of global temperature with solar activity
http://www.hyperphysics.phy-astr.gsu.edu/hbase/thermo/solact.html
___________________________
Graphic: Temperature vs Solar Activity
July 10, 2020
https://climate.nasa.gov/climate_resources/189/graphic-temperature-vs-solar-activity/
___________________________
Guest post: Why does the Arctic warm faster than the rest of the planet?
11 February 2022
https://www.carbonbrief.org/guest-post-why-does-the-arctic-warm-faster-than-the-rest-of-the-planet/
While the Earth’s surface as a whole has warmed by around 1.2C since the industrial revolution, temperatures are not rising at the same rate in all corners of the world.
One difference is the faster pace that land areas are warming compared to the ocean. But perhaps the biggest outlier is the Arctic, which is warming more than two times faster than the global average (pdf).
This phenomenon – known as “Arctic amplification” – is causing dramatic changes for Arctic communities and has also been linked to extreme weather events in the mid-latitudes of the northern hemisphere.
The cause of this rapid warming is typically identified as the changing “albedo” of the Arctic’s surface – where the loss of snow and sea ice means less incoming sunlight is reflected back out to space.
But the reality is a little more complicated than that. In a new paper, published in Frontiers in Earth Science, my co-authors and I unpack the different factors that are contributing to the fast pace of change in the Arctic.
Amplified warming
The chart below shows annual average surface temperatures, relative to 1951-80, for the whole planet (blue line) and the Arctic (red). Since around 1990, the Arctic is clearly warming faster than the rest of the planet.
This amplified warming in the Arctic is often solely attributed to the surface-albedo feedback. Back in 1896, the Swedish chemist Svante Arrhenius noted that “those places that alter their albedo through the progression or regression of the snow-covering…will probably remove the maximum effect [of increased carbon dioxide] from lower parallels to the neighbourhood of the poles”.
The reasoning is simple: ice and snow are white and therefore reflect a lot of the incoming sunlight. After an initial warming and melting of the snow and ice, the white surface gets replaced with a darker surface of the open ocean, which absorbs more sunlight, thus leading to additional local warming.
While it is understood that the reasons for amplified Arctic warming are more complex than just the surface albedo feedback, the simplicity of this mechanism has captured the narrative around Arctic warming, especially in the public.
Depending on how it is calculated, the surface albedo feedback may account for 30% to 60% of the total Arctic warming. However, the other processes described below trigger the surface albedo feedback (role of water vapour) and confine Arctic warming to the surface (absence of convection). Hence it is hard to accurately quantify how much a single process is responsible for Arctic warming.
Convection
While there is only one Earth to observe, we can use climate models to look at the pattern of warming in a world with no ice. Many models have found that, in the absence of sea ice or when sea ice has completely melted in high emission scenarios, the warming pattern is still amplified in the Arctic – albeit less so than when sea ice is declining.
Much like how biologists study bacteria, fruit flies and mice to infer knowledge about the human system, climate scientists use a hierarchy of climate models to understand the complex Earth system.
For example, the figure below is from an idealised climate model which has no ice, no clouds and no ocean circulation. Although this basic model is not as accurate as the comprehensive models used to simulate the impact of future emission scenarios, it helps us to gain an understanding of the climate system as it is simpler to understand.
The charts show the difference in atmospheric temperature during the winter (left) and summer (right) across the planet between a world with a very high atmospheric CO2 concentration (1,200 parts per million, ppm) and a pre-industrial world (300ppm). (For comparison, global CO2 levels are currently around 410ppm.) The x-axis indicates latitude, from the south pole (-90 degrees north) on the left to the north pole (90 degrees north) on the right.
Most noticeable in the charts is the warming in the upper troposphere (around 200 hPa) in the tropics throughout the year – shown by the large patch of red from -30 to 30 degrees north. However, you can also see a patch of red at the Earth’s surface (around 900 hPa) in the Arctic during winter. Even in this hypothetical world with no ice or clouds, the Arctic warms around 1.5 times more than the rest of the planet for the year as whole.
One of the key reasons more warming occurs at high latitudes – even in the absence of sea ice – is the absence of convection at high latitudes.
Convection occurs when air close to the ground is heated by the warm surface of the Earth. The warmed air is lighter than the cold air above and so starts to rise. In the tropics, the ground – and the air directly above it – is always heated by the sun, hence there is a lot of convection and the atmosphere is “well mixed” with so much rising air.
At high latitudes, however, the angle between sunlight and the surface means the incoming sunlight is less concentrated on the surface. As a result, the atmosphere is mostly heated by warm moist air coming from the tropics, which means there is much less vertical mixing.
The added warming from the CO2 and other greenhouse gases that humans have emitted generally heats the atmosphere most near the Earth’s surface. In the presence of convection, this warming gets mixed vertically. However, at high latitudes – such as the Arctic – the absence of convection causes the warming from greenhouse gases to be larger near the surface.
Water vapour
Another key reason for amplified warming in the Arctic is the increase in transport of water vapour from the equator to the poles.
The warm moist air from the tropics gets transported to the poles by the circulation of the atmosphere, and keeps the difference in temperature between the equator and the poles relatively small.
As a warmer atmosphere can hold more moisture, we expect there to be more water vapour in the tropical atmosphere as global temperatures rise. This additional moisture gets transported to the poles, where it condenses and releases heat.
Moreover, the extra water vapour in the Arctic atmosphere leads to an increased greenhouse effect and affects cloud formation, both of which can lead to additional Arctic surface warming.
Seasonal differences
An additional important feature of Arctic amplification is that it occurs mostly in winter.
This is mostly due to Arctic sea ice decline. Liquid water has a large “heat capacity” – it takes a long time to heat up and cool down. Hence when sea ice melts in summer and early autumn, it leads to an increase in sunlight absorbed by the Arctic ocean.
This stored heat is then released in winter when there is no sunlight and the atmosphere is colder than the underlying Arctic ocean.
The maps below highlight the difference in surface temperature between averages taken over 1960-2020 and 2010-20 in the northern hemisphere winter (top left) and summer (bottom left). The darkest red shading indicates the largest temperature rise.
The plot on the right shows the same temperature change as an average at each point of latitude across the Earth – from the south pole (-90 degrees north) on the left to the north pole (90 degrees north) on the right. This again shows how Arctic amplification is predominantly a winter (red line) phenomenon.
The absence of convection and water vapour also affect Antarctica and lead to amplified Antarctic warming. However, it is weaker relative to the Arctic because of the high elevation of the Antarctic continent and smaller surface albedo feedback. Also, it is delayed due to the Southern Ocean circulation, which brings up cold water from the deep ocean and cools the surface.
Proxy data
The simplicity of the ice-albedo feedback has captured the narrative around Arctic amplification. However, this pattern of warming is now understood to be a fundamental feature of a moist atmosphere with little convection at high latitudes.
The Earth has kept a record of its past climates, and scientists today can analyse various “proxies” – such as shells, stalactites, pollen and seal pelts – to deduce the global climate going back many millions of years.
Studies of the climate in the distant past have shown that, regardless of whether the climate was colder or warmer, the surface temperature change was still amplified in the Arctic.
And even if global temperatures rise to the point where all Arctic sea ice melted – not a prospect that anyone would want – we would still expect warming to be faster in the Arctic.
https://www.carbonbrief.org/guest-post-why-does-the-arctic-warm-faster-than-the-rest-of-the-planet/
___________________________
Arctic Temperatures Surge Above Average
February 6, 2025
https://www.gktoday.in/arctic-temperatures-surge-above-average-in-february-2025/#google_vignette
___________________________
Why is Earth heated unevenly?
June 21, 2024
https://www.ncesc.com/geographic-faq/why-is-earth-heated-unevenly/
___________________________
Why Does the Sun Heat the Earth Unevenly?
___________________________
Albedo
Albedo (/ælˈbiːdoʊ/ ⓘ al-BEE-doh; from Latin albedo 'whiteness') is the fraction of sunlight that is diffusely reflected by a body. It is measured on a scale from 0 (corresponding to a black body that absorbs all incident radiation) to 1 (corresponding to a body that reflects all incident radiation). Surface albedo is defined as the ratio of radiosity Je to the irradiance Ee (flux per unit area) received by a surface.[2] The proportion reflected is not only determined by properties of the surface itself, but also by the spectral and angular distribution of solar radiation reaching the Earth's surface.[3] These factors vary with atmospheric composition, geographic location, and time (see position of the Sun).
While directional-hemispherical reflectance factor is calculated for a single angle of incidence (i.e., for a given position of the Sun), albedo is the directional integration of reflectance over all solar angles in a given period. The temporal resolution may range from seconds (as obtained from flux measurements) to daily, monthly, or annual averages.
Unless given for a specific wavelength (spectral albedo), albedo refers to the entire spectrum of solar radiation.[4] Due to measurement constraints, it is often given for the spectrum in which most solar energy reaches the surface (between 0.3 and 3 μm). This spectrum includes visible light (0.4–0.7 μm), which explains why surfaces with a low albedo appear dark (e.g., trees absorb most radiation), whereas surfaces with a high albedo appear bright (e.g., snow reflects most radiation).
Ice–albedo feedback is a positive feedback climate process where a change in the area of ice caps, glaciers, and sea ice alters the albedo and surface temperature of a planet. Ice is very reflective, therefore it reflects far more solar energy back to space than the other types of land area or open water. Ice–albedo feedback plays an important role in global climate change.[5] Albedo is an important concept in climate science.
https://en.wikipedia.org/wiki/Albedo
___________________________
Why solar storms from space may blind and strand whales
February 24, 2020
Space weather has more implications than causing glitches in Earth’s satellite-based communications – it can also strand gray whales, according to a new study. Typically, space weather is created when solar storms occur on the sun and stream out toward Earth. The high-energy particles can disrupt our communications and Earth’s magnetic field.
But they may also be interfering with whale navigation. Gray whales have one of the longest migrations among mammals, traveling between 10,000 and 12,000 miles each year. They complete a round trip between Mexico’s warm waters for mating and the Arctic for feeding. They migrate near the shore throughout their lengthy journey, which makes tracking them – and their stranding events – a little easier.
But scientists don’t entirely understand how gray whales accomplish this navigational feat. The ocean isn’t exactly full of visual cues like it is for those on land. Scientists think right whales migrate based on other senses – like picking up on Earth’s reliable magnetic field.
https://www.cnn.com/2020/02/24/world/gray-whale-solar-storms-scn/
___________________________
Bowhead whales’ migration patterns have shifted in the Arctic
March 19, 2023
https://www.adn.com/alaska-news/wildlife/2023/03/19/bowhead-whales-migration-patterns-have-shifted-in-the-arctic/
___________________________
Why Orcas have been lingering longer in the Arctic
December 3, 2021
https://www.npr.org/2021/12/03/1061333587/why-orcas-have-been-lingering-longer-in-the-arctic
___________________________
With glacial melt accelerating, a geoengineering movement gathers momentum (Debated)
March 15, 2018
https://www.arctictoday.com/glacial-melt-accelerating-geoengineering-movement-gathers-momentum/
__________________________
Microbubbles and Sea Foam (Controversial)
Proposal
https://www.geoengineeringmonitor.org/technologies/microbubbles
___________________________
Could Turning the Oceans Into a Giant Bubble Bath Cool the Planet? (Controversial)
Nov 20, 2019
___________________________
Inducing air bubbles into the ocean may help slow down hurricanes (Controversial)
https://www.earth.com/news/air-bubbles-slow-hurricanes/
___________________________
Mile-High Tsunami Caused by Dinosaur-Killing Asteroid Left Behind Towering ‘Megaripples’
July 19, 2021
Seismic imaging data depicts 52-feet high waves 5,000 feet below Louisiana
https://www.smithsonianmag.com/smart-news/mile-high-tsunami-caused-dinosaur-killing-asteroid-left-behind-towering-megaripples-180978229/
___________________________
Dino-killing asteroid set off mile-high tsunami and month-long mega-quake
October 07, 2022
https://newatlas.com/science/dinosaur-asteroid-mile-high-tsunami-month-long-earthquake/
___________________________
How Doggerland Sank Beneath The Waves (500,000-4000 BC) // Prehistoric Europe Documentary
Jan 26, 2020
https://www.youtube.com/watch?v=DECwfQQqRzo
___________________________
Doggerland
Doggerland was a large area of land in Northern Europe, now submerged beneath the southern North Sea. This region was repeatedly exposed at various times during the Pleistocene epoch due to the lowering of sea levels during glacial periods. However, the term "Doggerland" is generally specifically used for this region during the Late Pleistocene and Early Holocene. During the early Holocene following the glacial retreat at the end of the Last Glacial Period, the exposed land area of Doggerland stretched across the region between what is now the east coast of Great Britain, the Netherlands, north-west Germany, and the Danish peninsula of Jutland. Between 10,000 and 7,000 years ago, Doggerland was inundated by rising sea levels, disintegrating initially into a series of low-lying islands before submerging completely. The impact of the tsunami generated by the Storegga underwater landslide c. 8,200 years ago on Doggerland is controversial. The flooded land is known as the Dogger Littoral.
Doggerland was named after the Dogger Bank (which in turn was named after 17th-century Dutch fishing boats called doggers), which formed a highland region that became submerged later than the rest of Doggerland.
The archaeological potential of the area was first identified in the early 20th century. Interest intensified in 1931 when a fishing trawler operating east of the Wash dragged up a barbed antler point that was subsequently dated to a time when the area was tundra. Vessels have since dragged up remains of mammoths, lions and other animals, and a few prehistoric tools and weapons. Most archaeological evidence of human habitation dates to the Mesolithic period during the early Holocene.
As of 2020, international teams are continuing a two-year investigation into the submerged landscape of Doggerland using new and traditional archaeo-geophysical techniques, computer simulation, and molecular biology. Evidence gathered allows study of past environments, ecological change, and human transition from hunter-gatherer to farming communities.

A map showing the hypothetical extent of Doggerland from now back to the Weichselian glaciation.
___________________________
Storegga Slide
The three Storegga Slides (Norwegian: Storeggaraset) are amongst the largest known submarine landslides. They occurred at the edge of Norway's continental shelf in the Norwegian Sea, approximately 6225–6170 BCE. The collapse involved an estimated 290 km (180 mi) length of coastal shelf, with a total volume of 3,500 km3 (840 cu mi) of debris, which caused a paleotsunami in the North Atlantic Ocean.

Map of Storegga Slides

The yellow numbers give the height of the tsunami wave as indicated by tsunamites studied by researchers.
https://en.wikipedia.org/wiki/Storegga_Slide
___________________________
A tsunami hit southwestern Norway 5,400 years ago
21 May 2025
A tidal wave between 8 and 10 metres high may have swept across Stone Age communities.
https://www.sciencenorway.no/stone-age-archaeology-culture/a-tsunami-hit-southwestern-norway-5400-years-ago/2509190
___________________________
Remembering the Tafjord Tsunami of 1934
March 15, 2021
Locals knew of an expanding crack
Underwater scans reveal that rockslides have not been uncommon over the years. Locals were certainly aware of the risks, but not so much of the potential consequences.
There is evidence that Fjøra locals knew about the mountain crack in Langhammeren as long ago as 1870.
The crack grew to more than a metre across. Increasing numbers of rockslides caused those fishing in the fjord to give the area a wide berth.
However, few outside Fjøra knew of the risks, including no government officials or even those in the next villages, Valldal and Tafjord.
23 died in Tafjord
When the waves struck Tafjord, they were still up to 17 metres high. One survivor who knew of the risk posed by the mountain crack had time to grab her young family and make for the highest point in the village. There she was joined by a neighbour and his young child.
All six who made it up to the rock survived, but they all lost family members who weren’t so lucky. Hardest hit was one family, who lost the husband, wife, and eight of the twelve children to the water.
17 died in Fjøra
Father along the fjord, Fjøra was hit by waves of up to 14 metres in height. They completely destroyed six houses, along with countless cars, boats, power lines and livestock.
17 people lost their lives. It could have been more, but many raced to safety into the hills surrounding the village, with water lapping around their feet.
Waves of up to five metres high hit the municipal centre, Sylte. While the loss of material possessions here was big (six cars, houses, workshops, boats etc), no human lives were lost. Three men spending the night in a boat all survived after being thrown many metres into a field.
https://www.lifeinnorway.net/tafjord-tsunami/
___________________________
Tsunamis on Norway's coasts
| Date | Cause | Max. wave | Fatalities | |
|---|---|---|---|---|
| 07/30/2011 | Landslide in Norway (Lysefjoren, Western Norway) | 1.5 m | 0 | |
| 03/19/1998 | Landslide in Norway (Western Norway) | 6 m | 0 | |
| 04/28/1994 | Landslide in Norway (Western Norway) | 4 m | 0 | |
| 02/21/1987 | Landslide in Norway (Western Norway) | 3 m | 0 | |
| 08/18/1983 | Landslide in Norway (Western Norway) | 7 m | 0 | |
| 05/07/1959 | Landslide in Norway (Northern Norway) | 4 m | 0 | |
| 10/06/1949 | Landslide in Norway (Northern Norway) | 2 m | 0 | |
| 09/13/1936 | Landslide in Norway (Loen) | 74 m | 73 | |
| 04/07/1934 | Landslide in Norway (Tafjord) | 62.30 m | 40 | |
| 04/23/1888 | Landslide in Norway (Mid-Norway) | 0 m | 1 |
https://www.worlddata.info/europe/norway/tsunamis.php
___________________________
A tsunami could wipe this Norwegian town off the map. Why isn’t everyone leaving?
October 20, 2023
Within decades or even months, a 300-foot wave could swallow this idyllic village. Here’s how they’re preparing
https://www.nationalgeographic.com/environment/article/akernes-rockslide-tsunami-norway
___________________________
Don't panic, humanity's 'doomsday' seed vault is probably still safe...
May 20, 2017
https://www.washingtonpost.com/news/energy-environment/wp/2017/05/20/dont-panic-humanitys-doomsday-seed-vault-is-probably-still-safe/
___________________________
Norway’s Global Seed Vault turns 15
February 27, 2023
https://www.arctictoday.com/norways-global-seed-vault-turns-15/
___________________________
Geological evidence for the 12,000 year cycle of climate disasters | Douglas Vogt
Jun 3, 2022
https://www.youtube.com/watch?v=WAlyvbt8Nlk
___________________________
ICE AGE is coming! THIS Is What Milanković Cycles Will Do To Earth...
Feb 13, 2023
https://www.youtube.com/watch?v=mIKALLvkppo
___________________________
Milankovitch cycles
https://en.wikipedia.org/wiki/Milankovitch_cycles
Milankovitch cycles describe the collective effects of changes in the Earth's movements on its climate over thousands of years. The term was coined and named after the Serbian geophysicist and astronomer Milutin Milanković. In the 1920s, he provided a more definitive and quantitative analysis than James Croll's earlier hypothesis that variations in eccentricity, axial tilt, and precession combined to result in cyclical variations in the intra-annual and latitudinal distribution of solar radiation at the Earth's surface, and that this orbital forcing strongly influenced the Earth's climatic patterns.
Earth movements
The Earth's rotation around its axis, and revolution around the Sun, evolve over time due to gravitational interactions with other bodies in the Solar System. The variations are complex, but a few cycles are dominant.[4]
The Earth's orbit varies between nearly circular and mildly elliptical (its eccentricity varies). When the orbit is more elongated, there is more variation in the distance between the Earth and the Sun, and in the amount of solar radiation, at different times in the year. In addition, the rotational tilt of the Earth (its obliquity) changes slightly. A greater tilt makes the seasons more extreme. Finally, the direction in the fixed stars pointed to by the Earth's axis changes (axial precession), while the Earth's elliptical orbit around the Sun rotates (apsidal precession). The combined effect of precession with eccentricity is that proximity to the Sun occurs during different astronomical seasons.[5]
Milankovitch studied changes in these movements of the Earth, which alter the amount and location of solar radiation reaching the Earth. This is known as solar forcing (an example of radiative forcing). Milankovitch emphasized the changes experienced at 65° north due to the great amount of land at that latitude. Land masses change surface temperature more quickly than oceans, mainly because convective mixing between shallow and deeper waters keeps the ocean surface relatively cooler. Similarly, the very large thermal inertia of the global ocean delays changes to Earth's average surface temperature when gradually driven by other forcing factors
Orbital eccentricity
The Earth's orbit approximates an ellipse. Eccentricity measures the departure of this ellipse from circularity. The shape of the Earth's orbit varies between nearly circular (theoretically the eccentricity can hit zero) and mildly elliptical (highest eccentricity was 0.0679 in the last 250 million years).[7] Its geometric or logarithmic mean is 0.0019. The major component of these variations occurs with a period of 405,000 years[8] (eccentricity variation of ±0.012). Other components have 95,000-year and 124,000-year cycles[8] (with a beat period of 400,000 years). They loosely combine into a 100,000-year cycle (variation of −0.03 to +0.02). The present eccentricity is 0.0167[8] and decreasing.
Eccentricity varies primarily due to the gravitational pull of Jupiter and Saturn. The semi-major axis of the orbital ellipse, however, remains unchanged; according to perturbation theory, which computes the evolution of the orbit, the semi-major axis is invariant. The orbital period (the length of a sidereal year) is also invariant, because according to Kepler's third law, it is determined by the semi-major axis.[9] Longer-term variations are caused by interactions involving the perihelia and nodes of the planets Mercury, Venus, Earth, Mars, and Jupiter.
Effect on temperature
The semi-major axis is a constant. Therefore, when Earth's orbit becomes more eccentric, the semi-minor axis shortens. This increases the magnitude of seasonal changes.[10]
The relative increase in solar irradiation at closest approach to the Sun (perihelion) compared to the irradiation at the furthest distance (aphelion) is slightly larger than four times the eccentricity. For Earth's current orbital eccentricity, incoming solar radiation varies by about 6.8%, while the distance from the Sun currently varies by only 3.4% (5.1 million km or 3.2 million mi or 0.034 au).[11]
Perihelion presently occurs around 3 January, while aphelion is around 4 July. When the orbit is at its most eccentric, the amount of solar radiation at perihelion will be about 23% more than at aphelion. However, the Earth's eccentricity is so small (at least at present) that the variation in solar irradiation is a minor factor in seasonal climate variation, compared to axial tilt and even compared to the relative ease of heating the larger land masses of the northern hemisphere.
Axial tilt (obliquity)
The angle of the Earth's axial tilt with respect to the orbital plane (the obliquity of the ecliptic) varies between 22.1° and 24.5°, over a cycle of about 41,000 years. The current tilt is 23.44°, roughly halfway between its extreme values. The tilt last reached its maximum in 8,700 BCE, which correlates with the beginning of the Holocene, the current geological epoch. It is now in the decreasing phase of its cycle, and will reach its minimum around the year 11,800 CE.[15] Increased tilt increases the amplitude of the seasonal cycle in insolation, providing more solar radiation in each hemisphere's summer and less in winter. However, these effects are not uniform everywhere on the Earth's surface. Increased tilt increases the total annual solar radiation at higher latitudes, and decreases the total closer to the equator.[15]
The current trend of decreasing tilt, by itself, will promote milder seasons (warmer winters and colder summers), as well as an overall cooling trend.[15] Because most of the planet's snow and ice lies at high latitude, decreasing tilt may encourage the termination of an interglacial period (and lead to an overall cooler climate) and the onset of a glacial period for two reasons: 1) there is less overall summer insolation, and 2) there is less insolation at higher latitudes (which melts less of the previous winter's snow and ice).[15]
Axial precession
Axial precession is the trend in the direction of the Earth's axis of rotation relative to the fixed stars, with a period of about 25,700 years. Also known as the precession of the equinoxes, this motion means that eventually Polaris will no longer be the north pole star. This precession is caused by the tidal forces exerted by the Sun and the Moon on the rotating Earth; both contribute roughly equally to this effect.
Currently, perihelion occurs during the southern hemisphere's summer. This means that solar radiation due to both the axial tilt inclining the southern hemisphere toward the Sun, and the Earth's proximity to the Sun, will reach maximum during the southern summer and reach minimum during the southern winter. These effects on heating are thus additive, which means that seasonal variation in irradiation of the southern hemisphere is more extreme. In the northern hemisphere, these two factors reach maximum at opposite times of the year: the north is tilted toward the Sun when the Earth is furthest from the Sun. The two effects work in opposite directions, resulting in less extreme variations in insolation.
In about 13,000 years, the north pole will be tilted toward the Sun when the Earth is at perihelion. Axial tilt and orbital eccentricity will both contribute their maximum increase in solar radiation during the northern hemisphere's summer. Axial precession will promote more extreme variation in irradiation of the northern hemisphere and less extreme variation in the south. When the Earth's axis is aligned such that aphelion and perihelion occur near the equinoxes, axial tilt will not be aligned with or against eccentricity.
Apsidal precession
The orbital ellipse itself precesses in space, in an irregular fashion, completing a full cycle in about 112,000 years relative to the fixed stars.[16] Apsidal precession occurs in the plane of the ecliptic and alters the orientation of the Earth's orbit relative to the ecliptic. This happens primarily as a result of interactions with Jupiter and Saturn. Smaller contributions are also made by the sun's oblateness and by the effects of general relativity that are well known for Mercury.[17]
Apsidal precession combines with the 25,700-year cycle of axial precession (see above) to vary the position in the year that the Earth reaches perihelion. Apsidal precession shortens this period to about 21,000 years, at present. According to a relatively old source (1965), the average value over the last 300,000 years was 23,000 years, varying between 20,800 and 29,000 years.[16]
As the orientation of Earth's orbit changes, each season will gradually start earlier in the year. Precession means the Earth's nonuniform motion (see above) will affect different seasons. Winter, for instance, will be in a different section of the orbit. When the Earth's apsides (extremes of distance from the sun) are aligned with the equinoxes, the length of spring and summer combined will equal that of autumn and winter. When they are aligned with the solstices, the difference in the length of these seasons will be greatest.[citation needed]

Planets orbiting the Sun follow elliptical (oval) orbits that rotate gradually over time (apsidal precession). The eccentricity of this ellipse, as well as the rate of precession, are exaggerated for visualization.
Orbital inclination
The inclination of Earth's orbit drifts up and down relative to its
present orbit. This three-dimensional movement is known as "precession
of the ecliptic" or "planetary precession". Earth's current inclination
relative to the invariable plane (the plane that represents the angular momentum of the Solar System—approximately the orbital plane of Jupiter) is 1.57°.[citation needed]
Milankovitch did not study planetary precession. It was discovered more
recently and measured, relative to Earth's orbit, to have a period of
about 70,000 years. When measured independently of Earth's orbit, but
relative to the invariable plane, however, precession has a period of
about 100,000 years. This period is very similar to the 100,000-year
eccentricity period. Both periods closely match the 100,000-year pattern
of glacial events.
100,000-year issue
Of all the orbital cycles, Milankovitch believed that obliquity had the greatest effect on climate, and that it did so by varying the summer insolation in northern high latitudes. Therefore, he deduced a 41,000-year period for ice ages.[25][26] However, subsequent research[23][27][28] has shown that ice age cycles of the Quaternary glaciation over the last million years have been at a period of 100,000 years, which matches the eccentricity cycle. Various explanations for this discrepancy have been proposed, including frequency modulation[29] or various feedbacks (from carbon dioxide, or ice sheet dynamics). Some models can reproduce the 100,000-year cycles as a result of non-linear interactions between small changes in the Earth's orbit and internal oscillations of the climate system.[30][31] In particular, the mechanism of the stochastic resonance was originally proposed in order to describe this interaction.[32][33]
Jung-Eun Lee of Brown University proposes that precession changes the amount of energy that Earth absorbs, because the southern hemisphere's greater ability to grow sea ice reflects more energy away from Earth. Moreover, Lee says, "Precession only matters when eccentricity is large. That's why we see a stronger 100,000-year pace than a 21,000-year pace."[34][35] Some others have argued that the length of the climate record is insufficient to establish a statistically significant relationship between climate and eccentricity variations.
Transition changes
From 1–3 million years ago, climate cycles matched the 41,000-year cycle in obliquity. After one million years ago, the Mid-Pleistocene Transition (MPT) occurred with a switch to the 100,000-year cycle matching eccentricity. The transition problem refers to the need to explain what changed one million years ago.[37] The MPT can now be reproduced in numerical simulations that include a decreasing trend in carbon dioxide and glacially induced removal of regolith.
Interpretation of unsplit peak variances
Even the well-dated climate records of the last million years do not exactly match the shape of the eccentricity curve. Eccentricity has component cycles of 95,000 and 125,000 years. Some researchers, however, say the records do not show these peaks, but only indicate a single cycle of 100,000 years.[39] The split between the two eccentricity components, however, is observed at least once in a drill core from the 500-million year-old Scandinavian Alum Shale.
Present and future conditions
Since orbital variations are predictable,[42] any model that relates orbital variations to climate can be run forward to predict future climate, with two caveats: the mechanism by which orbital forcing influences climate is not definitive; and non-orbital effects can be important (for example, the human impact on the environment principally increases greenhouse gases resulting in a warmer climate[43][44][45]).
An often-cited 1980 orbital model by Imbrie predicted "the long-term cooling trend that began some 6,000 years ago will continue for the next 23,000 years."[46] Another work[47] suggests that solar insolation at 65° N will reach a peak of 460 W·m−2 in around 6,500 years, before decreasing back to current levels (450 W·m−2)[48] in around 16,000 years. Earth's orbit will become less eccentric for about the next 100,000 years, so changes in this insolation will be dominated by changes in obliquity, and should not decline enough to permit a new glacial period in the next 50,000 years.[49][50]
Other celestial bodies
Mars
Since 1972, speculation sought a relationship between the formation of Mars' alternating bright and dark layers in the polar layered deposits, and the planet's orbital climate forcing. In 2002, Laska, Levard, and Mustard showed ice-layer radiance, as a function of depth, correlate with the insolation variations in summer at the Martian north pole, similar to palaeoclimate variations on Earth. They also showed Mars' precession had a period of about 51 kyr, obliquity had a period of about 120 kyr, and eccentricity had a period ranging between 95 and 99 kyr. In 2003, Head, Mustard, Kreslavsky, Milliken, and Marchant proposed Mars was in an interglacial period for the past 400 kyr, and in a glacial period between 400 and 2100 kyr, due to Mars' obliquity exceeding 30°. At this extreme obliquity, insolation is dominated by the regular periodicity of Mars' obliquity variation.[51][52] Fourier analysis of Mars' orbital elements, show an obliquity period of 128 kyr, and a precession index period of 73 kyr.[53][54]
Mars has no moon large enough to stabilize its obliquity, which has varied from 10 to 70 degrees. This would explain recent observations of its surface compared to evidence of different conditions in its past, such as the extent of its polar caps.[55][56]
Outer Solar system
Saturn's moon Titan has a cycle of approximately 60,000 years that could change the location of the methane lakes.[57] Neptune's moon Triton has a variation similar to Titan's, which could cause its solid nitrogen deposits to migrate over long time scales.[58]
Exoplanets
___________________________
Milankovitch (Orbital) Cycles and Their Role in Earth’s Climate
Feb 27, 2020
https://science.nasa.gov/science-research/earth-science/milankovitch-orbital-cycles-and-their-role-in-earths-climate/
___________________________
Last Glacial Period
The
Last Glacial Period (LGP), also known as the Last glacial cycle,
occurred from the end of the Last Interglacial to the beginning of the
Holocene, c. 115,000 – c. 11,700 years ago, and thus corresponds to most
of the timespan of the Late Pleistocene.
The LGP is part of a
larger sequence of glacial and interglacial periods known as the
Quaternary glaciation which started around 2,588,000 years ago and is
ongoing.[2] The glaciation and the current Quaternary Period both began
with the formation of the Arctic ice cap. The Antarctic ice sheet began
to form earlier, at about 34 Mya (million years ago), in the
mid-Cenozoic (Eocene–Oligocene extinction event), and the term Late
Cenozoic Ice Age is used to include this early phase with the current
glaciation.[3] The previous ice age within the Quaternary is the
Penultimate Glacial Period, which ended about 128,000 years ago, was
more severe than the Last Glacial Period in some areas such as Britain,
but less severe in others.
The last glacial period saw
alternating episodes of glacier advance and retreat with the Last
Glacial Maximum occurring between 26,000 and 20,000 years ago. While the
general pattern of cooling and glacier advance around the globe was
similar, local differences make it difficult to compare the details from
continent to continent (see picture of ice core data below for
differences). The most recent cooling, the Younger Dryas, began around
12,800 years ago and ended around 11,700 years ago, also marking the end
of the LGP and the Pleistocene epoch. It was followed by the Holocene,
the current geological epoch.
https://en.wikipedia.org/wiki/Last_Glacial_Period
___________________________
Earth’s tilt angle trigger for ending ice ages
March 13, 2020
https://cosmosmagazine.com/earth/earth-sciences/earths-tilt-angle-trigger-for-ending-ice-ages/
___________________________
Ice ages ended with a tilt of the planet
March 13th, 2020
https://www.futurity.org/ice-ages-end-earths-axis-2306002/
___________________________
Ice Ages Blamed on Tilted Earth
March 30, 2005
https://www.livescience.com/6937-ice-ages-blamed-tilted-earth.html
___________________________
Earth Tilted 31.5 Inches in Less Than 20 Years. Here’s What That Really Means for Us
Aug 23, 2023
https://www.popularmechanics.com/science/environment/a44882114/earths-tilt-explained/
___________________________
Earth Has Tilted 31.5 Inches. That Shouldn’t Happen.
Nov 15, 2025
Can we fix it back?
https://www.popularmechanics.com/science/environment/a69445743/why-earth-has-tilted-scientific-reason/?utm_source=firefox-newtab-en-us
___________________________
Axial precession
https://en.wikipedia.org/wiki/Axial_precession
___________________________
Axial tilt
https://en.wikipedia.org/wiki/Axial_tilt
___________________________
African humid period
https://en.wikipedia.org/wiki/African_humid_period
___________________________
Earth's Axis Tilted Dangerously 84 Million Years Ago, May Happen Again Says Study
Oct 21, 2021
Scientists have found that Earth had a dangerous tilt in its axis about 84 million years ago, which was reversed automatically
https://www.indiatimes.com/technology/science-and-future/earth-axis-tilt-84-million-years-ago-552180.html
___________________________
The Earth’s Axial Wobble: A Tiny Tilt With Big Impacts
April 30, 2025
https://discoverwildscience.com/the-earths-axial-wobble-a-tiny-tilt-with-big-impacts-1-301966/
___________________________
Earth's Tilt Has Shifted Over 30 Inches-What Does It Mean?
2024
___________________________
Record-low Antarctic sea ice can be explained and forecast months out by patterns in winds
December 6, 2024
https://www.washington.edu/news/2024/12/06/record-low-antarctic-sea-ice-can-be-explained-and-forecast-months-out-by-patterns-in-winds/
___________________________
Rapid declines in Antarctic sea ice whip up more storms
19/12/2024
https://oceanographicmagazine.com/news/antarctic-sea-ice-decline-generates-more-storms/
___________________________
Holocene variability in sea ice cover, primary production, and Pacific-Water inflow and climate change in the Chukchi and East Siberian Seas (Arctic Ocean)
2017
ABSTRACT
In this study, we present new detailed biomarker-based sea ice records from two sediment cores recovered in the Chukchi Sea and the East Siberian Sea. These new biomarker data may provide new insights on processes controlling recent and past sea ice changes. The biomarker proxy records show (i) minimum sea ice extent during the Early Holocene, (ii) a prominent Mid-Holocene short-term high-amplitude variability in sea ice, primary production and Pacific-Water inflow, and (iii) significantly increased sea ice extent during the last ca. 4.5k cal a BP. This Late Holocene trend in sea ice change in the Chukchi and East Siberian Seas seems to be contemporaneous with similar changes in sea ice extent recorded from other Arctic marginal seas. The main factors controlling the millennial variability in sea ice (and surface-water productivity) are probably changes in surface water and heat flow from the Pacific into the Arctic Ocean as well as the long-term decrease in summer insolation. The short-term centennial variability observed in the high-resolution Middle Holocene record is probably related to solar forcing. Our new data on Holocene sea ice variability may contribute to synoptic reconstructions of regional to global Holocene climate change based on terrestrial and marine archives.
___________________________
Ep093 Fossil-filled Blast Wind Muck Deposits in Alaska - Kosmographia The Randall Carlson Podcast
Feb 23, 2023
https://www.youtube.com/watch?v=GXgQkeSsNN8
___________________________
Ice export from the Laptev and East Siberian Sea derived from δ18O values
13 August 2015
The copyright line for this article was changed on 10 OCT 2015 after original online publication.
Abstract
Ice export from the vast Arctic Siberian shelf is calculated using δ18O values and salinity data for water samples collected during the International Siberian Shelf Study between August and September 2008 (ISSS-08). The samples represent a wide range of salinities and δ18O values due to river water inputs and sea ice removal. We estimate the fraction of water that has been removed as ice by interpreting observed δ18O values and salinities as a result of mixing between river water and sea water end-members as well as to fractional ice removal. This method does not assume an ice end-member of fixed composition, which is especially important when applied on samples with large differences in salinity. The results show that there is net transport of ice from both the Laptev and the Eastern Siberian Seas, and in total 3000 km3 of sea ice is exported from the shelf. The annual total export of ice from the entire region, calculated from the residence time of water on the shelf, is estimated to be 860 km3 yr−1. Thus, changes in ice production on the shelf may have great impact on sea ice export from the Arctic Ocean.
Key Points:
- Oxygen isotope data from samples collected across the East Siberian Arctic Shelf
- Fractions of water that had been removed as ice determined across the shelf
- Net export of ice from Laptev and East Siberian Sea
Introduction
An important element of the physical oceanography of the Arctic Ocean is the large freshwater input, which creates a strong halocline that separates the warm Atlantic water from the colder surface water. The halocline is a crucial component for maintaining a permanent ice cover in the Arctic Ocean, since it hampers the heat flux from the warm Atlantic Water. The major sources of freshwater input are river runoff, net precipitation, sea ice melt, and low-salinity water entering through the Bering Strait [Aagaard and Carmack, 1989]. The Arctic Ocean receives about 10% of the global river runoff, which, together with the inflow of Pacific waters and sea ice melt, creates the layer of cold fresh water above the Atlantic water. About 84,000 km3 of freshwater is stored in the Arctic Ocean [Serreze et al., 2006] and most of it is confined to the surface layer above 100 m. The freshwater in the Arctic Ocean has a residence time of 11 ± 1 year [Östlund, 1982] and leaves the Arctic Ocean as water through the Canadian Archipelago and Fram Strait. A substantial fraction is also exported as sea ice mainly through the Fram Strait [Aagaard and Carmack, 1989; Serreze et al., 2006].
The shallow seas on the arctic shelves have been recognized as important locations of sea ice formation [Macdonald, 2000], which increases the salinity of the water on the shelf and leads to brine formation. Brine formation on the shelf is an important source for the upper halocline waters of the Arctic Ocean [Aagaard et al., 1981; Cavalieri and Martin, 1994a; Melling and Lewis, 1982]. The general ice motion from the East Siberian Arctic Seas (ESAS), which includes the Laptev Sea and East Siberian Sea (ESS), is directed toward the Fram Strait by the Transpolar Drift [Pavlov et al., 2004; Pfirman et al., 1997].
Freshwater input from rivers lowers the shelf water salinity and might therefore promote ice formation. One important area for sea ice production on the shelf areas are the flaw leads [Bareiss and Görgen, 2005; Bauch et al., 2011; Cavalieri and Martin, 1994b; Dethleff et al., 1998], which are the boundaries between land fast ice and drift ice where recurring ice free zones appear. The Laptev Sea is considered a major source for sea ice production whereas the East Siberian Sea is thought to be less important or even a net importer of sea ice [Carmack, 2000; Macdonald, 2000].
Oxygen isotopes in water can be used together with salinity to quantify ice formation and removal. Sea ice preferentially incorporates heavier O isotopes, and sea water that has been affected by sea ice removal will have a low δ18O values, as well as a higher salinity due to the freshwater removal. The stable oxygen isotope values in surface marine waters vary by several permil, particularly in coastal marine waters at high latitudes. While in these areas river waters contribute isotopically light oxygen into the ocean, melting and freezing of ice also contribute to variable isotopic values in the surface waters. In contrast, isotopic values of deep ocean waters are nearly constant, varying only by about 1‰. The difference in δ18O values of the water sources, together with salinity, have been used in the Arctic Ocean to distinguish the inputs of fresh water from different sources and from ice melt, as well as removal due to sea ice formation [Östlund and Hut, 1984]. The δ18O values have also been used, together with tritium and helium, to estimate the residence time of river runoff from the Siberian shelves to 3.5 ± 2 years [Schlosser et al., 1994]. Other studies have used oxygen isotopes to calculate ice export from the Arctic [Bauch et al., 2011; Ekwurzel et al., 2001; Schlosser et al., 2002; Östlund, 1994] and to estimate ice removal and brine formation on the shelves [Bauch et al., 2013; Bauch et al., 2010; Macdonald et al., 1995].
In this study, δ18O values and salinity data for samples of waters from across the Laptev Sea and the East Siberian Sea were used to calculate the fraction of water removed from the shelf as ice from waters with a wide range of salinities. This demonstrates that there is net transport of sea ice from East Siberian Arctic Seas. Also, both the total and the annual amounts of sea ice exported from these shelf areas are estimated.
https://agupubs.onlinelibrary.wiley.com/doi/full/10.1002/2015JC010866
___________________________
How many ice ages were there in the Cenozoic Era?
April 14, 2022
What were the 4 ice ages?
Scientists have recorded five significant ice ages throughout the Earth’s history: the Huronian (2.4-2.1 billion years ago), Cryogenian (850-635 million years ago), Andean-Saharan (460-430 mya), Karoo (360-260 mya) and Quaternary (2.6 mya-present).
How many ice ages were there?
five major
At least five major ice ages have occurred throughout Earth’s history: the earliest was over 2 billion years ago, and the most recent one began approximately 3 million years ago and continues today (yes, we live in an ice age!). Currently, we are in a warm interglacial that began about 11,000 years ago.
What era had the most ice ages?
The Quaternary Glaciation / Quaternary Ice Age started about 2.58 million years ago at the beginning of the Quaternary Period when the spread of ice sheets in the Northern Hemisphere began.
When were the last 3 ice ages?
Climate history over the past 500 million years, with the last three major ice ages indicated, Andean-Saharan (450 Ma), Karoo (300 Ma) and Late Cenozoic. A less severe cold period or ice age is shown during the Jurassic-Cretaceous (150 Ma).
https://geoscience.blog/how-many-ice-ages-were-there-in-the-cenozoic-era/
___________________________
Earth currently experiencing a sixth mass extinction, according to scientists | 60 Minutes
Jan 1, 2023
https://www.youtube.com/watch?v=6TqhcZsxrPA
___________________________
Yellowknife, Canada: Diamonds in the Rough
2007
https://www.gonomad.com/1883-yellowknife-canada-diamonds-in-the-rough
___________________________
Ekati Diamond Mine
The Ekati Diamond Mine, often simply called Ekati, is Canada's first surface and underground diamond mine[1] and is owned by Burgundy Diamond Mines. It is located 310 km (190 mi) north-east of Yellowknife,[2] Northwest Territories, and about 200 km (120 mi) south of the Arctic Circle, near Lac de Gras. Until 2014, Ekati was a joint venture between Dominion Diamond Mines (80%), Chuck Fipke, and Stewart Blusson, the two geologists who discovered kimberlite pipes north of Lac de Gras.[3] Fipke and Blusson each held 10% stake in the mine, until Fipke sold his share to Dominion.[4][1] In 2021, Arctic Canadian Diamond Company Ltd. acquired the Ekati Diamond Mine with associated assets and liabilities from Dominion Diamond Mines. In July 2023, Burgundy Diamond Mines purchased full control of Arctic Canadian Diamond Company.
Mining and marketing
Between 1998 and 2009, the mine has produced 40,000,000 carats (8,000 kg; 18,000 lb) of diamonds out of six open pits.[1] As the high grade ore close to surface was depleted, development was completed to access the ore utilizing underground methods. The mine's current annual production is estimated to be approximately 7,500,000 carats (1,500 kg; 3,310 lb) of diamonds.[9]
There are numerous options to extend the mine life at Ekati through 2028 including continuation of Misery underground at depth, evaluation alternatives for expansion at Point Lake, transforming Sable to an underground operation following open pit completion, exploring Fox as an underground opportunity and maximizing resources in the Fox stockpile. In addition, the underwater remote mining provides additional opportunities to extract diamonds through kimberlite pipes with a trial that will start at Lynx pit in 2025.
https://en.wikipedia.org/wiki/Ekati_Diamond_Mine
___________________________
Arsenic Levels in Lakes around Yellowknife
2017
1. Where does the arsenic in the Yellowknife area come from?
Arsenic is found at naturally low levels in the water of many NWT rivers and lakes.
However, past gold mining activities have resulted in additional arsenic being released
into the immediate environment surrounding the city.
2. Are these arsenic levels dangerous?
Trace amounts of arsenic detected in the Yellowknife River and Yellowknife Bay, as well
as in a majority of the lakes tested (green dots as shown on the public health advisory
map) are below Health Canada’s Guidelines for Canadian Drinking Water Quality, and
are similar to levels found in water supplies across Canada. Several lakes have arsenic
levels above the drinking water guidelines but are not high enough to pose a human
health risk for recreational activities in the lake (yellow dots).
This public health advisory is meant to address concerns about the fewer number of
lakes that have elevated arsenic levels (orange, red and purple dots i.e., over 52 parts
per billion or ‘ppb’) that require some precautions, particularly for vulnerable
populations such as pregnant women and very young children.
This public health advisory provides advice based on open water (i.e. not winter/under
ice) dissolved arsenic levels, unless winter values are the only information available. In
smaller water bodies, ice freezing may increase the concentration of arsenic in the
underlying water; however there is little to no exposure to the public from these small,
frozen lakes. In larger lakes, we have not seen significant increases in arsenic levels
when the ice freezes.
6. Can playing on the shorelines cause the release of arsenic into the water?
At this time, based on available information, the CPHO advises, occasional and brief
period wading would not release sufficient quantities of arsenic that may be contained
in sediment to create a health hazard. However, toddlers and young children should
always be supervised around shorelines so that they do not inadvertently ingest dirt or
mud, as well as for water safety reasons.
Public health advice will be updated as new data generated from research or
monitoring studies is assessed by the CPHO.
___________________________
Welcome to Yellowknife, the Diamond Capital of North America
___________________________
Uranium City: Saskatchewan’s last frontier
Sep 13, 2019
https://www.sasktoday.ca/north/opinion/uranium-city-saskatchewans-last-frontier-4138211
___________________________
Holocene lake-level recession, permafrost aggradation and lithalsa formation in the Yellowknife area, Great Slave Lowland
September 2015
Abstract and Figures
___________________________
Great Slave Lowland: The Legacy of Glacial Lake McConnell
02 December 2016
Abstract
The Great Slave Lowland of the Taiga Shield is an 11,000 km2 low-elevation granitic bedrock plain along the north shore of Great Slave Lake, Northwest Territories. It is characterized by a mosaic of coniferous and deciduous forest cover, wetlands, sparsely vegetated bedrock outcrops, and peatlands. The region was glaciated until about 13,000 years ago and then inundated by Glacial Lake McConnell and by ancestral Great Slave Lake, which gradually declined towards the present lake elevation. Consequently, fine-grained glacilacustrine and nearshore lacustrine sediments are broadly distributed across the region. Permafrost is widespread within forest-covered sediments and peatlands, but is not sustained beneath bedrock outcrops, leading to an extensive, but discontinuous, permafrost distribution. Lithalsas, which are permafrost mounds up to 8 m in height and several hundred metres in length, are also abundant. These form by ice segregation within mineral soil, as permafrost aggrades into the fine-grained sediments following lake level recession. Lithalsas are most common within the first few tens of metres above the present level of Great Slave Lake, indicating that many are late Holocene in age and some <1000 years. These elevated surfaces favour the establishment of deciduous forests with thin organic ground cover and with mean annual ground temperatures typically between −0.5 and −1.5 °C. With annual mean air temperatures consistently warming since the 1940s, this terrain is vulnerable to thawing and subsidence, with impacts on the ecology, hydrology, and population of the region.
https://link.springer.com/chapter/10.1007/978-3-319-44595-3_5
___________________________
Diavik Diamond Mine
The Diavik Diamond Mine is a diamond mine in the North Slave Region of the Northwest Territories, Canada, about 300 km (190 mi) northeast of Yellowknife.
History
The area was surveyed in 1992, and construction began in 2001, with production commencing in January 2003. In 2006, the ice road from Yellowknife to the Diavik mine and neighbouring mines froze late and thawed early.[7] The Diavik mine could not truck in all the supplies needed for the rest of 2006 before the road closed and arrangements had to be made to bring the remainder of the supplies in by air. Subsequent annual ice road resupply has been completed as planned.
On July 5, 2007, a consortium of seven mining companies, including Rio Tinto, announced they are sponsoring environmental impact studies to construct a deep-water port in Bathurst Inlet.[8][9] Their plans include building a 211 km (131 mi) road connecting the port to their mines. The port would serve vessels of up to 25,000 tonnes.
In March 2010, underground mining began at the mine. The transition from open pit to underground mining was completed in September 2012.[10]
In September 2012, Diavik completed the construction of the Northwest Territories' first large-scale wind farm. The four-turbine, 9.2-megawatt facility provides 11 per cent (2015) of the Diavik mine's annual power needs and operates at 98% availability. Diesel fuel offset is about five million litres (1,300,000 US gal) per year. Diavik operates the world's largest wind-diesel hybrid power facility at its remote off-grid mine. The wind farm, operational down to −40 °C (−40 °F), sets a new benchmark in cold-climate renewable energy.[11][12]
In 2015, $US350 million was announced to fund the exploitation of a fourth kimberlite pipe ore body, known as A21. Construction of the A21 rockfill dike (like the other three ore bodies, the A21 kimberlite pipe is under the shallow waters of Lac de Gras) is expected to be complete in 2018, with the first diamonds expected in the fall of that year. To build the dike, Diavik will use the same technologies used to build the A154 and A418 dikes.[citation needed][13]
In December 2015, Rio Tinto announced the discovery of the 187.7-carat Diavik Foxfire diamond, one of Canada's largest rough gem quality diamonds ever produced.[14] The Diavik Foxfire was bestowed an indigenous name, Noi?eh Kwe, which means caribou crossing stone in the Tlicho First Nation language.[15]
In October 2018, a yellow diamond of 552 carats was found at the mine. This is the largest diamond ever found in North America.
https://en.wikipedia.org/wiki/Diavik_Diamond_Mine
___________________________
The Battle Over 'Pebble Mine' in Alaska's Bristol Bay Region (full documentary) | FRONTLINE
Feb 7, 2023
https://www.youtube.com/watch?v=4NNlVrcthXI
___________________________
Canada Basin
The Canada Basin is a deep oceanic basin within the Arctic Ocean. It is part of the Amerasian Basin and lies off the coast of Alaska and northwest Canada between the Chukchi Plateau north of Alaska and the Alpha Ridge north of Ellesmere Island.
https://en.wikipedia.org/wiki/Canada_Basin
___________________________
Canada Basin, Arctic Ocean: Evidence against a rotational origin
26 July 2010
https://agupubs.onlinelibrary.wiley.com/doi/abs/10.1029/97TC00432
___________________________
Evolution of the Deep Water in the Canadian Basin in the Arctic Ocean
01 May 2006
https://journals.ametsoc.org/view/journals/phoc/36/5/jpo2906.1.xml
___________________________
Winter sea-ice melt in the Canada Basin, Arctic Ocean
15 February 2012
Abstract
[1] Recent warming and freshening of the Canada Basin has led to the year-round storage of solar radiation as the near-surface temperature maximum (NSTM). Using year-round ocean (from ice tethered profilers and autonomous ocean flux buoys), sea-ice (from ice mass balance buoys), and atmosphere (from NCEP/NCAR reanalysis) data from 2005–2010, we find that heat from the NSTM is entrained into the surface mixed layer (SML) during winter. Entrainment can only occur when the base of the SML reaches the top of the NSTM. If this condition is met, the surface forcing and stratification together determine whether the SML deepens into the NSTM. Heat transfer occurs by diffusion or by the erosion of the summer halocline. The average temperature of the SML warmed by as much as 0.06°C during storm events. Solar radiation began warming the SML about 1 month early during the winter of 2007–2008 and this can be explained by thin sea ice.
https://agupubs.onlinelibrary.wiley.com/doi/full/10.1029/2011GL050219
___________________________
Geological controls on the present temperature field of the western Sverdrup Basin, Canadian Arctic Archipelago
20 January 2017
Analysis of current temperature data in the Canadian Arctic Archipelago results in the recognition of two major thermal regimes. High temperature regions are observed where salt diapirs and salt cored anticlines are present. Low temperature fields are observed along the western and southern basin margins and around Cornwall‐Amund Ringnes islands, where regional Mesozoic aquifers are exposed to surface, connected to basin boundary faults, or regional unconformities. Meteoric and Holocene sub‐glacial water recharge are inferred to be responsible for the low geothermal regime and low formation water salinity. Neither exhumation associated with the Eocene “Eurekan” orogeny nor volcanic intrusion associated with opening of Amerasia Basin in late Jurassic‐early Cretaceous have been interpreted to be a significant influence on the present day temperature field, although thermal indicators show evidence of elevated thermal alteration of organic matter pointing to earlier, but now dissipated, thermal anomalies.
https://www.earthdoc.org/content/journals/10.1111/bre.12232
___________________________
Alkaline picritic volcanism on northern Ellesmere Island associated with initial rifting of the Sverdrup Basin, Canadian Arctic
21 March 2023
Abstract
https://cdnsciencepub.com/doi/10.1139/cjes-2022-0106
___________________________
Mesozoic rift to post-rift tectonostratigraphy of the Sverdrup Basin, Canadian Arctic
May 2016
https://www.researchgate.net/publication/302982284_Mesozoic_rift_to_post-rift_tectonostratigraphy_of_the_Sverdrup_Basin_Canadian_Arctic
___________________________
Geological evolution and hydrocarbon potential of the salt-cored Hoodoo Dome, Sverdrup Basin, Arctic Canada
2015
https://www.sciencedirect.com/science/article/abs/pii/S026481721530146X
___________________________
Middle Jurassic to Lower Cretaceous paleoclimate of Sverdrup Basin, Canadian Arctic Archipelago inferred from the palynostratigraphy
2013
Highlights
Introduction
https://www.sciencedirect.com/science/article/abs/pii/S0264817213000068
___________________________
Gas hydrate contribution to Late Permian global warming
2014
negative C-isotopic shift during the late Middle Permian. Deep marine hydrates would have remained stable until LPE time. Rapid warming of deep marine waters during this time could have triggered destabilization of this reservoir, however given the configuration of one super continent, Pangea, hydrate bearing continental slopes would have been less extensive than modern day. This suggests that any potential gas hydrate release would have had only a minor contributing impact to the runaway greenhouse during the Latest Permian extinction.
https://www.sciencedirect.com/science/article/abs/pii/S0012821X14001460
___________________________
Kinematic model of the opening of the Canadian Basin, Arctic Ocean
28 August 2013
https://link.springer.com/article/10.1134/S0001437013040127
___________________________
Arctic Ocean Circulation: Going Around At the Top Of the World
2013
Perennial sea-ice, sluggish flows, deep eddies, ocean-wide features driven by molecular processes. What is known (and unknown) about Arctic ocean circulation today?
Circulation of Pacific Waters (PW)
PW (Figure 3) are found on the Canada Basin side of the Mendeleev Ridge, and episodically also in the Makarov Basin and up to the Lomonosov Ridge (McLaughlin et al. 1996; Swift et al. 2005). It is probable, however, that their location reflects the changing position of the Transpolar Drift of sea-ice (which takes ice from Russia to the Fram Strait (e.g., Rigor et al. 2002)) rather than the bottom topography. Historic hydrographic data (Steele et al. 2004) suggest PSW distribution mirrors the state of the Arctic Oscillation (AO, an index of the primary mode of variability of northern hemisphere sea-level pressure (Thompson and Wallace 1998)). Under high AO conditions, for example, the Transpolar Drift sweeps more of the western Arctic, resulting in a smaller Beaufort Gyre and less influence of PW in the eastern Arctic. This variability may also explain changes in the proportions of PW exiting the Arctic via the Canadian Archipelago and the Fram Strait (Falck et al. 2005, Jones et al. 2003).
___________________________
Assessing
the Contributions of Atmospheric/Meteoric Water and Sea Ice Meltwater
and Their Influences on Geochemical Properties in Estuaries of the
Canadian Arctic Archipelago
1 July 2019
Salinity
and stable oxygen isotope (δ18O) data collected from eight estuaries
distributed throughout the Canadian Arctic Archipelago were used to
apportion contributions from local meteoric water (MW) and sea ice
meltwater (SIM) sources during July and August of 2015 and 2016. The
size of the rivers flowing into the estuaries varied by an order of
magnitude (in terms of mean annual discharge); however, the inventories
of MW were always greater or equal to SIM inventories, indicating that
MW was the dominant freshwater source. Residence times of MW generally
ranged between 1 and 8 days, with longer times (> 20 days) computed
for estuaries in the Somerset Island and Baffin Island regions. Shorter
residence times indicate, but do not confirm, that river waters move
through the estuaries and proceed offshore relatively quickly. Despite
this swift transport, nonconservative behaviors were observed for barium
and dissolved organic carbon (DOC). These behaviors were identified via
examination of total alkalinity, barium, and DOC concentrations that
remained after accounting for contributions from MW and seawater .
Remaining concentrations/anomalies that deviated significantly from a
linear correlation with SIM were attributed to nonconservative behaviors
(e.g., desorption of barium from river-borne particles,
remineralization of DOC) or inaccurate assignments of endmember values
in the water type analyses. Thus, these anomalies offer a means to
better inform water type analyses in the correct assignment of endmember
properties that best represent the environment studied.
___________________________
Makarov Basin
Submarine basin, Arctic Ocean
The Makarov Basin lies between the Alpha Cordillera and the Lomonosov Ridge, and its floor is at a depth of 13,200 feet. The largest subbasin of the Arctic Ocean is the Canada Basin, which extends approximately 700 miles from the Beaufort Shelf to the Alpha Cordillera.…
https://www.britannica.com/place/Makarov-Basin
___________________________
Arctic Ocean Seafloor Features Map

https://geology.com/articles/arctic-ocean-features/
___________________________
Jurassic and cretaceous foreland basin deposits of the Russian arctic: Separated by birth of the makarov basin?
2008
https://experts.arizona.edu/en/publications/jurassic-and-cretaceous-foreland-basin-deposits-of-the-russian-ar
___________________________
Crustal structure of the Makarov Basin, Arctic Ocean determined by seismic refraction
30 April 1999
https://www.semanticscholar.org/paper/Crustal-structure-of-the-Makarov-Basin%2C-Arctic-by-Sorokin-Zamansky/a868bd3ecd727928543915e6d86e7b706d94c77d
___________________________
Changes in Arctic Halocline Waters Along the East Siberian Slope and in the Makarov Basin From 2007 to 2020
12 August 2022
https://agupubs.onlinelibrary.wiley.com/doi/10.1029/2021JC018082
___________________________
Changes in Freshwater Distribution and Pathways in the Arctic Ocean Since 2007 in the Mercator Ocean Global Operational System
27 May 2022
Abstract
Low-salinity waters in the upper Arctic Ocean, referred to as “freshwaters”, are cold and play a major role in isolating the sea ice cover from the heat stored in the salty Atlantic Waters (AW) underneath. We examined changes in Arctic freshwater distribution and circulation since 2007 using the 1/12° global Mercator Ocean operational model. We first evaluated model simulations over the upper water column in the Arctic Ocean, using nearly 20,000 independent in situ temperature-salinity profiles over the 2007–2020 period. Simulated hydrographic properties and water mass distributions were in good agreement with observations. Comparison with long-term mooring data in the Bering Strait and Beaufort Gyre highlighted the model's capabilities for reproducing the interannual evolution of Pacific Water properties. Taking advantage of the good performance of the model, we examined the interannual evolution of the freshwater distribution and circulation over 2007–2020. The Beaufort Gyre is the major freshwater reservoir across the full Arctic Ocean. After 2012 the gyre extended northward and increased the freshwater content in the Makarov Basin, near the North Pole. Coincidentally, the freshwater content decreased along the East Siberian slope, along with the AW shoaling, and the Transpolar Drift moved from the Lomonosov Ridge to align with the Mendeleev Ridge. We found that these changes in freshwater distribution were followed in 2015 by a marked change in the export of freshwater from the Arctic Ocean with a reduction in Fram Strait (−30%) and an increase in the western Canadian Archipelago (+16%).
https://agupubs.onlinelibrary.wiley.com/doi/10.1029/2021JC017701
___________________________
A sedimentary record from the Makarov Basin, Arctic Ocean, reveals changing middle to Late Pleistocene glaciation patterns
1 October 2021
https://www.semanticscholar.org/paper/A-sedimentary-record-from-the-Makarov-Basin%2C-Arctic-Xiao-Polyak/0aa2c37989b1c011ed43ff09dda19fdccac6681f
___________________________
A comment about "A sedimentary record from the Makarov Basin, Arctic Ocean, reveals changing middle to Late Pleistocene glaciation patterns" (Quat. Sci. Rev., 270 (2021), p. 107176) from W. Xiao, L. Polyak, R. Wang, C. Not, L. Dong, Y. Liu, T. Ma, T. Zhang
2021
https://www.sciencedirect.com/science/article/abs/pii/S0277379121004467
___________________________
Climate Change Impacts to the Arctic Ocean Revealed From High Resolution GEOTRACES 210Po-210Pb-226Ra Disequilibria Studies
06 April 2022
Abstract
Climate change is transforming the Arctic Ocean in unprecedented ways which can be most directly observed in the systematic decline in seasonal ice coverage. From the collection and analysis of particulate and dissolved activities of 210Po and 210Pb from four deepwater superstations, as a part of the US Arctic GEOTRACES cruise during 2015, and in conjunction with previously published data, the temporal and spatial variations in their activities, inventories and residence times are evaluated. The results show that the partitioning of particulate and dissolved phases has changed significantly in the 8 years between 2007 and 2015, while the total 210Po and 210Pb activities have remained relatively unchanged. Observed total 210Po/210Pb activity ratio was less than unity in all deepwater stations, implying disequilibria in the entire water column. From the distribution of total 210Po and 210Pb in the upper 500 m of all major Arctic Basins, the derived scavenging efficiencies decrease as per the following sequence: Makarov Basin > Gakkel Bridge > Canada Basin Nansen Basin ∼ Amundsen Basin > Alpha Ridge, which is the reverse order of the calculated residence times of 210PoT. The scavenging intensities differ between the fully ice-covered, partially ice-covered, and no ice-covered stations, as observed from the differences in the average activities of 210Po and 210Pb. The average settling velocity of particulate matter based on the 210Pb activity is similar to the published values based on 230Th, indicating removal mechanism(s) of Th and Pb is (are) similar.
Key Points
-
The partitioning of Po-210 and Pb-210 between dissolved and particulate phases has changed significantly between 2007 and 2015 in the Arctic
-
Intensity of scavenging Po and Pb follows sequence: Makarov Basin > Gakkel Bridge > Canada Basin Nansen Basin ∼ Amundsen Basin > Alpha Ridge
-
The scavenging intensities of Po and Pb differ between the fully ice-covered, partially ice-covered, and no ice-covered stations
Plain Language Summary
The Arctic Ocean is undergoing major environmental change, as observed from the decrease in the areal extent and duration of the ice cover. To document such changes, we collected water samples from the deep Arctic Ocean and analyzed for a set of elemental and/or isotope concentrations and compared with earlier published data. Polonium-210 (210Po) and Lead-210 (210Pb) are two radioactive isotopes that occur naturally in the environment which are derived from the decay of Radium-226 via Radon-222. From the measurements of 210Po and 210Pb in the particulate (solid material retained on a finite pore-size filter) and dissolved phases collected during 2015 GEOTRACES Cruise in the Arctic Ocean, we show the fractional amount of these nuclides in the particulate and dissolved phases have changed between 2007 and 2015. From the average activities of 210Po and 210Pb in the upper 500 m of all major Arctic Basins, the intensity of removal of these nuclides exhibits the following sequence: Makarov Basin > Gakkel Bridge > Canada Basin Nansen Basin ∼ Amundsen Basin > Alpha Ridge. From the differences in the concentrations of these nuclides, we report differences in the scavenging intensities between the fully ice-covered, partially ice-covered, and no ice-covered stations.
https://agupubs.onlinelibrary.wiley.com/doi/10.1029/2021JC018359
___________________________
Amundsen Basin
The Amundsen Basin, with depths up to 4.4 km (2.7 mi), is the deepest abyssal plain in the Arctic Ocean, and contains the geographic North Pole. The Amundsen Basin is embraced by the Lomonosov Ridge (from 81°N 140°E to 80°N 40°W) and the Gakkel Ridge (from 81°N 120°E to 85°N 10°E). It is named after the polar researcher Roald Amundsen. Together with the Nansen Basin, the Amundsen Basin is often summarized as Eurasian Basin.
The Russian-American cooperation Nansen and Amundsen Basin Observational System (NABOS) aims "to provide a quantitative observationally based assessment of circulation, water mass transformations, and transformation mechanisms in the Eurasian and Canadian Basins of the Arctic Ocean".
https://en.wikipedia.org/wiki/Amundsen_Basin
___________________________
Depositional Evolution of the Western Amundsen Basin, Arctic Ocean: Paleoceanographic and Tectonic Implications
05 October 2018
Abstract
A new stratigraphic model and estimated sedimentation rates of the western Amundsen Basin, Arctic Ocean, are presented based on multichannel seismic reflection data, seismic refraction data, magnetic data, and integrated with the sedimentary sequence from the central Arctic Ocean, obtained during the Arctic Coring Expedition. This places new constraints on the postbreakup Cenozoic depositional history of the basin, the adjacent Lomonosov Ridge, and improves the understanding of the tectonic, climatic, and oceanographic conditions in the central Arctic region. Four distinct phases of basin development are proposed. During the Paleocene-mid-Oligocene, high sedimentation rates are linked to terrestrial input and increased pelagic deposition in a restricted basin. Deposition of sedimentary wedges and mass transport into marginal depocenters reflect a period of tectonic instability linked to compression associated with the Eurekan Orogeny in the Arctic. During the late Oligocene-early Miocene, widespread passive infill associated with hemipelagic deposition reflects a phase of limited tectonism, most likely in a freshwater estuarine setting. During the middle Miocene, mounded sedimentary buildups along the Lomonosov Ridge suggest the onset of geostrophic bottom currents that likely formed in response to a deepening and widening of the Fram Strait beginning around 18 Ma. In contrast, the Plio-Pleistocene stage is characterized by erosional features such as scarps and channels adjacent to levee accumulations, indicative of a change to a higher-energy environment. These deposits are suggested to be partly associated with dense shelf water-mass plumes driven by supercooling and brine formation over the northern Greenland continental shelf.
Key Points
- New multichannel seismic reflection data constrain the Cenozoic depositional history of the Amundsen Basin in the Arctic Ocean
- Four key development stages explain the basin evolution based on facies interpretation and estimated sedimentation rates
- Plio-Pleistocene cascading plumes, possibly from brine formation, affected the North Greenland shelf and influenced deep circulation
https://agupubs.onlinelibrary.wiley.com/doi/10.1029/2018PA003414
___________________________
Internal Wave Frequency Spectrum in the Amundsen Basin of the Arctic Ocean Inferred from Ice Tethered CTD Instruments
29 March 2018
https://link.springer.com/chapter/10.1007/978-3-319-71934-4_37
___________________________
Plate Tectonic Evolution of the Amerasia Basin, Arctic Ocean
https://tectonics.stanford.edu/plate-tectonic-evolution-amerasia-basin-arctic-ocean
___________________________
Model of Formation of the Sedimentary System of the Eurasian Basin, the Arctic Ocean, as a Basis for Reconstructing Its Tectonic Evolution
26 November 2021
https://link.springer.com/article/10.1134/S001685212105006X
___________________________
Thermohaline staircases in the Amundsen Basin: Possible disruption by shear and mixing
25 August 2017
Abstract
As part of the 2013 and 2014 North Pole Environmental Observatories (NPEO) in the Amundsen Basin of the Arctic Ocean, two similar temperature microstructure experiments were performed with different results. In 2013, vertical fluxes were through a thermohaline staircase, and in 2014, the thermohaline staircase was largely absent. Here we investigate the reasons for this difference. The 2013 data set was characterized by an extensive thermohaline staircase, indicative of the diffusive convective type of double diffusion (DC), from 120 to 250 m depths. The staircase was absent above 200 m in 2014, even though analysis of density ratio, Rρ, still shows high susceptibility to DDC. In the depth range of interest, survey-averaged Rρ = 3.8 in 2013 and Rρ = 3.6 in 2014, indicating that the temperature-salinity structure in the pycnocline was not the cause of the lack of a staircase in 2014. We propose that exceptionally weak turbulent mixing, even for the typically quiescent Arctic Ocean, allowed formation of the staircase in 2013. Average thermal diffusivity, KT, between 50 and 120 m is elevated in 2014, 2 × 10⁻⁵ m2 s−1, compared to 2013, 1 × 10⁻⁶ m2 s−1. However, vertical Atlantic Water (AW) DC heat fluxes in 2013 are remarkably consistent with turbulent heat fluxes in 2014. Similar data sets collected in 2007 and 2008 both resemble 2014, showing consistently higher mixing values compared to 2013. The suppression of turbulence during NPEO 2013 resulted from increased near-surface stratification, possibly caused by a different large-scale circulation pattern that year.
https://agupubs.onlinelibrary.wiley.com/doi/full/10.1002/2017JC012993
___________________________
Russia conducts research into the depths of the Arctic Ocean
20 march 2023
https://www.rough-polished.com/en/arctic/130151.html
___________________________
Will low primary production rates in the Amundsen Basin (Arctic Ocean) remain low in a future ice-free setting, and what governs this production?
2019
https://www.sciencedirect.com/science/article/abs/pii/S0924796319304245
___________________________
Sedimentary structure of the Nansen and Amundsen basins, Arctic Ocean
January 2004
Abstract and Figures
https://www.researchgate.net/publication/238500967_Sedimentary_structure_of_the_Nansen_and_Amundsen_basins_Arctic_Ocean
___________________________
Greater role for Atlantic inflows on sea-ice loss in the Eurasian Basin of the Arctic Ocean
6 Apr 2017
Losing its character
Abstract
https://www.science.org/doi/10.1126/science.aai8204
___________________________
SIDEBAR • Nansen and Amundsen Basins Observational System (NABOS): Contributing to Understanding Changes in the Arctic
March 24, 2022
On September 2, 2002, the Nansen and Amundsen Basins Observational System (NABOS) program deployed its first mooring in the Eastern Eurasian Basin (EEB) of the Arctic Ocean. Since then, NABOS moorings, complemented by repeat multidisciplinary shipborne surveys and Lagrangian drifters (Figure 1), have provided a unique data set in an area of traditionally sparse observations. A series of moorings placed at several strategically important locations continues to be the program’s primary monitoring tool for capturing major near-slope mass, heat, and salt transports and their links to lower-latitude processes. These data will aid in quantifying shelf-basin interactions, documenting water mass transformations, and understanding key mechanisms that lead to the Arctic Ocean’s variability. International collaboration, particularly among the eight Arctic countries, has been an essential part of this observational strategy, with researchers from 18 counties taking part in NABOS cruises since 2002.
This observational strategy has paid off well. For example, data collected from the NABOS mooring in 2004 showed a strong warming signal in the warm (temperature >0°C) and salty waters of Atlantic origin (Atlantic Water, AW), suggesting that the eastern Arctic Ocean is in transition toward a new, warmer state (Polyakov et al., 2005). Moreover, NABOS mooring data collected in 2006 in the vicinity of Svalbard at ~30°E showed AW temperature anomalies unprecedented in the history of regional instrumental observations (Ivanov et al., 2009). Concerted efforts of the international team of scientists from the United States, Germany, Russia, and Norway provided evidence that this anomaly took about 1.5 years to propagate from the Norwegian Sea to the Fram Strait region, and it took an additional 4.5 to 5 years to reach the EEB slope. NABOS mooring observations also revealed the structure of the boundary current, showing a sixfold decrease of the current’s speed on the route from Svalbard to the central Laptev Sea (Pnyushkov et al., 2015). NABOS repeat oceanographic transects confirmed the ongoing large-scale warming of the EEB. Furthermore, combined with data provided by other projects, they showed that the warm anomaly found its way further eastward towards the Canadian Basin (Figure 2). This warm pulse peaked in 2007–2008. By the late 2000s, the ocean interior had become slightly cooler (by 0.07°C) relative to the peak years, but still remained much warmer (by ~1°C) compared to the climatology of the 1970s (Polyakov et al., 2012).
Enhanced mooring capabilities of the program in the 2010s were critical in documenting and understanding further dramatic changes in the polar basins. These changes are closely related to the progression of anomalies from the Atlantic sector of the sub-Arctic seas into polar latitudes—a process called “Atlantification” (Polyakov et al., 2017). These observed changes represent a shift toward EEB conditions that resemble those observed in lower latitude regions—that is, warmer water with weaker vertical stratification in the upper ocean. At the same time, 2013–2018 NABOS mooring observations showed a lack of strong changes in the intensity of EEB along-slope water transports, suggesting that eastern Arctic Ocean Atlantification is related to changes in salinity at upstream locations in the Barents Sea (Pnyushkov et al., 2018, 2021).
The consequences of the reduced upper ocean stratification in the EEB are manifold. Both regional CTD surveys and mooring observations provide strong evidence of enhanced winter ventilation (Figure 3). For example, the CTD observations suggest an increase in winter (February–April) mixed layer depth—a robust indicator of winter mixing—in the 2010s compared to 1970s climatology (Figure 3, right). NABOS 2013–2018 mooring observations captured complete erosion by winter convection of the stratified layer (called Cold Halocline Layer, CHL) that buffers the upper ocean and sea ice from the warmth of the AW (Figure 3, left). Deep penetrative ventilation of the upper ocean well beyond the surface mixed layer strongly suggests an important role for entrainment rather than slow, molecularly driven, double-diffusive mixing in the upper EEB. This deep winter ventilation has resulted in enhanced upward AW heat fluxes sufficiently large to contribute substantially to the diminished regional sea ice cover (Polyakov et al., 2017, 2020b).
Using 2004–2018 mooring observations from the upper 50 m layer in the EEB, Polyakov et al. (2020c) revealed increased current speeds and shears associated with greater coupling between wind, ice, and oceanic currents and their vertical shear, particularly in summer. Substantial increases in both current speeds and shears are dominated by a twofold amplification of currents in the semidiurnal band, which includes tides and wind-forced near-inertial oscillations. These results point to a new positive feedback mechanism in which increased winter ventilation of the ocean interior associated with declining sea ice cover and weakening of halocline stratification enhances release of heat from the ocean interior to the sea surface, resulting in further sea ice loss. This process is coincident with potential alteration of vertical nutrient fluxes that support oceanic primary productivity, food web structure, and carbon export from the deep ocean layers and seabed to the atmosphere (Polyakov et al., 2020a,b).
The rapid and unforeseen changes in the eastern Arctic climate system associated with Atlantification are complex, poorly understood, and require careful evaluation. Specifically, assessment of the potential for Atlantification in the EEB and its expansion further eastward into the Makarov Basin of the Arctic Ocean is critical for improving skills for seasonal sea ice predictions (Polyakov et al., 2021). A new (2021–2025) cycle of NABOS observations will enable us to quantify the role of freshwater inventories and transports in shaping upper ocean stratification and ventilation of AW heat in the vast area spanning eastward from Severnaya Zemlya to the central East Siberian Sea. New NABOS mooring design incorporates enhanced observational capabilities in the very top layer of the ocean and includes multidisciplinary oceanographic and sea ice sensors (Kipp and Charette, 2022, in this issue). One of the important results of the first 2021 cruise of this cycle was deployment of nine such moorings along the Siberian slope. These efforts will inform the scientific community and the broader public about major changes in the EEB and beyond, as well as their potential impacts for the state of ice cover, marine ecosystems, and conditions in the mid-latitudes.
___________________________
Extensional Structures of the Central Arctic Uplifts Complex
12 June 2018
Abstract
The whole volume of the contemporary information describes the Central Arctic Uplifts Complex as a composite block of continental crust. Rift-related stretching and attenuation of the continental crust is the principal factor dictating the tectonic evolution of this block and its two-phased HALIP magmatism. The most evident signs of the rift-induced strain, − systems of grabens and half-grabens, high-altitude and gently dipping normal faults – are present in the Lomonosov Ridge, Mendeleev Ridge, Chukchi Plateau and on the slopes of the uplifts into the western parts of the Podvodnikov and Chukchi basins. Depocenters of the Vilkitsky Trough (deep-water prolongation of the offshore North Chukchi Trough) and Chukchi Basin are filled with substantially thick Jurassic (or pre- Upper Jurassic) sequence, traceable from the North Chukchi Trough. Jurassic (or pre- Upper Jurassic) deposits are interpreted as relicts of the pre-oceanic Ellesmerian structural stage preserved in near-shelf tectonic depressions. They are strongly affected by rifting only at the elevated parts of the Central Arctic Uplifts Complex, and much less – in the depocenters of the sedimentary depressions.
https://link.springer.com/chapter/10.1007/978-3-319-77742-9_9
___________________________
North
American origin of “pink–white” layers at the Mendeleev Ridge (Arctic
Ocean): New insights from lead and neodymium isotope composition of
detrital sediment component
2017
https://www.sciencedirect.com/science/article/abs/pii/S0025322717300233
___________________________
Arctic closure as a trigger for Atlantic overturning at the Eocene-Oligocene Transition
2019
Abstract
The
Eocene-Oligocene Transition (EOT), approximately 34 Ma ago, marks a
period of major global cooling and inception of the Antarctic ice sheet.
Proxies of deep circulation suggest a contemporaneous onset or
strengthening of the Atlantic meridional overturning circulation (AMOC).
Proxy evidence of gradual salinification of the North Atlantic and
tectonically driven isolation of the Arctic suggest that closing the
Arctic-Atlantic gateway could have triggered the AMOC at the EOT. We
demonstrate this trigger of the AMOC using a new paleoclimate model with
late Eocene boundary conditions. The control simulation reproduces
Eocene observations of low Arctic salinities. Subsequent closure of the
Arctic-Atlantic gateway triggers the AMOC by blocking freshwater inflow
from the Arctic. Salt advection feedbacks then lead to cessation of
overturning in the North Pacific. These circulation changes imply major
warming of the North Atlantic Ocean, and simultaneous cooling of the
North Pacific, but no interhemispheric change in temperatures.
https://www.nature.com/articles/s41467-019-11828-z
___________________________
Arctic warming interrupts the Transpolar Drift and affects long-range transport of sea ice and ice-rafted matter
02 April 2019
https://www.nature.com/articles/s41598-019-41456-y/
___________________________
Tracking Radium in the Arctic
April 23, 2019
https://eapsweb.mit.edu/news/2019/tracking-radium-arctic
___________________________
Residual β activity of particulate 234Th as a novel proxy for tracking sediment resuspension in the ocean
02 June 2016
https://www.nature.com/articles/srep27069
___________________________
THE ARCTIC RADIUM ISOTOPE OBSERVING NETWORK (ARION)
2022
TRACKING CLIMATE-DRIVEN CHANGES IN ARCTIC OCEAN CHEMISTRY
https://www.tos.org/oceanography/assets/docs/35-kipp.pdf
___________________________
Increased fluxes of shelf-derived materials to the central Arctic Ocean
3 Jan 2018
https://www.science.org/doi/10.1126/sciadv.aao1302
___________________________
The Late Mesozoic-Cenozoic Arctic Ocean Climate and Sea Ice History: A Challenge for Past and Future Scientific Ocean Drilling
06 November 2019
https://agupubs.onlinelibrary.wiley.com/doi/full/10.1029/2018PA003433
___________________________
Properties of surface water masses in the Laptev and the East Siberian seas in summer 2018 from in situ and satellite data
04 Feb 2021
https://os.copernicus.org/articles/17/221/2021/
___________________________
The influence of winter cloud on summer sea ice in the Arctic, 1983–2013
18 February 2016
https://agupubs.onlinelibrary.wiley.com/doi/full/10.1002/2015JD024316
___________________________
Arctic Ocean sea ice cover during the penultimate glacial and the last interglacial
2017 Aug 29
https://www.ncbi.nlm.nih.gov/pmc/articles/PMC5575311/
___________________________
Interannual Variability of Primary Production in the East Siberian Sea
02 March 2021
https://link.springer.com/article/10.1134/S0001437020050033
___________________________
The Role of Atmospheric Blocking in Regulating Arctic Warming
06 June 2022
https://agupubs.onlinelibrary.wiley.com/doi/10.1029/2022GL097899
___________________________
Radiogenic lead and neodymium composition of surface sediments from the Arctic Ocean. PANGAEA
https://doi.pangaea.de/10.1594/PANGAEA.859107
___________________________
North
American origin of “pink–white” layers at the Mendeleev Ridge (Arctic
Ocean): New insights from lead and neodymium isotope composition of
detrital sediment component
2017
https://www.sciencedirect.com/science/article/abs/pii/S0025322717300233
___________________________
Radium Isotopes Across the Arctic Ocean Show Time Scales of Water Mass Ventilation and Increasing Shelf Inputs
1 July 2018
https://www.semanticscholar.org/paper/Radium-Isotopes-Across-the-Arctic-Ocean-Show-Time-Loeff-Kipp/98003261eec17d21902b1b1a241d11a3586e20a7
___________________________
Increased fluxes of shelf-derived materials to the central Arctic Ocean
3 Jan 2018
https://www.science.org/doi/10.1126/sciadv.aao1302
___________________________
Scientists Find Surprising Evidence of Rapid Changes in the Arctic
January 5, 2018
https://climate.mit.edu/posts/scientists-find-surprising-evidence-rapid-changes-arctic
___________________________
In the Arctic Ocean, plankton grows where coastal sediment flows
January 5, 2018
https://www.arctictoday.com/in-the-arctic-ocean-plankton-grows-where-coastal-sediment-flows/
___________________________
Carbon mineralization in Laptev and East Siberian sea shelf and slope sediment
25 Jan 2018
https://bg.copernicus.org/articles/15/471/2018/
___________________________
Distribution and Transport of Water Masses in the East Siberian Sea and Their Impacts on the Arctic Halocline
2021
https://agupubs.onlinelibrary.wiley.com/doi/epdf/10.1029/2020JC016523
___________________________
Debris from Melting Shelves Changing the Biology and Chemistry of the Arctic Ocean
February 12, 2018
https://www.fondriest.com/news/debris-melting-shelves-changing-biology-chemistry-arctic-ocean.htm
___________________________
Scientists Find Surprising Evidence of Rapid Changes in the Arctic
January 3, 2018

Diminishing sea ice near the Arctic coast leaves more open water near the coast for winds to create waves. The increased wave action reaches down and stirs up sediments on shallow continental shelves, releasing radium and other chemicals that are carried up to the surface and swept away into the open ocean by currents such as the Transpolar Drift. A new study found surprising evidence that climate change is rapidly causing coastal changes in the Arctic that could have significant impacts on Arctic food webs and animal populations. (Natalie Renier, Woods Hole Oceanographic Institution)
Scientists have found surprising evidence of rapid climate change in the Arctic: In the middle of the Arctic Ocean near the North Pole, they discovered that the levels of radium-228 have almost doubled over the last decade.
The finding indicates that large-scale changes are happening along the coast—because the source of the radium is the land and shallow continental shelves surrounding the ocean. These coastal changes, in turn, could also be delivering more nutrients, carbon, and other chemicals into the Arctic Ocean and lead to dramatic impacts on Arctic food webs and animal populations.
The research team, led by Woods Hole Oceanographic Institution (WHOI), suspects that melting sea ice has left more open water near the coast for winds to create waves. The wave action reaches down to the shallow shelves and stirs up sediments, releasing radium that is carried to the surface and away into the open ocean. The same mechanism would likely also mobilize and deliver more nutrients, carbon, and other chemicals into the Arctic Ocean, fueling the growth of plankton at the bottom of the food chain. That, in turn, could have significant impacts on fish and marine mammals and change the Arctic ecosystem.
The study was published Jan. 3, 2018, in the journal Science Advances. The research team included Lauren Kipp, Matthew Charette, and Paul Henderson (WHOI), Willard Moore (University of South Carolina), and Ignatius Rigor (University of Washington).
Scientists have long used radium-228 to track the flow of material from land and sediments into the ocean. It is a naturally occurring isotope produced by the radioactive decay of thorium in sediments. But unlike thorium, it dissolves into water, where scientists can track the sources, amounts, rates, and direction of its flow, said Kipp, who is lead author of the study and a graduate student in the MIT-WHOI Joint Program in Oceanography.
Kipp led efforts to measure radium at 69 locations from the western edge of the Arctic Ocean to the Pole on a two-month voyage aboard the icebreaker Healy in the summer of 2015. The cruise was part of the international GEOTRACES program, which aims to measure chemical tracers in the world’s ocean to understand ocean circulation and provide a baseline to assess future chemical changes in the oceans. The U.S. GEOTRACES program and this study are both funded by the National Science Foundation.
To their surprise, the research team found that radium-228 concentrations in the central Arctic Ocean had increased substantially since measurements had last been made in 2007. What was its source and why had it increased?
The team investigated the trajectories of sea ice drifting in the ocean and saw a pattern of ice—and hence water—flowing northward from the vast northern coast of Russia toward the middle of the Arctic Ocean, where the radium concentrations had increased. The pattern aligned with the Transpolar Drift, a powerful current flowing in same direction that could transport radium from coastal sources.
They concluded that the excess radium had to have come from sediments in the East Siberian Arctic Shelf off Russia, the largest continental shelf on Earth. It is relatively shallow, with an average depth of 170 feet, but it extends 930 miles off shore and contains a vast reservoir of radium and other chemical compounds.
Something had to have changed along the coast to explain the dramatic surge in radium in the middle of the Arctic Ocean. The scientists theorize that a warming Arctic environment has reduced sea ice cover, allowing for more wave action that stirs up sediments and mobilizes more radium.
But there are other possible contributing factors that are causing changes over the shelf, the scientists say. More wave action can also cause more coastline erosion, adding more terrestrial sediment into the ocean. Warming temperatures can thaw permafrost, liberating more material into the ocean, and increasing river and groundwater runoff can carry more radium, nutrients, carbon, and other material into the Arctic.
“Continued monitoring of shelf inputs to Arctic surface waters is therefore vital to understand how the changing climate will affect the chemistry, biology, and economic resources of the Arctic Ocean,” the study’s authors wrote.
Data coverage over the East Siberian Shelf is currently very limited, so it is important to conduct more studies in this region in order to pinpoint the direct causes of the increased shelf inputs and allow future monitoring. “Evidence from Kipp and co-workers for substantial ongoing change in the chemical environment of the Arctic Ocean emphasizes the need for sustained study of these changes and of the processes involved,” said Bob Anderson, an Ewing-Lamont Research Professor at the Lamont-Doherty Earth Observatory of Columbia University and the director of the U.S. GEOTRACES Program Office. “It would be great if related efforts by marine geochemists in Russia could be integrated with future studies by other nations, for example under the auspices of the international GEOTRACES program.”
The Woods Hole Oceanographic Institution is a private, non-profit organization on Cape Cod, Mass., dedicated to marine research, engineering, and higher education. Established in 1930 on a recommendation from the National Academy of Sciences, its primary mission is to understand the ocean and its interaction with the Earth as a whole, and to communicate a basic understanding of the ocean’s role in the changing global environment.
https://www.whoi.edu/press-room/news-release/study-finds-surprising-evidence--of-rapid-changes-in-the-arctic/
___________________________
Anthropogenic traces in bottom sediments of Chukchi Sea
2019
https://www.sciencedirect.com/science/article/abs/pii/S1040618218313041
___________________________
Interpreting upward methane flux from marine pore water profiles
January 2009
https://www.researchgate.net/publication/285035151_Interpreting_upward_methane_flux_from_marine_pore_water_profiles
___________________________
Nitrogen dynamic in Eurasian coastal Arctic ecosystem: Insight from nitrogen isotope
24 April 2017
https://agupubs.onlinelibrary.wiley.com/doi/full/10.1002/2016GB005593
___________________________
Fate of Terrigenous Nitrogen in East Siberian Arctic Shelf Sediments
September 2019
https://www.researchgate.net/publication/336015936_Fate_of_Terrigenous_Nitrogen_in_East_Siberian_Arctic_Shelf_Sediments
___________________________
The Arctic Ocean as a dead end for floating plastics in the North Atlantic branch of the Thermohaline Circulation
19 Apr 2017
https://www.science.org/doi/10.1126/sciadv.1600582
___________________________
The rotations opening the Central and Northern Atlantic Ocean: compilation, drift lines, and flow lines
22 January 2013
https://link.springer.com/article/10.1007/s00531-012-0860-6
___________________________
The Spatial Distribution of Plankton Picocyanobacteria on the Shelf of the Kara, Laptev, and East Siberian Seas
26 February 2020
https://link.springer.com/article/10.3103/S0096392519040011
___________________________
Desorption
kinetics of heavy metals in the gleyic layer of permafrost-affected
soils in Arctic region assessed by geochemical fractionation and
DGT/DIFS
2021
https://www.sciencedirect.com/science/article/abs/pii/S0341816221003970
___________________________
The Arctic wasteland: a perspective on Arctic pollution
27 October 2009
https://www.cambridge.org/core/journals/polar-record/article/abs/arctic-wasteland-a-perspective-on-arctic-pollution/64EB0BA39BA6CCAF7A86EAB7842DAB56
___________________________
Authigenic Gypsum Precipitation in the ARAON Mounds, East Siberian Sea
2 August 2022
https://www.mdpi.com/2075-163X/12/8/983
___________________________
Abundance and sinking of particulate black carbon in the western Arctic and Subarctic Oceans
15 July 2016
The abundance and sinking of particulate black carbon (PBC) were
examined for the first time in the western Arctic and Subarctic Oceans.
In the central Arctic Ocean, high PBC concentrations with a mean of
0.021 ± 0.016 μmol L−1 were observed in the marginal ice zone (MIZ). A number of parameters, including temperature, salinity and 234Th/238U
ratios, indicated that both the rapid release of atmospherically
deposited PBC on sea ice and a slow sinking rate were responsible for
the comparable PBC concentrations between the MIZ and mid-latitudinal
Pacific Ocean (ML). On the Chukchi and Bering Shelves (CBS), PBC
concentrations were also comparable to those obtained in the ML.
Further, significant deficits of 234Th revealed the rapid
sinking of PBC on the CBS. These results implied additional source terms
for PBC in addition to atmospheric deposition and fluvial discharge on
the western Arctic shelves. Based on 234Th/238U disequilibria, the net sinking rate of PBC out of the surface water was −0.8 ± 2.5 μmol m−3 d−1 (mean ± s.d.) in the MIZ. In contrast, on the shelves, the average sinking rate of PBC was 6.1 ± 4.6 μmol m−3 d−1. Thus, the western Arctic Shelf was probably an effective location for burying PBC.
https://www.nature.com/articles/srep29959
___________________________
Plio-Pleistocene evolution of water mass exchange and erosional input at the Atlantic-Arctic gateway
2016
https://ir.library.oregonstate.edu/concern/articles/z890s0126?locale=en
___________________________
Discrepancies between neodymium, lead and strontium model ages from the Precambrian of southern East Greenland: Evidence for a Proterozoic granulite-facies event affecting Archaean gneisses
1992
https://www.sciencedirect.com/science/article/abs/pii/016896229290003S
___________________________
Remobilization of dormant carbon from Siberian-Arctic permafrost during three past warming events
16 Oct 2020
Abstract
Carbon
cycle models suggest that past warming events in the Arctic may have
caused large-scale permafrost thaw and carbon remobilization, thus
affecting atmospheric CO2 levels. However, observational records are
sparse, preventing spatially extensive and time-continuous
reconstructions of permafrost carbon release during the late Pleistocene
and early Holocene. Using carbon isotopes and biomarkers, we
demonstrate that the three most recent warming events recorded in
Greenland ice cores—(i) Dansgaard-Oeschger event 3 (~28 ka B.P.), (ii)
Bølling-Allerød (14.7 to 12.9 ka B.P.), and (iii) early Holocene (~11.7
ka B.P.)—caused massive remobilization and carbon degradation from
permafrost across northeast Siberia. This amplified permafrost carbon
release by one order of magnitude, particularly during the last
deglaciation when global sea-level rise caused rapid flooding of the
land area thereafter constituting the vast East Siberian Arctic Shelf.
Demonstration of past warming-induced release of permafrost carbon
provides a benchmark for the sensitivity of these large carbon pools to
changing climate.
https://www.science.org/doi/10.1126/sciadv.abb6546
___________________________
On carbon transport and fate in the East Siberian Arctic land–shelf–atmosphere system
4 January 2012
https://iopscience.iop.org/article/10.1088/1748-9326/7/1/015201
___________________________
Carbon mineralization in Laptev and East Siberian sea shelf and slope sediment
25 Jan 2018
Abstract
The Siberian Arctic Sea shelf and slope is a key region for the degradation
of terrestrial organic material transported from the organic-carbon-rich
permafrost regions of Siberia. We report on sediment carbon mineralization
rates based on O2 microelectrode profiling; intact sediment core
incubations; 35S-sulfate tracer experiments; pore-water dissolved
inorganic carbon (DIC); δ13CDIC;
and iron, manganese, and
ammonium concentrations from 20 shelf and slope stations. This data set
provides a spatial overview of sediment carbon mineralization rates and
pathways over large parts of the outer Laptev and East Siberian Arctic
shelf
and slope and allows us to assess degradation rates and efficiency of
carbon
burial in these sediments. Rates of oxygen uptake and iron and manganese
reduction were comparable to temperate shelf and slope environments, but
bacterial sulfate reduction rates were comparatively low. In the topmost
50 cm of sediment, aerobic carbon mineralization dominated degradation
and
comprised on average 84 % of the depth-integrated carbon mineralization.
Oxygen uptake rates and anaerobic carbon mineralization rates were
higher in
the eastern East Siberian Sea shelf compared to the Laptev Sea shelf.
DIC ∕ NH ratios in pore waters and the stable carbon isotope
composition of remineralized DIC indicated that the degraded organic matter
on the Siberian shelf and slope was a mixture of marine and terrestrial
organic matter. Based on dual end-member calculations, the terrestrial
organic carbon contribution varied between 32 and 36 %, with a higher
contribution in the Laptev Sea than in the East Siberian Sea. Extrapolation
of the measured degradation rates using isotope end-member apportionment over
the outer shelf of the Laptev and East Siberian seas suggests that about 16 Tg C yr−1 is respired in the outer shelf seafloor sediment. Of the organic
matter buried below the oxygen penetration depth, between 0.6 and 1.3 Tg C yr−1 is degraded by anaerobic processes, with a terrestrial organic
carbon contribution ranging between 0.3 and 0.5 Tg yr−1.
https://bg.copernicus.org/articles/15/471/2018/
___________________________
Arctic sea ice melt onset favored by an atmospheric pressure pattern reminiscent of the North American-Eurasian Arctic pattern
29 April 2021
https://link.springer.com/article/10.1007/s00382-021-05776-y
___________________________
Atmospheric destabilization leads to Arctic Ocean winter surface wind intensification
17 May 2024
Abstract
The surface-amplified winter warming over the Arctic Ocean is accompanied by a pronounced intensification of near-surface winds, simulated by climate models and emerging in reanalysis data. Here, the influences of sea-ice decline, wind changes aloft, and atmospheric stability are revisited based on CMIP6 historical and high-emission scenario and ERA5 reanalysis data. Spatial trend patterns suggest that near-surface wind intensification over the inner Arctic Ocean in winter is largely driven by an increasing downward momentum transfer due to a weakening atmospheric stratification. In contrast, a near-surface wind intensification in summer appears to be largely driven by accelerating winds aloft, amplified in a high-emission future by decreasing surface roughness due to sea-ice decline. In both seasons, differences in near-surface wind-speed trends are closely linked to atmospheric stability trends. Models suggest that by 2100 the lower troposphere may become as unstable in winter as in summer, implying a fundamental regime shift of the Arctic winter boundary layer.
https://www.nature.com/articles/s43247-024-01428-1
___________________________
Atmospheric Pressure Rivalry Between the Arctic and Northern Pacific: Implications for Alaskan Climate Variability
23 October 2024
ABSTRACT
Located at the confluence of the Arctic and North Pacific and with Alaska at its heart, the Pacific Arctic Region (PAR) is a unique and interconnected regional climate system. Significant climatic changes in the PAR are described by a novel, mobile monthly Alaska Arctic Front (AAF) index, which is defined by sea level pressure differences between the migratory cores of the Beaufort High and Aleutian Low. Regional climate variability associated with the AAF shows prominent decadal signatures that are driven by the opposing effects of the North Pacific and the Arctic atmospheric pressure fields. Low AAF (negative phase) is dominated by North Pacific forcing, whereas high AAF (positive phase) is dominated by Arctic atmospheric processes. The recent (2011–2021) negative AAF phase, which is associated with the westward displacement of Aleutian Low explaining stronger northward winds and enhanced water transport northward through Bering Strait, is conducive to increased oceanic heat and freshwater content, reduced regional sea ice cover in the PAR, and to the expansion of Pacific species into the Arctic. These factors are all indicators of the Pacification of the Arctic Ocean, a key feature of climate change related to progression of anomalous Pacific water masses and biota into the polar basins. It is not yet clear if or when the recent phase of decadal variability will change and alter the rate of Pacification of the Arctic climate system.
1 Introduction
Arctic sea ice loss and atmospheric warming have increased significantly in recent decades, and both trends have emerged as primary indicators of global warming, suggesting that the Arctic is undergoing notable and possibly irreversible changes (Box et al. 2019). Pan-Arctic climate variability and changes, however, are not uniform in time, and are modulated by the interannual to decadal-scale atmospheric forcings such as the Arctic Oscillation (AO) and Arctic Dipole (AD) (e.g., Overland et al. 2012; Proshutinsky et al. 2015). When the AD is positive, as it has been during the recent decade, anticyclonic surface pressure and winds prevail over North America and cyclonic winds occur over Eurasia on climate timescales (Overland and Wang 2005; Polyakov et al. 2023). The current positive AD phase (AD+) began in 2007 and has directly impacted the Arctic climate and cryosphere. It has weakened northward oceanic inflows and enhanced sea ice export across Fram Strait, increased inflows throughout the Barents Sea, and favoured stronger Arctic Ocean circulation. The AD+ phase also contributed to slowing sea ice loss in the Amerasian Basin (Figure S1; for this and other geographical names, see Figure 1) by moving freshwater from the Siberian shelves, increasing regional stratification, and lowering vertical oceanic heat fluxes after 2007 (Polyakov et al. 2023).
Regional climatic changes may, however, follow distinct patterns. For example, the Pacific Arctic Region (PAR), loosely bounded by the Bering Sea on the south and the Amerasian Basin with its adjoining shelves on the north, is a unique and interconnected regional system. Encompassing the confluence of the Arctic and Pacific, the physical, biological, and socio-ecological components of the system are exhibiting rapid changes (Huntington et al. 2020). As we will show further, the origins of PAR variability are different from those controlling pan-Arctic variability in recent decades, which has been dominated by the AD. Furthermore, given the complex origins of regional climate variability, there is evidence that using a single climate index to explain climate anomalies may be an oversimplification (McAfee 2016). For instance, the Pacific Decadal Oscillation (PDO) index shows significant variations in the amplitude of circulation patterns, surface temperature, and precipitation anomalies of the North American winters between comparable PDO phases (McAfee 2014). Following this background, in this study we examine how the Pacific Arctic sector relates to co-variations in atmospheric patterns in the North Pacific and Arctic (the Aleutian Low [AL] and Beaufort Sea High). We will demonstrate that the importance of factors controlling the PAR climate changes in time.
Many of the observed PAR changes have been associated with anomalous sea ice loss (e.g., Ballinger and Overland 2022). The rates of sea ice decline were strong both in the Amerasian Basin in summer (up to 1.5 × 10⁴ km2/year prior to 2007; see figure 1e in Polyakov et al. 2023) and over the Bering Sea shelf in winter (Thoman et al. 2020). However, in response to the redistribution of freshwater from the Siberian shelves into the Amerasian Basin caused by anomalous winds and increased stratification that suppresses vertical oceanic heat fluxes, the regional sea ice area in the basin actually increased since 2007, remaining about 5%–35% below the 30-year mean (Polyakov et al. 2023). Meanwhile, the annual mean sea ice concentration (SIC) trend in the Bering Sea contrasts with that of the Arctic (Frey et al. 2025); over 1980–2021 the Bering ice trend was positive, 0.70 ± 0.29% per decade, with 2012 exhibiting record high and 2018 experiencing record low sea ice coverage. Ice conditions are governed largely by the regional wind field and upper ocean heat content (Thoman et al. 2020; Wang, Jing, and Guo 2024) (Figure S1). Extreme Bering Sea ice loss occurred during consecutive winters of 2017–2018 and 2018–2019 (Stabeno and Bell 2019; Overland et al. 2024), which altered the timing of subsistence activities by coastal Alaska Native hunters (Hauser et al. 2021) and triggered northward displacements of commercially important fish stocks, in particular walleye pollock (Gadus theragrammus), Pacific cod (Gadus macrocephalus) and several flatfish species (Stevenson and Lauth 2019). Warm waters associated with the region's ice loss appear to have caused the collapse of the economically important eastern Bering Sea snow crab (Szuwalski et al. 2023).
The recent decades were also marked by strong climatic changes in Alaska's continental shelf waters and the adjoining basins. The eastern Bering Sea shelf experienced statistically significant warming of surface waters and freshening of the water column over the length of the instrumental records which started in the mid-1960s (Danielson, Akhinga et al. 2020, their figure 7). The processes accelerated in the 2010s, promoting enhanced air-ocean heat exchanges and advection of oceanic heat northward through Bering Strait into the Arctic, with the additional loss of Arctic sea ice, freshening of the upper ocean, and the northward spread of biota (Danielson, Ahkinga et al. 2020; Timmermans and O'Toole 2023; Baker et al. 2023). On the Chukchi shelf, the warming rate since 1990 tripled, capping a century-long warming of 1.4°C that was not accompanied by significant changes in salinity (Danielson, Ahkinga et al. 2020). Anomalous oceanic heat transport across the Bering/Chukchi shelves is received by the Amerasian Basin, where they impact the heat and freshwater content in the Arctic's halocline (e.g., Steele et al. 2004; Timmermans et al. 2014; Timmermans, Toole, and Krishfield 2018; Polyakov et al. 2020; Woodgate and Peralta-Ferriz 2021) and affect the northward expansion of Pacific species' distributions into the Arctic (Ershova et al. 2015; Baker et al. 2023).
PAR sea ice decline and warming across the ocean–atmosphere interface amplify turbulent heat exchange between the ocean and the atmosphere, affecting the region's weather variability at short and long-term scales. For example, stronger heat transfer from the upper ocean to the atmosphere can modify the local atmospheric pressure field. This process provides additional energy to intermittent, overlying high-pressure ridges within the polar jet stream (Ballinger and Overland 2022) as was the case documented by Tachibana et al. (2019) for the winter of 2017–18. Turbulent heat transfer is also associated with decreasing static stability and increasing horizontal wind shear, which are linked with intensification of wintertime cyclones travelling from the Bering Sea northward into the Arctic Ocean since 1979 (Crawford et al. 2022).
Increased variability of the position and strength of the Beaufort High (BH), typically centred over the Canada Basin and associated with anticyclonic winds, played a critical role in these changes. For instance, during considerable portions of the winters in 2017 and 2020, the BH and associated Beaufort Gyre—a prominent component of the Arctic sea ice and upper ocean circulation—unexpectedly vanished (Moore et al. 2018; Ballinger et al. 2021). The winter of 2020/21 was also highly unusual, and featured an extraordinarily strong BH and the second-highest winter sea-level pressure (SLP) north of 60° N since 1979 that resulted in significant sea ice redistributions in the central Arctic (Mallett et al. 2021).
https://rmets.onlinelibrary.wiley.com/doi/full/10.1002/joc.8638
___________________________
New particle formation and its effect on cloud condensation nuclei abundance in the summer Arctic: a case study in the Fram Strait and Barents Sea
https://acp.copernicus.org/articles/19/14339/2019/
___________________________
Frequent new particle formation over the high Arctic pack ice by enhanced iodine emissions
2020
Abstract
In the central Arctic Ocean the formation of clouds and their properties are sensitive to the availability of cloud condensation nuclei (CCN). The vapors responsible for new particle formation (NPF), potentially leading to CCN, have remained unidentified since the first aerosol measurements in 1991. Here, we report that all the observed NPF events from the Arctic Ocean 2018 expedition are driven by iodic acid with little contribution from sulfuric acid. Iodic acid largely explains the growth of ultrafine particles (UFP) in most events. The iodic acid concentration increases significantly from summer towards autumn, possibly linked to the ocean freeze-up and a seasonal rise in ozone. This leads to a one order of magnitude higher UFP concentration in autumn. Measurements of cloud residuals suggest that particles smaller than 30 nm in diameter can activate as CCN. Therefore, iodine NPF has the potential to influence cloud properties over the Arctic Ocean.
https://pmc.ncbi.nlm.nih.gov/articles/PMC7529815/
___________________________
Aerosol and dynamical contributions to cloud droplet formation in Arctic low-level clouds
https://acp.copernicus.org/articles/23/13941/2023/
___________________________
It's Snowing Less And Raining More in The Arctic, And That's Bad News
17 December 2022

https://www.sciencealert.com/its-snowing-less-and-raining-more-in-the-arctic-and-that's-bad-news
___________________________
Unraveling the Arctic’s Surprising Rain Surge
___________________________
Why Atlantic Hurricanes Are Getting Stronger Faster Than Other Storms
September 30, 2022
https://time.com/6218869/why-atlantic-hurricanes-are-getting-stronger/
___________________________
Arctic sea ice melt onset favored by an atmospheric pressure pattern reminiscent of the North American-Eurasian Arctic pattern
29 April 2021
Abstract
The timing of melt onset in the Arctic plays a key role in the evolution of sea ice throughout Spring, Summer and Autumn. A major catalyst of early melt onset is increased downwelling longwave radiation, associated with increased levels of moisture in the atmosphere. Determining the atmospheric moisture pathways that are tied to increased downwelling longwave radiation and melt onset is therefore of keen interest. We employed Self Organizing Maps (SOM) on the daily sea level pressure for the period 1979–2018 over the Arctic during the melt season (April–July) and identified distinct circulation patterns. Melt onset dates were mapped on to these SOM patterns. The dominant moisture transport to much of the Arctic is enabled by a broad low pressure region stretching over Siberia and a high pressure over northern North America and Greenland. This configuration, which is reminiscent of the North American-Eurasian Arctic dipole pattern, funnels moisture from lower latitudes and through the Bering and Chukchi Seas. Other leading patterns are variations of this which transport moisture from North America and the Atlantic to the Central Arctic and Canadian Arctic Archipelago. Our analysis further indicates that most of the early and late melt onset timings in the Arctic are strongly related to the strong and weak emergence of these preferred circulation patterns, respectively...
https://link.springer.com/article/10.1007/s00382-021-05776-y
___________________________
Arctic Sea Level and Surface Circulation Response to the Arctic Oscillation
07 June 2018
Abstract
The Arctic Oscillation (AO) is the leading mode of extratropical northern hemisphere atmospheric variability, affecting surface pressure, winds, temperature, and precipitation. Here we use an altimeter sea level record spanning 2003–2014, covering the ice-covered and ice-free ocean, to examine the influence of the AO on Arctic sea level and surface geostrophic circulation. AO-driven alongshore wind anomalies drive cross-shelf Ekman transport and opposing barotropic sea level anomalies between the shelf seas and deep basins of the Arctic Ocean, with maximum sea level anomaly differences across the shelf-break of ~3 cm per unit AO index. This pattern of sea level variability generates topographically steered (generally along-shelf) current anomalies of around 0.5 cm/s per unit AO index. AO-driven wind variability modulates surface currents associated with Atlantic and Pacific water inflow, with opposing inflow anomalies between the Barents Sea Opening and Bering Strait.
Key Points
- Monthly record of ice-covered and ice-free Arctic sea level and surface currents used to examine the Arctic Ocean response to the AO
- AO drives cross-shelf Ekman transport, leading to opposing barotropic sea level anomalies between the Arctic shelf seas and deeper basins
- AO sea level variability induces along-shelf current anomalies and modulates currents associated with Atlantic and Pacific Water inflows
Plain Language Summary
The Arctic Oscillation dominates large-scale changes in atmospheric pressure, wind, temperature, and precipitation north of 20°N. This study uses satellite measurements to investigate the impact the Arctic Oscillation has on sea level and upper ocean currents in the Arctic Ocean. Winds associated with the Arctic Oscillation cause sea levels to rise in the shallow coastal shelf seas, and drop in the deeper ocean, or vice versa, depending if the Arctic Oscillation is in a positive or negative phase. These sea level patterns drive currents which generally follow the edge of the continental shelf. The Arctic Oscillation also influences the strength of the currents associated with the inflow of Atlantic Water through the Barents Sea and the inflow Pacific Water through the Bering Strait.
https://agupubs.onlinelibrary.wiley.com/doi/full/10.1029/2018GL078386
___________________________
Sea ice loss in association with Arctic cyclones
22 January 2025
Abstract
Arctic sea-ice extent has reduced by over 40% during late summer since 1979, and the day-to-day changes in sea ice extent have shifted to more negative values. Drivers of Arctic weather that cause large short-term changes are rarely predicted more than a week in advance. Here we investigate variability in changes in sea ice extent for periods of less than 18 days and their association to Arctic cyclones and tropopause polar vortices. We find that these very rapid sea ice loss events are substantial year-round and have increased over the last 30 years in June-August due to thinning sea ice that is more susceptible to forcings from ocean waves and low-level atmospheric wind. These events occur in regions of enhanced near-surface level pressure gradients between synoptic-scale high and low pressure systems over regions of relatively thin sea ice, and are preceded by tropopause polar vortices.
Introduction
The Arctic has undergone dramatic changes in temperature and in sea ice extent since routine measurements have begun, with temperatures warming at more than double the rate of the global average1,2,3,4 and September sea ice extent (SIE) declining by over 40%5. Greater warming in the Arctic than surrounding lower latitudes, referred to as Arctic amplification, can largely be explained by the influence of declining sea ice on atmospheric radiative feedbacks. The presence of sea ice elevates atmospheric stability and inhibits the increase in longwave energy radiated back to space in response to surface warming compared to ice-free regions6. In addition, absorption of solar radiation at the surface increases when snow and ice retreat7,8,9,10,11,12. From October - January, when incoming solar radiation is largely absent, the increasing surface air temperature trends are largely associated with the increase in the downward longwave radiation13. However, even though global climate models incorporate such feedback processes, ensemble projections of sea ice decline tend to be quite conservative with respect to the observed trends14,15,16,17,18. Recently, evidence has been mounting on the impact that Arctic cyclones can have on sea ice at very short time scales19,20,21,22,23,24,25,26,27. The present study will establish that Arctic cyclones associated with sea ice loss at short time scales occur in areas of relatively thin sea ice where there are enhanced pressure gradients. Though the exact mechanisms of how an Arctic cyclone can rapidly change sea ice are incompletely understood, some studies suggest that ocean waves induced by the wind of an Arctic cyclone on the surface can break up sea ice under certain conditions18,28,29,30,31,32,33,34. Even when Arctic cyclones are well-represented in numerical models35,36,37, the sea ice dynamics surrounding upper-ocean mixing and the breakup due to waves is a missing process in most models, resulting in little skill in sea ice reductions due to Arctic cyclones18. Notwithstanding sea ice reductions alone, there is growing evidence that a warming Arctic can impact large-scale atmospheric circulation patterns throughout the Northern Hemisphere38,39,40,41,42,43,44,45,46,47,48, thus gaining knowledge of the variability in sea ice due to short time-scale features such as Arctic cyclones is important in order to assess the global risks of climate change. This study investigates the relatively short, synoptic-timescale reductions in sea ice, which we call very rapid sea ice loss events (VRILEs), and whether there are common atmospheric features associated with VRILEs such as Arctic cyclones.
The term RILE49, for rapid ice loss event, describes the very large, intermittent trends of about 5-yr duration in September SIE, first discovered in global climate models50 and seen in the Arctic over 2007–2012. Back-to-back years with an enhanced frequency of VRILEs could lead to a RILE. A fundamental understanding of how Arctic cyclones could cause VRILEs is lacking and VRILEs have not been predicted more than a week or two in advance51,52. The timing of Arctic cyclones and the state of the underlying sea ice are important factors that influence the sea ice response27,53,54. When a surface cyclone develops early in summer, it may act to preserve sea ice by increasing cloud cover and decreasing the surface absorbed solar radiation25,55. In contrast, while most surface cyclones do not lead to ice loss25,26,56, it may be possible for a surface cyclone in late summer to enhance melt or inhibit growth by mixing up heat from the upper ocean’s near-surface temperature maximum that may otherwise be sequestered under a freshwater capping layer21,27. Cyclone-driven ocean surface waves can propagate further into thinner sea ice, accelerating sea ice floe breakup29,30,34,57,58. The region subject to wave propagation, known as the Marginal Ice Zone (MIZ), with lower sea ice concentration rimming the more concentrated pack ice, has widened in summer in recent decades59.
https://www.nature.com/articles/s43247-025-02022-9
___________________________
The emergence of a dipole-like mode in Arctic atmospheric circulation conducive to European heat waves
04 February 2025
https://www.nature.com/articles/s43247-025-02020-x
___________________________
Arctic circulation regimes
13 October 2015
https://royalsocietypublishing.org/doi/10.1098/rsta.2014.0160
___________________________
Influence of high-latitude atmospheric circulation changes on summertime Arctic sea ice
13 March 2017
Abstract
The Arctic has seen rapid sea-ice decline in the past three decades, whilst warming at about twice the global average rate. Yet the relationship between Arctic warming and sea-ice loss is not well understood. Here, we present evidence that trends in summertime atmospheric circulation may have contributed as much as 60% to the September sea-ice extent decline since 1979. A tendency towards a stronger anticyclonic circulation over Greenland and the Arctic Ocean with a barotropic structure in the troposphere increased the downwelling longwave radiation above the ice by warming and moistening the lower troposphere. Model experiments, with reanalysis data constraining atmospheric circulation, replicate the observed thermodynamic response and indicate that the near-surface changes are dominated by circulation changes rather than feedbacks from the changing sea-ice cover. Internal variability dominates the Arctic summer circulation trend and may be responsible for about 30–50% of the overall decline in September sea ice since 1979.
https://www.nature.com/articles/nclimate3241
___________________________
Polar high
https://en.wikipedia.org/wiki/Polar_high
In meteorology, the polar highs are areas of high atmospheric pressure, sometimes similar to anticyclones, around the North and South Poles; the south polar high (Antarctic high) being the stronger one[1] because land gains and loses heat more effectively than sea, which the north has much less of. The cold temperatures in the polar regions cause air to descend, creating the high pressure (a process called subsidence), just as the warm temperatures around the equator cause air to rise instead and create the low pressure Intertropical Convergence Zone. Rising air also occurs along bands of low pressure situated just below the polar highs around the 50th parallel of latitude. These extratropical convergence zones are occupied by the polar fronts where air masses of polar origin meet and clash with those of tropical or subtropical origin in a stationary front.[2] This convergence of rising air completes the vertical cycle around the polar cell in each latitudinal hemisphere's polar region. Closely related to this concept is the polar vortex, a rotating low-pressure circle of cold air around the poles.
Surface temperatures under the polar highs are one of the coldest on Earth, with no month having an average temperature above freezing. Regions under the polar high also experience very low levels of precipitation, which leads them to be known as "polar deserts".
Air flows outwards from the poles to create the polar easterlies in the Arctic and Antarctic areas.
___________________________
What Are High and Low Pressure Systems?
https://scijinks.gov/high-and-low-pressure-systems/
___________________________
Siberian High
https://en.wikipedia.org/wiki/Siberian_High
The Siberian High (also Siberian Anticyclone; Russian: Азиатский антициклон (Aziatsky antitsiklon); Chinese: 西伯利亞高壓; Pinyin Xībólìyǎ gāoyā; Kazakh Азия антициклоны (Aziya antitsiklonı)) is a massive collection of cold dry air that accumulates in the northeastern part of Eurasia from September until April. It is usually centered on Lake Baikal.[1] It reaches its greatest size and strength in the winter when the air temperature near the center of the high-pressure area is often lower than −40 °C (−40 °F). The atmospheric pressure is often above 1,040 millibars (31 inHg). The Siberian High is the strongest semi-permanent high in the northern hemisphere and is responsible for both the lowest temperature in the Northern Hemisphere outside Greenland, of −67.8 °C (−90.0 °F) on 15 January 1885 at Verkhoyansk, and the highest pressure, 1083.8 mbar (108.38 kPa, 32.01 inHg) at Agata, Krasnoyarsk Krai, on 31 December 1968, ever recorded.[2] The Siberian High is responsible both for severe winter cold and attendant dry conditions with little snow and few or no glaciers across the Asian part of Russia, Mongolia, and China. During the summer, the Siberian High is largely replaced by the Asiatic low.
Overview
The Siberian High affects the weather patterns in most parts of the Northern Hemisphere: its influence extends as far west as Italy,[3] bringing freezing conditions also in the warm South,[4] and as far southeast as Malaysia,[5] where it is a critical component of the northeast monsoon. Occasionally a strong Siberian High can bring unusually cold weather into the tropics as far southeast as the Philippines.[6] It may block or reduce the size of low-pressure cells and generate dry weather across much of the Asian landscape with the exception of regions such as Hokuriku and the Caspian Sea coast of Iran that receive orographic rainfall from the winds it generates. As a result of the Siberian High, coastal winters in the main city of Pacific Russia Vladivostok are very cold in relation to its latitude and proximity to the ocean.
Siberian air is generally colder than Arctic air, because unlike Arctic air which forms over the sea ice around the North Pole, Siberian air forms over the cold tundra of Siberia, which does not radiate heat the same way the ice of the Arctic does.
___________________________
Air mass
https://en.wikipedia.org/wiki/Air_mass
In meteorology, an air mass is a volume of air defined by its temperature and humidity. Air masses cover many hundreds or thousands of square miles, and adapt to the characteristics of the surface below them. They are classified according to latitude and their continental or maritime source regions. Colder air masses are termed polar or arctic, while warmer air masses are deemed tropical. Continental and superior air masses are dry, while maritime and monsoon air masses are moist. Weather fronts separate air masses with different density (temperature or moisture) characteristics. Once an air mass moves away from its source region, underlying vegetation and water bodies can quickly modify its character. Classification schemes tackle an air mass's characteristics, as well as modification.
___________________________
Summer atmospheric circulation anomalies over the Arctic Ocean and their influences on September sea ice extent: A cautionary tale
08 August 2016
https://agupubs.onlinelibrary.wiley.com/doi/10.1002/2016JD025161
___________________________
Analyzing the effects of sea ice melting and atmospheric heat transport on the warming around arctic based on comparable analysis and coupling modes
2021
https://www.sciencedirect.com/science/article/abs/pii/S0169809521001824
___________________________
The role of interdecadal climate oscillations in driving Arctic atmospheric river trends
08 March 2024
https://www.nature.com/articles/s41467-024-45159-5
___________________________
Role of atmospheric rivers in shaping long term Arctic moisture variability
29 June 2024
Abstract
Atmospheric rivers (ARs) reaching high-latitudes in summer contribute to the majority of climatological poleward water vapor transport into the Arctic. This transport has exhibited long term changes over the past decades, which cannot be entirely explained by anthropogenic forcing according to ensemble model responses. Here, through observational analyses and model experiments in which winds are adjusted to match observations, we demonstrate that low-frequency, large-scale circulation changes in the Arctic play a decisive role in regulating AR activity and thus inducing the recent upsurge of this activity in the region. It is estimated that the trend in summertime AR activity may contribute to 36% of the increasing trend of atmospheric summer moisture over the entire Arctic since 1979 and account for over half of the humidity trends in certain areas experiencing significant recent warming, such as western Greenland, northern Europe, and eastern Siberia. This indicates that AR activity, mostly driven by strong synoptic weather systems often regarded as stochastic, may serve as a vital mechanism in regulating long term moisture variability in the Arctic.
https://www.nature.com/articles/s41467-024-49857-y
___________________________
Riddle of varying warm water inflow in the Arctic now solved
September 21, 2023
https://www.sciencedaily.com/releases/2023/09/230921105709.htm
___________________________
Multiscale variations in Arctic sea ice motion and links to atmospheric and oceanic conditions
2021
Arctic sea ice drift motion affects the global material balance, energy exchange and climate change and seriously affects the navigational safety of ships along certain channels. Due to the Arctic's special geographical location and harsh natural conditions, observations and broad understanding of the Arctic sea ice motion are very limited. In this study, sea ice motion data released by the National Snow and Ice Data Center (NSIDC) were used to analyze the climatological, spatial and temporal characteristics of the Arctic sea ice drift from 1979 to 2018 and to understand the multiscale variation characteristics of the three major Arctic sea ice drift patterns. The empirical orthogonal function (EOF) analysis method was used to extract the three main sea ice drift patterns, which are the anticyclonic sea ice drift circulation pattern on the scale of the Arctic basin, the average sea ice transport pattern from the Arctic Ocean to the Fram Strait, and the transport pattern moving ice between the Kara Sea (KS) and the northern coast of Alaska. By using the ensemble empirical mode decomposition (EEMD) method, each temporal coefficient series extracted by the EOF method was decomposed into multiple timescale sequences. We found that the three major drift patterns have four significant interannual variation periods of approximately 1, 2, 4 and 8 years. Furthermore, the second pattern has a significant interdecadal variation characteristic with a period of approximately 19 years, while the other two patterns have no significant interdecadal variation characteristics. Combined with the atmospheric and oceanic geophysical variables, the results of the correlation analysis show that the first EOF sea ice drift pattern is mainly related to atmospheric environmental factors, the second pattern is related to the joint action of atmospheric and oceanic factors, and the third pattern is mainly related to oceanic factors. Our study suggests that the ocean environment also has a strong correlation with sea ice movement. Especially for some sea ice transport patterns, the correlation even exceeds atmospheric forcing.
https://tc.copernicus.org/articles/15/3797/2021/
___________________________
Arctic sea ice melt onset favored by an atmospheric pressure pattern reminiscent of the North American-Eurasian Arctic pattern
2021-01-01
___________________________
Polar Climate Change as Manifest in Atmospheric Circulation
02 August 2018
Abstract
Purpose of Review
Dynamic manifestations of climate change, i.e. those related to circulation, are less well understood than are thermodynamic, or temperature-related aspects. However, this knowledge gap is narrowing. We review recent progress in understanding the causes of observed changes in polar tropospheric and stratospheric circulation, and in interpreting climate model projections of their future changes.
Recent Findings
Trends in the annular modes reflect the influences of multiple drivers. In the Northern Hemisphere, there appears to be a “tug-of-war” between the opposing effects of Arctic near-surface warming and tropical upper tropospheric warming, two predominant features of the atmospheric response to increasing greenhouse gases. Future trends in the Southern Hemisphere largely depend on the competing effects of stratospheric ozone recovery and increasing greenhouse gases.
Summary
Human influence on the Antarctic circulation is detectable in the strengthening of the stratospheric polar vortex and the poleward shift of the tropospheric westerly winds. Observed Arctic circulation changes cannot be confidently separated from internal atmospheric variability.
https://link.springer.com/article/10.1007/s40641-018-0111-4
___________________________
The interplanetary magnetic field influences mid-latitude surface atmospheric pressure
4 October 2013
https://iopscience.iop.org/article/10.1088/1748-9326/8/4/045001
___________________________
Arctic/North Atlantic atmospheric variability causes Severe PM10 events in South Korea
2024
https://www.sciencedirect.com/science/article/pii/S0048969723083444
___________________________
Further Development of Atmosphere Pressure Field Research in the Arctic Region of Russia
January 2021
___________________________
The Alaskan Arctic regime shift since 2017: A harbinger of years to come?
2022
https://www.sciencedirect.com/science/article/pii/S1873965222000913
___________________________
Concurrent Heat Extremes in Relation to Global Warming, High Atmospheric Pressure and Low Soil Moisture in the Northern Hemisphere
08 January 2025
https://agupubs.onlinelibrary.wiley.com/doi/10.1029/2024EF005256
___________________________
From the katabatic to the polar vortex
___________________________
List of atmospheric pressure records in Europe
https://en.wikipedia.org/wiki/List_of_atmospheric_pressure_records_in_Europe
___________________________
Record winter winds in 2020/21 drove exceptional Arctic sea ice transport
03 August 2021
Abstract
The volume of Arctic sea ice is in decline but exhibits high interannual variability, which is driven primarily by atmospheric circulation. Through analysis of satellite-derived ice products and atmospheric reanalysis data, we show that winter 2020/21 was characterised by anomalously high sea-level pressure over the central Arctic Ocean, which resulted in unprecedented anticyclonic winds over the sea ice. This atmospheric circulation pattern drove older sea ice from the central Arctic Ocean into the lower-latitude Beaufort Sea, where it is more vulnerable to melting in the coming warm season. We suggest that this unusual atmospheric circulation may potentially lead to unusually high summer losses of the Arctic’s remaining store of old ice.
https://www.nature.com/articles/s43247-021-00221-8
___________________________
Arctic Ocean circulation, processes and water masses: A description of observations and ideas with focus on the period prior to the International Polar Year 2007–2009
2013
https://www.sciencedirect.com/science/article/abs/pii/S0079661113002255
___________________________
Atmospheric pressure changes in the Arctic from 1801 to 1920
___________________________
The Physics Of Double-Diffusive Convection In The Arctic Ocean
2021
https://elischolar.library.yale.edu/gsas_dissertations/409/
___________________________
The Role of Atmospheric Blocking in Regulating Arctic Warming
06 June 2022
Abstract
Using
ERA5 reanalysis we find positive trends in poleward transport of
moisture and heat during 1979–2018 over the winter Barents Sea sector
and summer East Siberian Sea sector. The increase in blocking occurrence
(blocking days) can explain these trends. Blocking occurrence over the
Barents Sea sector significantly increased in the last 40 winters,
inducing increasingly stronger poleward transport of moisture and heat.
The high linear correlation between poleward energy transports and
temperature over the Barents Sea sector suggests that poleward energy
transports dominate the regional warming trend there. Meanwhile, in
summer, more frequently occurring blocking over the Beaufort Sea sector
causes a positive trend of poleward moist and heat transport over the
East Siberian Sea sector. The high linear correlation between the
blocking occurrence and temperature suggests that the increasing
shortwave radiation and subsidence within the more frequently occurring
blocking contribute to the regional warming trend.
https://agupubs.onlinelibrary.wiley.com/doi/10.1029/2022GL097899
___________________________
Nonconservative behavior of dissolved organic carbon across the Laptev and East Siberian seas
30 December 2010
Climate change is expected to have a strong effect on the Eastern
Siberian Arctic Shelf (ESAS) region, which includes 40% of the Arctic
shelves and comprises the Laptev and East Siberian seas. The largest
organic carbon pool, the dissolved organic carbon (DOC), may change
significantly due to changes in both riverine inputs and transformation
rates; however, the present DOC inventories and transformation patterns
are poorly understood. Using samples from the International Siberian
Shelf Study 2008, this study examines for the first time DOC removal in
Arctic shelf waters with residence times that range from months to
years. Removals of up to 10%–20% were found in the Lena River estuary,
consistent with earlier studies in this area, where surface waters were
shown to have a residence time of approximately 2 months. In contrast,
the DOC concentrations showed a strong nonconservative pattern in areas
with freshwater residence times of several years. The average losses of
DOC were estimated to be 30%–50% during mixing along the shelf,
corresponding to a first-order removal rate constant of 0.3 yr−1.
These data provide the first observational evidence for losses of DOC
in the Arctic shelf seas, and the calculated DOC deficit reflects DOC
losses that are higher than recent model estimates for the region.
Overall, a large proportion of riverine DOC is removed from the surface
waters across the Arctic shelves. Such significant losses must be
included in models of the carbon cycle for the Arctic Ocean, especially
since the breakdown of terrestrial DOC to CO2 in Arctic shelf
seas may constitute a positive feedback mechanism for Arctic climate
warming. These data also provide a baseline for considering the effects
of future changes in carbon fluxes, as the vast northern carbon-rich
permafrost areas draining into the Arctic are affected by global
warming.
https://agupubs.onlinelibrary.wiley.com/doi/full/10.1029/2010GB003834
___________________________
Impact
of a decreasing sea ice cover on the vertical export of particulate
organic carbon in the northern Laptev Sea, Siberian Arctic Ocean
10 November 2009
https://www.cambridge.org/core/journals/journal-of-glaciology/article/meso-and-microscale-seaice-motion-in-the-east-siberian-sea-as-determined-from-ers1-sar-data/E0A7D4458296C2D4D0F6A331436EC69D
___________________________
Deglacial sea level history of the East Siberian Sea and Chukchi Sea margins
October 31, 2017
https://www.usgs.gov/publications/deglacial-sea-level-history-east-siberian-sea-and-chukchi-sea-margins
___________________________
Arctic methane deposits 'starting to release', scientists say
27 Oct 2020
Exclusive:
expedition says preliminary findings indicate that new source of
greenhouse gas off East Siberian coast has been triggered
https://www.theguardian.com/science/2020/oct/27/sleeping-giant-arctic-methane-deposits-starting-to-release-scientists-find
___________________________
Arctic warming interrupts the Transpolar Drift and affects long-range transport of sea ice and ice-rafted matter
02 April 2019
https://www.nature.com/articles/s41598-019-41456-y/
___________________________
On carbon transport and fate in the East Siberian Arctic land–shelf–atmosphere system
4 January 2012
https://iopscience.iop.org/article/10.1088/1748-9326/7/1/015201
___________________________
The effect of estuarine system on the meiofauna and nematodes in the East Siberian Sea
29 September 2021
https://www.nature.com/articles/s41598-021-98641-1
___________________________
HBIs and Sterols in Surface Sediments Across the East Siberian Sea: Implications for Palaeo Sea-Ice Reconstructions
2021
https://agupubs.onlinelibrary.wiley.com/doi/epdf/10.1029/2021GC009940
___________________________
Radiocarbon of quaternary along shore and bottom deposits of the Lena and the Laptev Sea sediments
1996
https://www.sciencedirect.com/science/article/abs/pii/0304420395000968
___________________________
Neodymium isotopes in seawater from the Barents Sea and Fram Strait Arctic-Atlantic gateways
June 2008
https://www.researchgate.net/publication/228906281_Neodymium_isotopes_in_seawater_from_the_Barents_Sea_and_Fram_Strait_Arctic-Atlantic_gateways
___________________________
Pathways
of Siberian freshwater and sea ice in the Arctic Ocean traced with
radiogenic neodymium isotopes and rare earth elements
December 2017
https://www.researchgate.net/publication/322473914_Pathways_of_Siberian_freshwater_and_sea_ice_in_the_Arctic_Ocean_traced_with_radiogenic_neodymium_isotopes_and_rare_earth_elements
___________________________
Sources of Bottom Sediments in the Eastern Part of East Siberian Sea (Reconstruction from Geochemical Data)
23 September 2021
https://link.springer.com/article/10.1134/S000143702104010X
___________________________
Ice events along the East Siberian continental margin during the last two glaciations: Evidence from clay minerals
2020
https://www.sciencedirect.com/science/article/abs/pii/S0025322720301778
___________________________
Influence of high-latitude atmospheric circulation changes on summertime Arctic sea ice
2017
Abstract
The
Arctic has seen rapid sea-ice decline in the past three decades, whilst
warming at about twice the global average rate. Yet the relationship
between Arctic warming and sea-ice loss is not well understood. Here, we
present evidence that trends in summertime atmospheric circulation may
have contributed as much as 60% to the September sea-ice extent decline
since 1979. A tendency towards a stronger anticyclonic circulation over
Greenland and the Arctic Ocean with a barotropic structure in the
troposphere increased the downwelling longwave radiation above the ice
by warming and moistening the lower troposphere. Model experiments, with
reanalysis data constraining atmospheric circulation, replicate the
observed thermodynamic response and indicate that the near-surface
changes are dominated by circulation changes rather than feedbacks from
the changing sea-ice cover. Internal variability dominates the Arctic
summer circulation trend and may be responsible for about 30–50% of the
overall decline in September sea ice since 1979.
https://www.nature.com/articles/s41467-017-00552-1
___________________________
The Impact of Arctic Winter Infrared Radiation on Early Summer Sea Ice
2015
http://www.personal.psu.edu/sxl31/papers/HS_Park_2.pdf
___________________________
East Siberian Sea
https://en.wikipedia.org/wiki/East_Siberian_Sea
___________________________
Chukchi Plateau
The
Chukchi Plateau or Chukchi Cap is a large subsea formation extending
north from the Alaskan margin into the Arctic Ocean. The ridge is
normally covered by ice year-round, and reaches an approximate
bathymetric prominence of 3,400 m with its highest point at 246 m below
sea level.[1] As a subsea ridge extending from the continental shelf of
the United States north of Alaska, the Chukchi Plateau is an important
feature in maritime law of the Arctic Ocean and has been the subject of
significant geographic research. The ridge has been extensively mapped
by the USCGC Healy, and by the Canadian icebreaker CCGS Louis S.
St-Laurent (with the Healy) in 2011 and RV Marcus Langseth, a National
Science Foundation vessel operated by the Lamont–Doherty Earth
Observatory of Columbia University.
Geology
The cap is normally ice-covered, year-round.[2] The cap lies roughly about 800 kilometres north of the Point Barrow, Alaska.[3] The area is notable because it is believed to be rich in natural resources (especially oil, natural gas and manganese).
The geologic history of Arctic Ocean basins is a major source of debate among marine geophysicists. The difficulties associated with collecting marine geologic and geophysical data in this remote region has added to the debate on the tectonic history of the Arctic Ocean and the formation of its bathymetric features.
The Chukchi Borderland, which comprises the subsea region north of the Alaskan coast as well as the bathymetric highs of the Chukchi Plateau and the adjacent Northwind Ridge, is a continental fragment that is thought to have drifted from the Canadian continental margin.[4] The geomorphology of the region is defined by north–south trending normal faulting[5] –tectonic activity typical of continental rifting.
Although there is no consensus as to the pre-rift location of the Chukchi Borderland, its tectonic migration could be attributed to an inferred spreading center indicated by a linear gravity low in the Canada Basin [citation needed]. Sediments transported from the Mackenzie River Delta would have buried the spreading center. The Chukchi Plateau, which could have been connected to Canada in the vicinity of Ellesmere Island, would have rifted along the spreading center to its current location.[6] A competing hypothesis suggests that the Chukchi Plateau may have once been attached to the Siberian shelf.
The Chukchi Plateau also shows substantial evidence of pockmarks, which indicates subsurface hydrocarbon activity...
https://en.wikipedia.org/wiki/Chukchi_Plateau
___________________________
Holocene
variability in sea ice cover, primary production, and Pacific-Water
inflow and climate change in the Chukchi and East Siberian Seas (Arctic
Ocean)
https://epic.awi.de/id/eprint/44567/
___________________________
Pelagic Methane Oxidation in the Northern Chukchi Sea
https://aslopubs.onlinelibrary.wiley.com/doi/am-pdf/10.1002/lno.11254
___________________________
Mechanisms of Persistent High Primary Production During the Growing Season in the Chukchi Sea
18 September 2020
https://link.springer.com/article/10.1007/s10021-020-00559-8
___________________________
Interior Department Releases Updated Assessment for Chukchi Sea Lease Sale
2/12/2015
Key Step in Resolving 2008 Oil and Gas Leasing Offshore Alaska
https://www.doi.gov/news/pressreleases/interior-department-releases-updated-assessment-for-chukchi-sea-lease-sale
___________________________
Debris from Melting Shelves Changing the Biology and Chemistry of the Arctic Ocean
February 12, 2018
https://www.fondriest.com/news/debris-melting-shelves-changing-biology-chemistry-arctic-ocean.htm
___________________________
REE–Th Systematics of the Suspended Particulate
Matter and Bottom Sediments from the Mouth Zones of the World Rivers of
Different Categories/Classes and Some Large Russian Arctic Rivers
18 April 2019
https://link.springer.com/article/10.1134/S0016702919010075
___________________________
Sources
and burial fluxes of sedimentary organic carbon in the northern Bering
Sea and the northern Chukchi Sea in response to global warming
2019 Apr 26
https://pubmed.ncbi.nlm.nih.gov/31082605/
___________________________
Rates of nitrification and ammonium dynamics in northeastern Chukchi Sea shelf waters
2014
https://www.academia.edu/16095735/Rates_of_nitrification_and_ammonium_dynamics_in_northeastern_Chukchi_Sea_shelf_waters
___________________________
Increases
in Benthic Particulate Export and Sedimentary Denitrification in the
Northern Chukchi Sea Tied to Under-Ice Primary Production
17 January 2022
https://agupubs.onlinelibrary.wiley.com/doi/10.1029/2021JC018110
___________________________
Dissolved
and Particulate Phosphorus Distributions and Elemental Stoichiometry
Throughout the Chukchi Sea Elemental Stoichiometry Throughout the
Chukchi Sea
2015
https://scholarcommons.sc.edu/cgi/viewcontent.cgi?article=4684&context=etd
___________________________
Variations
in the Carbon and Nitrogen Isotope Composition of the Crabs
Chionoecetes opilio (Fabricius, 1788) and Hyas coarctatus Leach, 1816
(Crustacea: Decapoda) from the Chukchi Sea
04 April 2018
https://link.springer.com/article/10.1134/S106307401801008X
___________________________
High biomass turnover rates of endosymbiotic nitrogen-fixing cyanobacteria in the western Bering Sea
05 July 2022
https://aslopubs.onlinelibrary.wiley.com/doi/10.1002/lol2.10267?af=R
___________________________
Diazotroph community structure and the role of nitrogen fixation in the nitrogen cycle in the Chukchi Sea (western Arctic Ocean)
21 May 2018
https://aslopubs.onlinelibrary.wiley.com/doi/full/10.1002/lno.10933
___________________________
A potential nitrogen sink discovered in the oxygenated Chukchi Shelf waters of the Arctic
20 September 2017
https://geochemicaltransactions.biomedcentral.com/articles/10.1186/s12932-017-0043-2
___________________________
On the circulation, water mass distribution, and nutrient concentrations of the western Chukchi Sea
2022-01-05
https://www.osti.gov/biblio/1839056
___________________________
Sources
and burial fluxes of sedimentary organic carbon in the northern Bering
Sea and the northern Chukchi Sea in response to global warming
2019 Apr 26
https://pubmed.ncbi.nlm.nih.gov/31082605/
___________________________
Aspects of the marine nitrogen cycle of the Chukchi Sea shelf and Canada Basin
2015
https://www.sciencedirect.com/science/article/abs/pii/S0967064515000387
___________________________
Tritium and plutonium in waters from the Bering and Chukchi Seas
1999
https://www.osti.gov/biblio/20001055
___________________________
Distribution of organochlorine pesticides in seawater of the Bering and Chukchi Sea
2001
https://www.sciencedirect.com/science/article/abs/pii/S0269749101001348
___________________________
Chiral pesticides in soil and water and exchange with the atmosphere.
08 Feb 2002
https://europepmc.org/article/PMC/PMC6009253
___________________________
Legacy
contaminants in the eastern Beaufort Sea beluga whales (Delphinapterus
leucas): are temporal trends reflecting regulations?
12 February 2018
https://cdnsciencepub.com/doi/full/10.1139/as-2017-0049
___________________________
Concentrations
of polychlorinated biphenyls (PCB's), chlorinated pesticides, and heavy
metals and other elements in tissues of belugas, Delphinapterus leucas,
from Cook Inlet, Alaska.
Jun 22, 2000
https://www.thefreelibrary.com/Concentrations+of+polychlorinated+biphenyls+(PCB%27s)%2C+chlorinated...-a089816667
___________________________
The Human Hunting Tools Hidden In Yukon For 9,000 Years | Secrets From The Ice | Odyssey
Dec 21, 2021
https://www.youtube.com/watch?v=WNq_pqUEcb8
___________________________
Abundance and sinking of particulate black carbon in the western Arctic and Subarctic Oceans
15 July 2016
https://www.nature.com/articles/srep29959
___________________________
True North vs. Magnetic North
October 25 2016
In 1908, US Navy engineer Robert Peary claimed to be the first person to reach the North Pole.
Equipped only with wooden sleds and dogs, Peary and his team trekked
across the frozen waters of the Arctic Ocean, arriving at the point in
early April. However, Peary’s claim has been met with much skepticism.
Many critics say the team was not equipped with enough navigational
instruments, others say Peary was simply lying.
Two North Poles?
But there is another discrepancy for which we must account. That is to say, which North
Pole did Peary allegedly discover? As it turns out, there are actually
two North Poles on planet Earth. What Peary and other explorers sought
to discover was True North,
also known as terrestrial or geographic North. This is a fixed point in
the middle of the Arctic Ocean at 90°N latitude. Here, every direction
is south. While this point helps us justify maps and gives Santa Claus a
place to live, it has little bearing on Earth’s geologic history.
For that we must turn to Magnetic North.
Unlike True North, Magnetic North depends on more than just
cartography. Magnetic North is the point where the Earth’s magnetic
field points straight south. In other words, it Earth is a giant magnet
(which it is), magnetic north is the true north pole, directly opposite
of the south pole like on any bar magnet.
What Does Magnetic North Do?
As it turns, Magnetic North is much more
important than True North. The Magnetic North pole is also known as a
“dip pole” and, along with Magnetic South, is where the Earth’s magnetic
field is at its weakest. This is one reason the auroras borealis and australis
are more visible closer to their respective ends of the Earth. Auroras
are created by solar wind, but the Earth’s magnetosphere usually
deflects them before they can close enough to do any damage. At Magnetic
North, they are able to get much closer and light particles are
scrambled in Earth’s atmosphere. Thus, the Northern Lights are born.
Perhaps one of the most significant things about Magnetic North, is its effect on navigation. When you use a compass,
the needle is attracted to Magnetic North, not True North. That means
if you walk in the northerly direction indicated by your compass, you’ll
wind up miss the True North Pole by a few hundred miles! The only time a
compass will point to True North is when it is directly in line with
Magnetic North. This is called declination. To take advantage of this, you’d have to start your journey in the middle of Lake Superior!
Set Adrift
Another key way Magnetic North differs
from True North is that its location actually moves! True North is so
named because it never moves. It will always be at 90°N latitude.
However, Magnetic North is free to roam. The polar shift is due to
changes in magnetic activity deep within the Earth’s core. As the core’s
magnetic field shifts, so does the pole. The image above shows just how
drastically has shifted. While it is currently situated off the coast
of Canada’s Ellesmere Island, by 2020, Magnetic North is expected to
drift as far away as Russia. This phenomenon is known as Polar Drift.
While we don’t advise attempting to walk
to the Magnetic North pole, you can still test directions and Earth’s
magnetism by building your own compass.
https://www.apexmagnets.com/news-how-tos/true-north-vs-magnetic-north/
___________________________
Massive asteroid hit Greenland when it was a lush rainforest, under-ice crater shows
March 15, 2022

https://www.livescience.com/greenland-hiawatha-crater-age
___________________________
Evidence of Earth's ancient magma ocean discovered in Greenland
March 14, 2021
Scientists have discovered something interesting in Greenland that provides evidence that much of the Earth was once entirely molten rock. The evidence came from eons-old rocks found in southern Greenland. Researchers say that little is known about the Earth and conditions on the planet during the Hadean Eon. This period characterized the initial formation of the Earth and the stabilization of the core and crust of the planet.
Read More: https://www.slashgear.com/evidence-of-earths-ancient-magma-ocean-discovered-in-greenland-14663592/
https://www.slashgear.com/evidence-of-earths-ancient-magma-ocean-discovered-in-greenland-14663592
___________________________
Researchers track changes in Greenland ice core dust over the past 100 years
2021
The Holocene epoch (from about 11,000 years ago to today) has been a period of low dust concentration, making it hard for dust in ice core samples to be used for geochemical analyses over the past 100 years. But Japanese researchers have applied a relatively new technique to analyze ice core samples from Greenland covering the past century for the first time, enabling a temporal resolution of increments of just five years.
For the first time, researchers have been able to discover the pattern of mineral composition of dust in ice core samples from Greenland over the past 100 years and at a resolution of increments of just five years. Previously, similar analyses had been unable to achieve a resolution shorter than hundreds of thousands of years due to the need for greater concentrations of isotopes in the minerals in the dust.
The technique and findings are described in a paper appearing in the journal Climate of the Past on June 21.
Dust blown by the wind and landing on snow and ice on ice sheets (massive continental glaciers covering much of Antarctica and Greenland) that collects over time can provide rich information about the past when retrieved in ice cores by scientists.
These ice-core dust records have provided substantial data on variations in the concentration, composition, particle size and shape (morphology) of the minerals that make up dust particles, which in turn can tell us much about where they come from and thence about historic climate change. This is because the variability in the dust over time is affected by changes in the terrestrial sources of the dust and atmospheric transport of dust as a result of temperature changes.
However, such work has primarily been performed by researchers on dust minerals covering timescales on the order of the swings between glacial and interglacial periods (in essence, ice ages and the warmer periods between them)—roughly about 800,000 years.
This is because geochemical analyses of the minerals in the dust depend upon the ratios of different isotopes of elements such as strontium, neodymium and lead. The isotopic ratios in a sample have strong regional variations controlled by their geological origins, and so can help tell us a dust particle’s geographic origin.
However, isotopic analyses require a large number of samples, and so researchers have mostly used ice core dust from glacial periods where there has been a high dust concentration. But the Holocene epoch (from about 11,000 years ago to today) has been a period of low dust concentration. As a result, each sample for this period has required thousands of years’ worth of deposition of ice just to gather enough dust to do the analysis. This is useful for descriptions of changes of long periods of time, but not for changes over the last century.
In recent years, two techniques, scanning electron microscopy (SEM) and energy-dispersive X-ray spectroscopy (EDS), have enabled scientists to reveal the source of ice core dust samples with low amounts of mineral dust. The first technique gives them morphological information about the minerals (in essence their shape) as a whole rather than the isotopes of the atoms within them, and EDS tells them about the mineral composition of individual dust particles.
“SEM-EDS analysis has been demonstrated to deliver a high temporal resolution record of the composition and sources of ice core minerals, which is a great improvement over earlier techniques,” said Naoko Nagatsuka, a researcher with Japan’s National Institute of Polar Research and lead author of the study.
“But it has only been used for two or three ice core analyses. Variations in the dust properties of Greenland ice cores for recent years have remained largely unknown.”
The team used SEM-EDS analysis to describe variations in the sources of minerals in dust from a Greenland ice core covering a century-long period (1915-2013), and with a resolution of just five years.
They found that the composition varied substantially over the decades. Kaolinite, a clay mineral that tends to form in warm and humid climatic zones, was abundant in the core during colder periods over the past century. Meanwhile quartz, chlorite, mica, feldspars and mafic minerals (those with higher concentrations of iron and magnesium)—grains of which are weathered and eroded from rock in more arid, high-altitude regions and also from more local areas in Greenland—were abundant in warmer periods.
Comparison of this information to Greenland surface temperature records indicates that this multi-decadal variation in the relative abundance of these different minerals was likely affected by local temperature changes on the island. The minerals were transported mainly from its west coast during the two warming periods (1915-1949 and 2005-2013). This, in turn, was likely due to an increase in dust sourced from ice-free areas due to a shorter duration of snow and ice cover in Greenland’s coastal region during the melt season caused by recent global warming. Meanwhile, the researchers reckon that ancient deposits from northern Canada, which were formed in past warmer climates, are the best candidate for the geographic source of minerals that landed on Greenland ice sheet during the colder period (1950-2000).
The researchers now want to extend this technique for detecting variations in ice core dust sources during recent periods of low dust concentration to other parts of Greenland and beyond.
https://www.nipr.ac.jp/english/info/notice/20211109.html
___________________________
Electrowinning of neodymium from a molten oxide-fluoride electrolyte
1994
https://stacks.cdc.gov/view/cdc/10116
___________________________
Mining magnets: Arctic island finds green power can be a curse
March 2, 2021
https://www.reuters.com/article/us-rareearths-greenland-usa-china-insigh-idUSKBN2AU0FM
___________________________
Greenland Minerals says it is focused on rare earths, not uranium
April 9, 2021
https://www.mining.com/web/greenland-minerals-says-it-is-focused-on-rare-earths-not-uranium/
___________________________
Detrital neodymium and (radio)carbon as complementary sedimentary bedfellows? The Western Arctic Ocean as a testbed
2021
https://www.sciencedirect.com/science/article/pii/S0016703721004968
___________________________
The distribution of neodymium isotopes in Arctic Ocean basins
2009
http://www.diva-portal.org/smash/record.jsf?pid=diva2%3A1050190&dswid=-6150
___________________________
Seawater-Particle Interactions of Rare Earth Elements and Neodymium Isotopes in the Deep Central Arctic Ocean
15 July 2021
https://agupubs.onlinelibrary.wiley.com/doi/10.1029/2021JC017423
___________________________
Decoupling of dissolved and bedrock neodymium isotopes during sedimentary cycling
2018
https://www.geochemicalperspectivesletters.org/article1828/
___________________________
Neodymium isotopes in seawater from the Barents Sea and Fram Strait Arctic–Atlantic gateways
2008
https://www.sciencedirect.com/science/article/abs/pii/S0016703708001865
___________________________
Controlling
factors and impacts of river-borne neodymium isotope signatures and
rare earth element concentrations supplied to the Canadian Arctic
Archipelago
2021
https://www.sciencedirect.com/science/article/pii/S0012821X21005975
___________________________
Neodymium
Neodymium is a chemical element; it has symbol Nd and atomic number 60. It is the fourth member of the lanthanide series and is considered to be one of the rare-earth metals. It is a hard, slightly malleable, silvery metal that quickly tarnishes in air and moisture. When oxidized, neodymium reacts quickly producing pink, purple/blue and yellow compounds in the +2, +3 and +4 oxidation states. It is generally regarded as having one of the most complex spectra of the elements.[9] Neodymium was discovered in 1885 by the Austrian chemist Carl Auer von Welsbach, who also discovered praseodymium. Neodymium is present in significant quantities in the minerals monazite and bastnäsite. Neodymium is not found naturally in metallic form or unmixed with other lanthanides, and it is usually refined for general use. Neodymium is fairly common—about as common as cobalt, nickel, or copper—and is widely distributed in the Earth's crust.[10] Most of the world's commercial neodymium is mined in China, as is the case with many other rare-earth metals.
Neodymium compounds were first commercially used as glass dyes in 1927 and remain a popular additive. The color of neodymium compounds comes from the Nd3+ ion and is often a reddish-purple. This color changes with the type of lighting because of the interaction of the sharp light absorption bands of neodymium with ambient light enriched with the sharp visible emission bands of mercury, trivalent europium or terbium. Glasses that have been doped with neodymium are used in lasers that emit infrared with wavelengths between 1047 and 1062 nanometers. These lasers have been used in extremely high-power applications, such as in inertial confinement fusion. Neodymium is also used with various other substrate crystals, such as yttrium aluminium garnet in the Nd:YAG laser.
Neodymium alloys are used to make high-strength neodymium magnets, which are powerful permanent magnets.[11] These magnets are widely used in products like microphones, professional loudspeakers, in-ear headphones, high-performance hobby DC electric motors, and computer hard disks, where low magnet mass (or volume) or strong magnetic fields are required. Larger neodymium magnets are used in electric motors with a high power-to-weight ratio (e.g., in hybrid cars) and generators (e.g., aircraft and wind turbine electric generators).
https://en.wikipedia.org/wiki/Neodymium
___________________________
Neodymium isotopes trace marine provenance of Arctic sea ice
10 June 2022
https://www.geochemicalperspectivesletters.org/article2220/
___________________________
The distribution of neodymium isotopes in Arctic Ocean basins
2009
https://www.sciencedirect.com/science/article/abs/pii/S0016703709000933
___________________________
Constraints on the source of reactive phases in sediment from a major Arctic river using neodymium isotopes
2021
https://www.sciencedirect.com/science/article/abs/pii/S0012821X21001928
___________________________
Greenland-sourced freshwater traced by radiogenic neodymium isotopes and rare earth elements on the North-East Greenland Shelf
2018
https://goldschmidtabstracts.info/2018/1419.pdf
___________________________
Pre-modern Arctic Ocean circulation from surface sediment neodymium isotopes
04 March 2013
https://agupubs.onlinelibrary.wiley.com/doi/full/10.1002/grl.50188
___________________________
Pathways
of Siberian Freshwater and Sea Ice in the Arctic Ocean Traced with
Radiogenic Neodymium Isotopes and Rare Earth Elements
December 2017
https://www.researchgate.net/publication/322473914_Pathways_of_Siberian_freshwater_and_sea_ice_in_the_Arctic_Ocean_traced_with_radiogenic_neodymium_isotopes_and_rare_earth_elements
___________________________
Neodymium isotopes trace marine provenance of Arctic sea ice
June 2022
https://www.researchgate.net/publication/361216236_Neodymium_isotopes_trace_marine_provenance_of_Arctic_sea_ice
___________________________
Martian core composition from experimental high-pressure metal-silicate phase equilibria
11 May 2022
https://www.geochemicalperspectivesletters.org/article2216/
___________________________
Clay mineralogy, strontium and neodymium isotope ratios in the sediments of two High Arctic catchments (Svalbard)
September 2017
https://www.researchgate.net/publication/319920269_Clay_mineralogy_strontium_and_neodymium_isotope_ratios_in_the_sediments_of_two_High_Arctic_catchments_Svalbard
___________________________
Development of new magnet that reduces use of rare-earth element by 30%
April 22, 2022
https://phys.org/news/2022-04-magnet-rare-earth-element.html
___________________________
The distribution of neodymium isotopes in Arctic Ocean basins
2009
https://www.geomar.de/fileadmin/personal/fb1/p-oz/mfrank/Porcelli_et_al_2009.pdf
___________________________
Variations
in the neodymium and strontium isotopic composition and REE content of
molluscan shells from the Cretaceous Western Interior seaway
Aug 1993
https://experts.illinois.edu/en/publications/variations-in-the-neodymium-and-strontium-isotopic-composition-an
___________________________
[Insights] China’s Rare Earth Export Restrictions Sound Alarm for Global Tech Industry
2025-06-25
You may not have heard of terbium or dysprosium, but these elements are essential to modern technology. From electric vehicle motors and wind turbines to military-grade lasers and the tiny vibration motors inside smartphones, their operation relies on rare earth elements.
In recent years, as global tech competition intensifies and geopolitical risks rise, rare earths have increasingly become a critical source of leverage in international power struggles, a trend that became especially evident after China imposed export controls on certain rare earth products in 2025.
What Are Rare Earths—and Why Do They Matter?
Rare earths refer to a group of 17 metallic elements with similar chemical properties. Although they are not truly rare in the Earth’s crust, the extraction process is complex, costly, and highly polluting—making stable large-scale production possible in only a few countries.
These elements are widely used in high-tech industries, including electric vehicles, industrial robots, drones, low-Earth orbit satellites, renewable energy equipment, and even military and aerospace technologies.
China’s Grip on the Global Rare Earth Supply Chain
China wields strategic influence over the rare earth market primarily because of its overwhelming dominance across the global supply chain:
- Largest reserves: China holds nearly half of the world’s known rare earth reserves.
- Top producer: In 2024, China accounted for nearly 70% of global rare earth production.
- Monopoly on processing: Most rare earths mined around the world still need to be sent to China for separation and refining before they can be used as functional materials.
China’s dominance stems not only from its resource abundance but also from its integration of upstream and midstream industries. As rare earth refining is highly polluting, many Western countries have exited the sector, enabling China to establish a commanding lead in processing capacity.
In other words, even if other countries discover rare earth deposits, without the ability to process them independently, they remain reliant on China.
Export Controls: China Officially Plays the Rare Earth Card
In April 2025, China announced the implementation of an export licensing system for seven rare earth-related products—samarium, gadolinium, terbium, dysprosium, lutetium, scandium, and yttrium. Most of these elements are classified as heavy rare earths, which are difficult to mine, require advanced separation technologies, and are critical for high-end magnetic materials, laser equipment, and aerospace alloys.
The restrictions have exposed the global supply chain’s heavy dependence on China. While countries like the U.S., Japan, and Australia have launched initiatives such as the Minerals Security Partnership (MSP) and the Critical Minerals Agreement (CMA) to develop China-free supply networks, significant technical barriers and long investment cycles—particularly in midstream segments like separation and processing—mean these efforts will likely take another 3 to 5 years to materialize. In the short term, China’s dominant position remains largely unchallenged.
Scenarios That Could Escalate the Global Rare Earth Disruption
According to a recent report by TrendForce, if China’s export controls target specific countries—such as the U.S.—while still permitting a certain level of exports, the resulting pressure on global markets may not fully emerge until after 2026. However, if the restrictions are broadened to include other major high-tech manufacturing nations such as Europe, Japan, and Australia, the global impact could become apparent as early as the second half of 2025 and may persist until around 2030 before easing.
It’s also worth noting that such export restrictions are not a zero-cost strategic move. China’s own industries—such as electric vehicles, drones, and automation—also depend heavily on a stable rare earth supply chain. As a result, China is more likely to adopt a selective and targeted export strategy as a tool for geopolitical negotiation, rather than enforce a blanket ban.
___________________________
China has stopped exporting rare earths to everyone, not just the U.S., cutting off critical materials for tech, autos, aerospace, and defense
April 14, 2025
That’s because any exports of the minerals and magnets now require special licenses, but Beijing has yet to fully establish a system for issuing them, the report said.
In the meantime, shipments of rare earths have been halted at many ports, with customs officials blocking exports to any country, including to the U.S. as well as Japan and Germany, sources told the Times. China’s Ministry of Commerce issued export restrictions alongside the General Administration of Customs, prohibiting Chinese businesses from any engagement with U.S. firms, especially defense contractors.
While the Trump administration unveiled tariff exemptions on a range of key tech imports late Friday night, China’s magnet exports were still halted through the weekend, industry sources told the Times.
Beijing’s export halt is notable because China has a stranglehold on global supplies of rare earths and magnets derived from them.
They also represent an asymmetric advantage in that rare earths constitute a small share of China’s exports but have an outsize impact on trade partners like the U.S., which relies on them as critical inputs for the auto, chip, aerospace, and defense industries.
“The purpose of the Chinese government’s lawful implementation of these export controls is to better safeguard national security and interests, and to fulfill international obligations related to non-proliferation,” China’s U.S. embassy said in a statement. “These rare earth materials have dual-use potential for both civilian and military applications, and imposing export controls on such items is a common international practice.”
National Economic Council Director Kevin Hassett addressed the situation on Monday, acknowledging concern and saying, “Rare earths are a part of lots of the economy.”
“The rare earth limits are being studied very carefully, and they’re concerning, and we’re thinking about all the options right now,” he told reporters outside the White House.
China’s export restrictions also put Trump’s attempts to gain control of Greenland in a fresh light. The self-governing Danish island possesses one of the world’s largest known rare earth deposits.
Vice President JD Vance visited Greenland earlier this month, despite repeated pushback from Denmark against U.S. rhetoric.
“We need Greenland for national security and even international security, and we’re working with everybody involved to try and get it,” Trump said in an address to Congress last month.
Meanwhile, Trump has also been pursuing a deal with Ukraine to develop rare earth supplies. He said in February he wanted “the equivalent of, like, $500 billion worth of rare earths.” Those talks are ongoing.
Last month, Trump signed an executive order that directed federal agencies to identify mines and government-owned land that could help increase rare earth production.
The Trump administration is also drafting another executive order to clear the way for stockpiling deep-sea metals to offset China’s control of rare earth supply chains, sources told the Financial Times.
https://fortune.com/2025/04/14/china-rare-earth-exports-halt-trump-trade-war-tariff-retaliation/
___________________________
China, Rare Earth Elements, and the Arctic: Assessing Security Implications for Canada
June 9, 2025
https://www.queensu.ca/cidp/china-rare-earth-elements-and-arctic-assessing-security-implications-canada
___________________________
A new Cold War: mining geopolitics in the Arctic circle
December 10, 2020
Arctic ice is melting and unveiling new opportunities for shipping routes and potential mineral claims. With China, Russia, and the US all eyeing a share of the Arctic’s abundant natural resources, we look at the geopolitical situation around the North Pole, and what lies ahead for mineral exploitation in the region.
https://www.mining-technology.com/features/a-new-cold-war-mining-geopolitics-in-the-arctic-circle/
___________________________
Why it's nearly impossible for America to meet its rare-earth needs after China's export restrictions
Apr 16, 2025
https://www.morningstar.com/news/marketwatch/20250416183/why-its-nearly-impossible-for-america-to-meet-its-rare-earth-needs-after-chinas-export-restrictions
U.S. inaction on rare earths gives China 'very powerful currency at the negotiating table,' says CSIS researcher
A previous version of this story identified Luisa Moreno as president of Defense Metals Corp. She is the former president and current director of the company.
China has managed to hit the U.S. where it hurts the most in response to the Trump administration's tariffs, with restrictions on global exports of seven rare-earth elements that the U.S. has little ability to produce or refine.
In the near term, it's not possible for the U.S. to meet its own needs for the rare earths included under China's export restrictions, said Luisa Moreno, a director at Defense Metals Corp. (CA:DEFN), a mineral-exploration firm focused on the acquisition of rare-earth mineral deposits.
The U.S. produces virtually "none of the materials that have just been restricted," and China cannot be completely replaced as provider for these, she said. The U.S. can try to source some of these materials from other countries, but that is not really an option for the "heavy" rare earths - which have a higher atomic number, are less abundant and are more difficult to extract.
What has happened
Earlier this month, China implemented "export control measures" on certain rare earths: samarium, gadolinium, terbium, dysprosium, lutetium, scandium and yttrium.
In a tweet, China's Ministry of Commerce said it aims to better safeguard national security and interests, wording reminiscent of U.S. President Donald Trump's executive order from March 20 to increase American production of critical minerals to enhance national security. The ministry's tweet did not mention the U.S. specifically, and according to reports, the export controls have led to a pause in global exports of these rare earths.
The fact that the export restrictions target heavy rare earths is "really significant, because China processes near 100%" of these, making the U.S. particularly vulnerable, said Gracelin Baskaran, research director at the Center for Strategic and International Studies, during a press briefing held on Zoom Tuesday. "We currently do not have any capability to do this domestically."
China's restrictions are not actually a ban on the exports of these rare earths to the United States, she said.
There's a "runway of export policies," Baskaran said, that generally start with "non-automatic licensing." That means Chinese exporters need to apply to get a license to export a given good. Next there are quotas and tariffs, and the final level of restriction would be a total ban.
The licensing system hasn't been rolled out, so there will be a pause in China's exports of these goods while that happens, she said.
Jena Santoro, senior manager of intelligence solutions at Everstream Analytics, said a short-term supply disruption is expected as exporters "apply for new licenses and shipments remain stuck at Chinese ports, while the government creates the new regulatory enforcement system."
It's expected to take at least 45 days from April 13 for new export licenses to be issued and shipments to resume as normal, she said.
Importance of rare earths
Rare earths have a wide range of technological uses. They are crucial components of smartphones, spacecraft, electric cars and medical devices such as magnetic resonance imaging machines.
Heavy rare earths, in particular, are "absolutely vital for our defense," said Baskaran. They're used in F-35 fighter jets, submarines and Tomahawk missiles.
China's move comes just weeks after the U.S. Air Force said it awarded a contract to Boeing (BA) to lead development of the F-47, the world's first sixth-generation fighter aircraft.
The F-35 combat aircraft requires more than 900 pounds of rare-earth elements, while an Arleigh Burke DDG-51 warship requires 5,200 pounds, and a Virginia-class nuclear-powered submarine needs 9,200 pounds, according to the U.S. Department of Defense.
Reuters reported on April 11 that Chinese exports of seven rare earths stopped on April 4. That helps explain the recent drop in the S&P 500 Aerospace & Defense stock index XX:SP500.20101010, according to a note Monday from Ed Yardeni, president of Yardeni Research. The index saw a nearly 6% decline from its record high on March 25 through the close on April 11.
Even before these restrictions, the U.S. defense sector "industrially has struggled with limited capacity and limited surge capacity to respond in the instance of conflict," Baskaran said.
These restrictions on rare earths "will only widen that gap," she said, because while the U.S. does have limited stockpiles, "they will not tide us over forever, and it enables China to strengthen its military capabilities faster than the United States. So that has profound consequences."
A lot of our "capabilities are quite nascent," said Baskaran. That was only "further compounded" in December 2023, when China banned the export of technologies for making rare-earth magnets, according to Reuters.
"It's not just a capital problem. It's a know-how problem" for the U.S. and other countries, Baskaran said. In the U.S., the Mountain Pass Rare Earth Mine, owned by MP Materials Corp. (MP), is the nation's only active rare-earth mining and processing facility.
The reality is that the U.S. produces less than 1% of the world's rare earths, said Baskaran.
And on the processing side, "there are parts of the rare-earths supply chain ... that we never actually learned how to do," such as the solvent extraction technology used to separate rare-earth elements, she said. "So there's an element of this getting up to speed on the technical side that we're doing in parallel to constructing capabilities, in addition to issuing the capital."
Dealing with China's dominance
Could the U.S have known that these issues would emerge given China's dominance in rare earths? The short answer is yes, according to Baskaran.
"We've had a long runway, and our inaction is ultimately giving China very, very powerful currency at the negotiating table," she said. Ultimately, the U.S. will "need to source rare earths from elsewhere."
'We've had a long runway, and our inaction is ultimately giving China very, very powerful currency at the negotiating table.'Gracelin Baskaran, CSIS
The Trump administration has a clear understanding of that, and acknowledges it, she said. "That's why we've seen rare earths feature prominently in the context of places like Ukraine and Greenland."
The Financial Times recently reported that the Trump administration is drafting an executive order to create stockpiles of deep-sea critical metals to offset China's dominance in the sector. Critical metals include rare earths, as well as other metals essential for economic and national security.
For the U.S. to be able to produce its own heavy rare earths, it may take five to 10 years in the best-case scenario, Defense Metals Corp.'s Moreno said.
The U.S. has to stay focused and continue to invest in companies like Australia's Lynas Rare Earths Ltd. (AU:LYC) and "upstream" industries such as exploration and production, she said.
For now, restrictions on these materials will lead to higher prices for consumer products that depend on them, including electric motors, toys, wind turbines, electric vehicles and medical equipment, Moreno said.
U.S. consumption of these materials is "largely indirect" because China controls much of the global supply chain, she said. That means American consumers will primarily feel the impact through tariffs on Chinese imports, she said.
Meanwhile, in the case of military equipment, "increased defense spending to secure these materials may come at the expense of funding for social services, infrastructure and other public needs," said Moreno.
___________________________
Minerals and Mining
https://www.arctic.review/economy/minerals-and-mining/
___________________________
Greenland Is Not For Sale. But It Has Rare Earth Minerals America Wants
November 24, 2019
https://www.npr.org/2019/11/24/781598549/greenland-is-not-for-sale-but-it-has-the-rare-earth-minerals-america-wants
___________________________
Huge rare earth elements deposit discovered in Arctic Sweden
12/01/2023
https://www.breakingnews.ie/world/huge-rare-earth-elements-deposit-discovered-in-arctic-sweden-1417283.html
___________________________
Arctic nations are squaring up to exploit the region’s rich natural resources
12 August 2022
The Arctic Circle encompasses about six per cent of the Earth’s surface, an area of more than 21 million square kilometres. Around 40 per cent of this area is land (belonging to various countries) and more than a third is made up of the same countries’ continental shelves, which sit under less than 500 metres of water. The rest of the region is made up of the international waters that lie beyond the 200-nautical-mile limit of the exclusive economic zones of the eight Arctic nation states: Russia, the USA, Canada, Denmark (through Greenland), Sweden, Finland, Norway and Iceland. More water gets exposed each year. In late 2020, according to NASA and the National Snow and Ice Data Center, sea ice cover shrank to 3.74 million square kilometres – 2.48 million square kilometres below the 1981–2010 average and the second-lowest extent since modern record-keeping began during the late 1970s. The startling decrease was linked to a Siberian heatwave in spring 2020 that began the year’s Arctic sea ice melt season unusually early. Last year, Arctic temperatures were 8–10°C warmer than average.
The main Arctic regions linked to oil and gas exploitation are the Beaufort Sea (North Slope, Alaska, and Mackenzie Delta, Canada) and the northwest Russian Arctic (Barents Sea and West Siberia). Oil and gas are also found in the Canadian Arctic Archipelago (Nunavut). According to the US Geological Survey (USGS), up to 90 billion barrels of oil, 1,669 trillion cubic feet of natural gas, and 44 billion barrels of liquid natural gas may remain in the Arctic, around 84 per cent of it in offshore areas. This translates to roughly 22 per cent of the undiscovered, technically recoverable fossil fuel resources in the world. The USGS says that the ‘extensive Arctic continental shelves may constitute the… geographically largest unexplored prospective area for petroleum remaining on Earth’.
Instead, the main drivers of the Arctic resource rush are minerals, in particular rare earth metals such as neodymium, praseodymium, terbium and dysprosium. These minerals are key to the world’s electric-vehicle and renewable-energy revolutions, underpinning battery technology and wind turbines among other things. However, it’s worth noting that lead, iron, nickel, zinc, gold, silver, coal, mica, precious stones and construction minerals such as sand, gravel and crushed rock are also believed to be present in significant quantities.
The estimated value of minerals in Arctic Russia stands at $US1.5–2 trillion. The Geological Survey of Norway concluded that the subsurface of the Kola Peninsula contains a ‘remarkable’ abundance of various minerals. Meanwhile, the Canadian Shield, which extends through eastern and central Canada from the Great Lakes to the Arctic Ocean, features high-grade metamorphic rocks that hold large reserves of copper, gold, lead, molybdenum and uranium. In Greenland, melting ice is exposing mineral belts that are highly likely to contain gold, nickel, platinum-group elements, copper, lead, zinc, molybdenum, diamonds and rare earth elements.
https://geographical.co.uk/geopolitics/the-world-is-gearing-up-to-mine-the-arctic
___________________________
Discovering Rare Earth Elements in the Arctic Region
2024
The Arctic region, often perceived as a remote and inhospitable environment, is increasingly becoming a focal point for scientific research and industrial interest, particularly in the field of mineral exploration. Among the most sought-after resources are rare earth elements (REEs), a group of 17 chemically similar elements that are critical in the manufacturing of high-tech devices, renewable energy technologies, and advanced military applications. This article delves into the significance of rare earth elements, the unique geological formations in the Arctic that harbor these minerals, and the environmental and geopolitical implications of their extraction.
Chapter 1: Understanding Rare Earth Elements
Rare earth elements are not actually rare in terms of abundance; rather, they are rarely found in economically exploitable concentrations. The 17 elements classified as REEs include the 15 lanthanides, along with scandium and yttrium. These elements possess unique properties that make them essential in various applications, from electronics to clean energy solutions.
REEs are crucial in the production of permanent magnets, phosphors, catalysts, and batteries. For instance, neodymium is used in powerful magnets found in electric vehicles and wind turbines, while europium is a key component in LED lighting and television screens. The demand for these elements has surged in recent years, driven by the rapid advancement of technology and the global shift towards sustainable energy sources.
Despite their importance, the supply chain for rare earth elements is fraught with challenges. Historically, China has dominated the production of REEs, controlling over 80% of the global supply. This monopoly has raised concerns about supply security, prompting countries like the United States, Australia, and Canada to explore alternative sources, including the Arctic region.
Chapter 2: Geological Formations in the Arctic
The Arctic region is characterized by its unique geological formations, which are believed to contain significant deposits of rare earth elements. The geology of the Arctic is shaped by a combination of ancient tectonic activity, glacial processes, and sedimentation, creating a diverse array of mineral resources.
One of the most promising areas for REE exploration is Greenland, where geological surveys have identified several key deposits. The Ilimaussaq complex, for example, is known for its rich concentrations of rare earth minerals, including zircon, eudialyte, and bastnäsite. These minerals are often found in alkaline igneous rocks, which are formed from the cooling of magma that is rich in rare earth elements.
In addition to Greenland, parts of northern Canada and Russia also show potential for REE deposits. The Thor Lake project in Canada, for instance, has been identified as one of the largest undeveloped rare earth deposits in the world. The geological formations in these regions are not only rich in REEs but also contain other valuable minerals, such as uranium and thorium, which can further enhance their economic viability.
However, the exploration and extraction of these minerals in the Arctic are not without challenges. The harsh climate, remote locations, and fragile ecosystems pose significant obstacles to mining operations. Moreover, the potential for environmental degradation raises concerns among indigenous communities and environmentalists, who advocate for sustainable practices and responsible resource management.
Chapter 3: Environmental and Geopolitical Implications
The extraction of rare earth elements in the Arctic has far-reaching environmental and geopolitical implications. As nations vie for control over these valuable resources, the Arctic is becoming a new frontier for geopolitical tensions. The melting ice caps due to climate change are opening up previously inaccessible areas, leading to increased interest from various countries and corporations.
From an environmental perspective, mining activities in the Arctic can have devastating effects on local ecosystems. The delicate balance of the Arctic environment is easily disrupted, and the potential for pollution, habitat destruction, and biodiversity loss is significant. The extraction process itself can lead to the release of toxic substances, which can contaminate water sources and harm wildlife.
Moreover, the social implications for indigenous communities in the Arctic cannot be overlooked. Many of these communities rely on the land for their livelihoods, and the introduction of mining operations can threaten their traditional ways of life. It is crucial for governments and corporations to engage with indigenous peoples and consider their rights and perspectives in the decision-making process regarding resource extraction.
Geopolitically, the race for rare earth elements in the Arctic is intensifying. Countries like the United States and Russia are increasing their military presence in the region, viewing it as a strategic area for resource control. The potential for conflict over these resources is a growing concern, as nations seek to secure their interests in a rapidly changing global landscape.
In conclusion, the Arctic region holds significant promise for the discovery and extraction of rare earth elements, which are vital for modern technology and sustainable energy solutions. However, the pursuit of these resources must be balanced with environmental stewardship and respect for indigenous rights. As the world continues to grapple with the challenges of resource scarcity and climate change, the Arctic will undoubtedly play a crucial role in shaping the future of mineral exploration and geopolitical dynamics.
https://korhogominerals.com/discovering-rare-earth-elements-in-the-arctic-region/
___________________________
Mining in the Arctic: Opportunities, Challenges, and Environmental Considerations
Sep 13 2024
https://www.azomining.com/Article.aspx?ArticleID=1827
___________________________
Arctic Mineral Resources: Science and Technology
1 January 2019
https://www.mdpi.com/journal/minerals/special_issues/Arctic_mineral
___________________________
Mining the Arctic: a rare earth ‘cold rush’?
February 3, 2025
The Arctic could be instrumental in providing the rare earths needed to meet the world’s green energy targets.
https://www.mining-technology.com/features/mining-arctic-rare-earth/
___________________________
Rare earth element mineral deposits in the United States
https://www.usgs.gov/publications/rare-earth-element-mineral-deposits-united-states
___________________________
Rare-earth mineral
A rare-earth mineral contains one or more rare-earth elements as major metal constituents. Rare-earth minerals are usually found in association with alkaline to peralkaline igneous magmas in pegmatites or with carbonatite intrusives. Perovskite mineral phases are common hosts to rare-earth elements within the alkaline complexes. Minerals are solids composed of various inorganic elements,[1] mixed through processes such as evaporation, pressure or other physical changes.[2][3] Rare earth minerals are rare because rare earth elements have unique geochemical properties that prevent them from easily forming minerals,[4] and are therefore not normally found in deposits large or concentrated enough for mining.[4] This is the reason they are called "rare" earths.[4][5] These elements have a wide range of uses from every day items to military technologies.[6] The minerals that do exist are often associated with alkaline magmas or with carbonatite intrusives. Perovskite mineral phases are common hosts to rare-earth elements within the alkaline complexes. Mantle-derived carbonate melts are also carriers of rare earths. Hydrothermal deposits associated with alkaline magmatism contain a variety of rare-earth minerals.
The following list includes the more common hydrothermal minerals that often contain significant rare earth elements:
Categories
These minerals contain the 17 rare earth elements, 15 of which are known as the lanthanides, the other two being scandium and yttrium.[7] The presence of these minerals can be a valuable indicator in geological surveys and mineral resource assessments.[8] There are over 160 rare earth minerals known, but only four of these occur in amounts suitable for mining.[9] They can occur in either primary or secondary deposits.[10]
Primary and secondary deposits
Primary deposits result from hydrothermal and igneous processes while secondary deposits are sedimentary and formed through weathering processes.[11] In the case of primary deposits, the minerals are generally found in the specific location where the elements came together to form the deposit.[12] Secondary deposits have undergone metamorphic or sedimentary processes in a location different from where the minerals were actually formed.[13][14] Depending on the type of deposit, various methods can be employed to extract the minerals from both primary and secondary deposits.[15][16]
Mined rare-earth minerals
Bastnäsite
Bastnäsite is a rare, semi-soluble carbonate mineral, primarily mined for its yttrium, used to make [17] magnets for speakers, microphones, communication devices, and many other modern necessities.[18][19] Bastnäsite deposits are found in China, Madagascar and the USA.
Laterite clays
Laterite is a class of materials which contain significant amounts of aluminium and iron.[22] They can form clays able to hold many minerals within them.[22] The weathering of rocks by leaching and oxidising conditions results in the formation of clay-like [22] minerals such as goethite, lepidocrocite, and hematite.[22] Some of them can hold rare earth minerals as well as iron, nickel and the alumina for which it is often mined.[23][24] Laterite results from the weathering of basalt.[23][24] It can make a stable basis for construction since it solidifies into rock when exposed to air.[24] However, its low fertility makes it unsuitable for agricultural use.
Monazite
Monazite is a waxy mineral that is formed through the crystallization of igneous rocks and the metamorphism of clastic sedimentary rocks.[25] This mineral is typically mined in placer deposits, with gold commonly found as a byproduct.[25] Monazite contains many rare metals such as neodymium, cerium, lanthanum, praseodymium, and samarium, making it a critical material for renewable energy devices. Monazite sand and deposits for mining are found in India, Brazil, and Australia.
Loparite
Loparite is a mineral that is mined for the three rare (but not rare earth) elements: titanium, niobium, and tantalum it contains.[28] Major Loparite deposits can be found in Russia and Paraguay,and although it is present in other countries such as Canada, Norway, Greenland, and Brazil,[29] Russia remains the primary source for mining this mineral.[29] The elements in loparite make it useful for conductivity, aircraft assembly, and as a radioactive tracer.
Rarity
https://en.wikipedia.org/wiki/Rare-earth_mineral
___________________________
Hudson’s Neodymium magnet mine
February 7, 2012
https://www.mining.com/hudson%E2%80%99s-neodymium-magnet-mine/
___________________________
Neodymium
isotopic compositions and rare earth element data evidence boundary
exchange in the southwestern tropical and equatorial Pacific
21 May 2013
https://www.geotraces.org/neodymium-isotopic-compositions/
___________________________
South Greenland ice-sheet collapse during Marine Isotope Stage 11
2014
https://pubmed.ncbi.nlm.nih.gov/24965655/
___________________________
Discrepancies
between neodymium, lead and strontium model ages from the Precambrian
of southern East Greenland: Evidence for a Proterozoic granulite-facies
ev
1992
https://www.sciencedirect.com/science/article/abs/pii/S0009254110800300
___________________________
Praseodymium
A
yellowish-white metallic element of the rare-earth group used
especially in alloys and in the form of its salts in coloring glass
greenish yellow.
https://www.merriam-webster.com/dictionary/praseodymium
___________________________
Element
concentrations, histology and serum biochemistry of arctic char
(Salvelinus alpinus) and shorthorn sculpins (Myoxocephalus scorpius) in
northwest Greenland
2022 Jan 20
https://pubmed.ncbi.nlm.nih.gov/35065927/
___________________________
Strontium
and neodymium isotopic variations in early Archean gneisses affected by
middle to late Archean high-grade metamorphic processes: West Greenland
and Labrador
January 1, 1986
https://ntrs.nasa.gov/citations/19860019068
___________________________
Modelling the Hafnium-Neodymium Evolution of Eoarchaean crust
April 2019
https://ui.adsabs.harvard.edu/abs/2019EGUGA..21.4683G/abstract
___________________________
Neodymium isotopes as a paleo-water mass tracer: A model-data reassessment
2022
https://www.sciencedirect.com/science/article/pii/S027737912200035X
___________________________
Electrowinning neodymium from its oxide in molten fluoride mixture
Apr 05, 1992
https://www.osti.gov/etdeweb/biblio/7165949
___________________________
The distribution of neodymium isotopes in Arctic Ocean basins (2009)
https://citeseerx.ist.psu.edu/viewdoc/summary?doi=10.1.1.553.1694
___________________________
Seawater-Particle Interactions of Rare Earth Elements and Neodymium Isotopes in the Deep Central Arctic Ocean
15 July 2021
https://agupubs.onlinelibrary.wiley.com/doi/10.1029/2021JC017423
___________________________
Low sea ice in the Chukchi Sea off Alaska
May 23, 2017
https://www.climate.gov/news-features/featured-images/low-sea-ice-chukchi-sea-alaska
___________________________
ORIGIN AND EVOLUTION OF THE CHUKCHI BORDERLAND
December 2008
https://oaktrust.library.tamu.edu/bitstream/handle/1969.1/ETD-TAMU-2008-12-120/ARRIGONI-THESIS.pdf;sequence=2
___________________________
Late quaternary ice-rafted detritus events in the Chukchi Basin, western Arctic Ocean
17 September 2009
Abstract
The late Quaternary ice rafted detritus (IRD) events in the Chukchi Basin, western Arctic Ocean are indications of the provenance of the coarser detritus and ice export events, and also document the evolutionary histories of Beaufort Gyre and the North American Ice Sheet (NAIS). The sediment of core M03 from the Chukchi Basin was selected to study the regional response to the ice export events and the NAIS variability. The stratigraphic framework of M03 was established by a combination of lithological features and downcore color change cycles, AMS14C dating with foraminifera abundance and IRD events. The core was also compared with the adjacent core NWR 5 from the Northwind Ridge area. The core extends back to Marine Isotope Stage (MIS) 7. A sedimentary hiatus of 10–20 ka might occur between 16 to 20 cm core depth. Seven IRD events are distinguished from the studied core and are presented during the early MIS 1, MIS 3, MIS 5 and late MIS 7. These IRD are transported by sea ice and icebergs, which were exported to the Beaufort Sea from the M’Clure Strait Ice Stream, Canadian Arctic Archipelago, and brought to the Chukchi Basin by the Beaufort Gyre.
https://link.springer.com/article/10.1007/s11434-009-0424-8
___________________________
Heat Flow Distribution in the Chukchi Borderland and Surrounding Regions, Arctic Ocean
16 December 2021
Abstract
Fifty new heat flow measurements from the Chukchi Borderland (CBL) and adjacent regions of the central Arctic Ocean are reported, where heat flow measurements have been very limited. The average heat flow of the CBL (65 mW/m2) is significantly higher than that of the entire Amerasia Basin (53 mW/m2). In the CBL, the heat flow of the Chukchi Plateau (CP), Northwind Basin (NWB), and Northwind Ridge (NWR) are 64 mW/m2, 69 mW/m2, and 60 mW/m2, respectively. With the aid of nearby seismic profiles, the elevated regional heat flow in the CP and NWR was attributed to the enhanced radiogenic heating of the thick crust (25–29 km), while the most prominent heat flow in the relatively thin crust of the NWB is likely due to the residual heat of a major tectonic extension event. Further numerical heat conduction modeling suggests that the initial rifting of the Amerasia Basin during the Jurassic–Early Cretaceous could not induce such high heat flow in the NWB. Together with recent interpretations of seismic profiles, the elevated heat flow in the NWB could be explained by the residual heat of the Late Cretaceous–early Cenozoic extension. This extension event was contemporaneous with the seafloor spreading in the Makarov Basin and had also been associated with the onset of seafloor spreading in the Eurasia Basin.
https://agupubs.onlinelibrary.wiley.com/doi/full/10.1029/2021GC010033
___________________________
Investigating Eddies from Coincident Seismic and Hydrographic Measurements in the Chukchi Borderlands, the Western Arctic Ocean
3 October 2022
https://www.semanticscholar.org/paper/Investigating-Eddies-from-Coincident-Seismic-and-in-Zhang-Song/bcc715a6a22f27d267e8e9fd87e1555eb86070f6#citing-papers
___________________________
Distribution and Characteristics of the Subsurface Eddies in the Aleutian Basin, Bering Sea
2024
Subsurface eddies, characterized by their cores located within or below the pycnocline, can transport materials over long distances in the ocean's interior. Observations of these eddies are sparse, limiting our understanding of their regional distribution and detailed horizontal structures, particularly in high‐latitude areas. The Bering Sea, situated in the subarctic region, is among the world's most productive areas and significantly influences the Arctic Ocean's state, thereby impacting climate change. In this study, we utilize ultrahigh resolution (approximately 10 m) data to investigate the distribution and characteristics of subsurface eddies in the Aleutian Basin, Bering Sea. We detected 44 subsurface eddies in 13 survey transects and analyzed their morphological and hydrographic characteristics, spatial distribution, propagation, and transport. The results show that the average core radius of the subsurface eddies is about 11.62 km and they exhibit complex structures in both the core and flank regions. The dichothermal layer cold‐core eddies are prevalent in the deep‐water region of the Bering Sea, contributing approximately 1.76 Sv poleward and westward transport in the subsurface layer. This is the first three‐dimensional depiction of subsurface eddies in the Bering Sea, revealing that the prevalence of subsurface eddies in the Bering Sea may have been negligent, with significant implications for the hydrographic and biogeochemical properties of both the Bering Sea and the Arctic Ocean. More detailed comprehensive and long‐term observations should be made to assess the global impact of subsurface eddies in the future.
___________________________
Enhanced Mixing at the Edges of Mesoscale Eddies Observed From High‐Resolution Seismic Data in the Western Arctic Ocean
2023
In recent years, the Arctic Ocean has experienced a dramatic decrease in sea ice cover, leading to enhanced turbulent mixing and eddy activity. Due to the scarcity of high‐resolution observations, our understanding of turbulent mixing in the Arctic is incomplete. Using three seismic reflection transects with high spatial resolution (∼O (10) m) and concurrent ADCP‐derived current velocity, this study identified 11 mesoscale eddies on the ice‐free Chukchi Borderlands of the western Arctic Ocean. 82% of them are intra‐halocline anticyclones. The total length of horizontal scales of these 11 eddies occupies ∼40% of the total length of three seismic lines. Diapycnal diffusivities estimated from seismic data were enhanced and can be up to 10−4 m2 s−1 at the edges of these eddies, compared with the average values (∼10−6 m2 s−1) at the Chukchi Borderlands. Seismic‐estimated diffusivities were validated by fine‐scale parameterization using ADCP‐derived velocity data and historical hydrographic data. Enhanced diffusivities at the edges of eddies may be attributed to shear instabilities at the top and bottom edges and to submesoscale motions at the lateral edges of these eddies. We highlight the enhanced mixing at the edges of eddies in the halocline can increase the upward heat flux. This upward heat flux can transfer the heat of the warm Atlantic water below to the surface, which may further promote the melting of surface sea ice.
___________________________
Metalloenzyme signatures in authigenic carbonates from the Chukchi Borderlands in the western Arctic Ocean
05 October 2022
Abstract
Migration of methane-rich fluids at submarine cold seeps drives intense microbial activity and precipitation of authigenic carbonates. In this study, we analyzed microbially derived authigenic carbonate samples recently recovered from active gas hydrate mounds on the southwestern slope of the Chukchi Borderlands (CB), western Arctic Ocean. Our main aim was to characterize the distribution patterns of trace elements in carbonate-hosted lipid fractions to assess metalloenzyme requirements of microbes involved in anaerobic oxidation of methane (AOM). We measured stable isotopes, trace elements, lipid biomarkers, and genomic DNA, and results indicate the dominance of AOM-related lipid biomarkers in studied carbonate samples, as well as a predominant occurrence of the anaerobic methanotrophic archaea (ANME)-1. We also report evidence for significant preferential enrichments of various trace elements (Li, Ni, Co, Cu, Zn, and Mo) in the total lipid fractions of CB carbonates, relative to elemental compositions determined for corresponding carbonate fractions, which differ from those previously reported for other seep sites. We hypothesize that trace element enrichments in carbonate-hosted lipid fractions could vary depending on the type of AOM microbial assemblage. Additional work is required to further investigate the mechanisms of lipid-bound trace elements in cold seep carbonates as potential metalloenzymes in AOM.
Introduction
Cold seeps occur at ocean margins worldwide1,2, corresponding to methane-rich fluid emanations from the seabed into the water column3,4. The seepage rates of reduced fluids can vary substantially at the seafloor5, leading to a large spectrum of redox conditions in subsurface sediments at cold seeps6. A key biogeochemical process in submarine methane seeps is the anaerobic oxidation of methane (AOM), which efficiently consumes a substantial fraction of methane released into the overlying water column7,8. During AOM, alkalinity levels strongly increase in the surrounding pore waters because of the production of biocarbonate (HCO3−), promoting carbonate supersaturation and precipitation2,9. Accordingly, authigenic carbonate precipitation is typically encountered in cold seeps10,11, which can serve as an archive for investigating methane release events in both modern and ancient seeps12,13.
AOM is typically mediated by a consortium of anaerobic methanotrophic archaea (ANME) and sulfate-reducing bacteria (SRB)14,15. However, recent studies have also reported that ANMEs can also use other electron acceptors, such as manganese (Mn)- and iron (Fe)-rich oxyhydroxides, to promote methane oxidation in cold seeps16. Notably, other trace metals such as nickel (Ni), cobalt (Co), molybdenum (Mo), tungsten (W), and zinc (Zn) can also be involved in AOM, acting as enzymatic co-factors17,18. Most of these findings have been obtained from culture experiments17,19. A recent study characterized, for the first time, the trace element geochemistry of the total lipid fractions preserved in authigenic carbonates from various seeps worldwide, such as the Congo, Nile deep-sea, and Niger fans, and the Gulf of Mexico20, suggesting that such an approach could be used to identify trace metals essential to microbial activity in cold seeps. A previous study reported marked enrichment of Ni, Co, Mo, and W in carbonate-hosted lipid fractions, which were linked to previously identified enzymatic pathways involved in AOM20. Nonetheless, information about how AOM may be influenced by changes in trace metal bioavailability in cold seeps remains scarce.
Recently, gas hydrate mound structures have been discovered in the Chukchi Borderlands (CB) of the western Arctic Ocean21. Geochemical information on the origin of the emitted gas and pore fluid properties was obtained within this mound structure during the R/V ARAON expedition ARA09C in 201822. However, thus far, biogeochemical signatures preserved in authigenic carbonates have not been investigated in these newly discovered gas hydrate mounds. In this study, we provide a detailed geochemical characterization of a series of authigenic carbonate samples using oxygen and carbon stable isotopes and mineralogy, as well as trace element abundances, lipid biomarkers, and nucleic acids. The main objectives of this study were to i) evaluate key environmental factors controlling carbonate precipitation in the CB mounds, ii) characterize geochemical and microbial community characteristics in the CB mounds, and iii) assess the relation of trace metals in microbial activity associated with AOM by comparing our new data for CB geochemical and microbial signatures with those previously obtained at other seeps worldwide20. We aimed to test the hypothesis that specific trace element enrichments in the total lipid fractions extracted from authigenic carbonates could be indicative of preferential trace metal utilization by different ANME communities. Our study sheds new light on the metalloenzyme requirements of microbes involved in AOM.
Results
Mineralogy and stable isotopic compositions
The authigenic carbonate samples collected in this study (Fig. 1, see also Fig. S1 in the Supplementary Information) were dominated by calcite, with a minor contribution from dolomite (Table 1). The δ13C values of carbonates (δ13Ccarbonate) were depleted, varying between − 37.0 and − 32.8‰. The δ18O values of carbonates (δ18Ocarbonate) ranged from 3.9 to 5.6‰, with more enriched values occurring in samples from the deeper sediment layers (Table 1). The measured δ13Ccarbonate and δ18Ocarbonate values of bulk CB carbonates partially overlapped with those determined for a series of seep carbonate samples previously investigated20 (Table 1 and Fig. S210,23,24,25,26,27).
Trace element compositions
Trace element data for carbonate (1 M AA leachates), sulfide (3 M HNO3 leachates), detrital silicate (HF-HCl digestion), and lipid fractions are reported in Tables S1–S4 in the Supplementary Information. Compared to JLs-1 (carbonate reference material; Triassic limestone), the carbonate fractions investigated in this study were generally characterized by much higher trace element abundances (Fig. 2 and Fig. S3), many of which (lithium (Li), transition metals, strontium (Sr), REE, lead (Pb), and thorium (Th)) were enriched up to a few hundred times. In contrast, three elements (titanium (Ti), barium (Ba), and W) showed relatively lower concentrations (up to tenfold depletion compared to JLs-1).
Discussion
Constraints on fluid sources and environmental conditions during carbonate precipitation
Magnesium (Mg) calcite was the most dominant mineral (23–46 wt. %) in all carbonate samples retrieved from the CB mounds (Table 1). Generally, the environmental conditions during which carbonate precipitation occurs at cold seeps can be inferred from the mineralogical composition of carbonates23,29. For instance, aragonite precipitation is believed to be favored at sub-oxic conditions characterized by high dissolved sulfate concentrations in pore waters (i.e., near the seafloor), while high-Mg calcite and dolomite form preferentially under more reducing conditions and low sulfate levels30. Mg-bearing carbonate minerals such as dolomite are often encountered in relatively deeply buried sulfate-depleted sediment layers31. By analogy, the Mg-calcite carbonates encountered at the CB mounds most likely indicate precipitation under reducing conditions within the sediment column32. Moreover, considering that dissolved sulfide can catalyze dehydration of Mg2+ ions in fluids, enabling more rapid precipitation of Mg-calcites as opposed to aragonite33, the CB mounds may be subjected to anoxic conditions over long periods of time, since sulfide-enriched microenvironments could have been shaped by AOM processes under anoxic conditions. Furthermore, preferential precipitation of calcite over aragonite may occur at relatively low temperatures34, given that the temperature in the bottom seawaters of the Chukchi Sea is typically below 1 °C21. Thus, these properties could potentially explain the predominance of calcite over aragonite in the carbonate samples.
The measured δ13Ccarb values (− 37.0 to − 32.8‰; Table 1 and Fig. S2) were significantly lower than the typical values (~ 0‰) of marine bicarbonate (i.e., dissolved inorganic carbon in seawater)35. In general, the δ13Ccarb values reflect the source of dissolved carbon incorporated during carbonate precipitation36. The potential contributions of these different carbon isotopic signatures include (1) methane (δ13CCH4 for biogenic origin; < -60‰, and δ13CCH4 for thermogenic origin; − 50 to − 30‰) and (2) organic matter (ca. − 25‰)37,38. Furthermore, the extent of 13C-depletion in carbonates can be an indicator of specific microbial processes39,40. Considering that the carbon isotopic composition of ascending methane (δ13CCH4; − 95.7 to − 44.1‰) investigated at the CB mounds reflects a mixture of biogenic and thermogenic sources22, the microbial oxidation using this ascending methane can produce 13C-depleted bicarbonate (HCO3−) in sediments. We could not determine the precise age of carbonate samples using the U-Th method, due to the large amounts of detrital Th in our samples. Nonetheless, considering the sampling depths of our carbonate samples (see Fig. S1), they might be weakly related to the current sulfate-methane transition zone (SMTZ). Thus, the isotopic depletion of all carbonates (δ13Ccarb < − 30‰) at the CB mounds suggests that a substantial fraction of the carbon involved in carbonate precipitation was derived from the ascending methane-rich fluids, likely related to ancient methane releases similar to those that occurred in the Barents Sea41. Pore fluids become 18O-enriched (δ18Ofluid) during clay mineral dehydration or gas hydrate dissociation, which results in high δ18Ocarb values30,42,43. At the studied site, gas hydrate layers have been identified at sediment depths below 3–4 m22. In this regard, the calcite-dominated carbonates (δ18Ocarb; 5.1 ± 0.6‰ VPDB (n = 7), Table 1 and Fig. S2) investigated at the CB mounds display 18O-enriched isotopic signatures. Therefore, these results may indicate that they precipitated from similarly enriched pore waters, resulting from gas hydrate dissociation.
Trace element enrichments in authigenic carbonates
Compared to marine bioskeletal carbonates (i.e., JLs-1 limestone), most trace elements in the carbonate fractions are enriched in the studied cold seep carbonates, except for Ti, Ba, and W (Fig. 2a). These enrichments are well explained as reflecting the geochemical composition of surrounding pore waters, inherited from various early diagenetic processes that typically result in selective trace element enrichment44. In cold seeps, authigenic carbonates dominated by calcite typically incorporate higher amounts of trace elements (including REEs) compared to aragonite-rich samples, which form near the seafloor27. Moreover, sustained anoxic conditions in cold seeps generally explain why many redox-sensitive trace elements (Mo, U, Ni, V, Co, and Zn) are enriched in corresponding authigenic carbonates, such as in the CB carbonate samples45. Enrichment of Mo typically relates to Fe–Mn oxyhydroxide cycling in subsurface sediments and/or sulfide mineral formation, resulting from the presence of hydrogen sulfide in pore waters released from AOM46. Similarly, the observed enrichments identified for Ni, Co, and Zn reflect the remineralization of organic matter in sub-surface sediments, which also results in enriched sedimentary pore waters47,48.
The total lipid extracts of CB carbonates displayed particular trace element enrichments (Li, Ti, Ni, Co, Cu, Zn, and Mo) compared to the corresponding carbonate fractions (Fig. 2c). In contrast to the enrichments observed in leached carbonate fractions, which are directly inherited from the chemical composition of the pore waters from which they have precipitated, the enrichment associated with the lipid fractions hosted by authigenic carbonates can provide information on the bio-essential elements related to AOM-driven microbial activity at seeps20. Thus far, Ni and Zn have been identified in microbial organism cells, especially in seep-related microbial assemblages, where they are bound to specific sites of proteins and enzymes49,50. Co is present in cobamides involved in methyl group transfer during methanogenesis and methanotrophic processes17. Mo is bound to a pterin cofactor to form molybdopterin, which catalyzes electron redox reactions50, while Zn occurs as a single structural atom in both enzymes50 (e.g., methanol-coenzyme M methyltransferase enzyme (Mta) and Heterodisulfide reductase (Hdr)). Considering that microbial metalloenzymes play a key role in catalyzing major biogeochemical reactions, in particular AOM51, these enzymes may require some trace elements (e.g., Co, Ni, Mo, and Zn) as co-factors for electron transport or as catalytic centers at active sites50. Although trace elements (especially Cu and Ni) may be enriched in the organic (i.e., lipid) fractions due to their chemicophysical affinities to organic matter45, trace elements, such as Co, Ni, Mo, and Zn, were enriched, not only in the lipid fractions (Fig. 2b) but also in the carbonate fractions (Fig. 2a). Hence, the enrichment of Co, Ni, Mo, and Zn identified in the total lipid fractions associated with CB carbonates is most likely to reflect their implication in specific metal-rich enzymatic pathways related to AOM-driven methanotrophic activity. Fe is primarily present as Fe-S clusters used for electron transport and/or catalysis, while Ni is either bound to Fe-S clusters or in the center of a porphyrin unique to methanogen/methanotrophs containing cofactor F43052. Thus, their enrichment in the total lipid extracts separated from CB carbonates could similarly reflect their potential role as a limiting factor for methanotrophic activities because of their high bioavailability as essential metalloenzymes during AOM53.
Concerning Cu, which was also significantly enriched in the analyzed lipid fractions, it is worth mentioning that Cu-dependent anaerobic methanotrophic enzymes have not yet been identified, although Cu availability is important for aerobic methanotrophs54. For instance, an increase in Cu concentration can cause up to a 55-fold expression of particulate methane monooxygenase (pMMO) as a membrane protein found in aerobic methanotrophs50. Similar enrichments have been recently documented in cold seeps for light rare earth elements (e.g., La, Ce), also reflecting their preferential utility in aerobic methanotroph activity55. In the CB carbonates, the total lipid fractions extracted did not show any particular enrichment in light REE, indicating a decoupling between Cu and light REE. Given that Mg-calcite carbonates were predominantly precipitated under anoxic conditions in the CB mounds, the observed Cu enrichments in the CB carbonates would not be associated with the aerobic methanotrophy. Hence, additional studies are required to better assess the potential utility of Cu in AOM treatment. Similarly, it still needs to be elucidated why Li and Ti were enriched in the studied lipid fractions in the CB carbonates, and whether the potential bioavailability of Li and Ti as metalloenzymes could represent a limiting factor in methanogenesis and methanotrophic activity under anoxic conditions. Notably, these elements have previously been identified in microorganism cells, especially in seep-related microbial assemblages, where they were known to be bound to specific sites of proteins and enzymes49,50. Thus, to some degree, we speculate that the observed Cu, Li, and Ti enrichments in the total lipids of CB carbonates might be indicative of alternative microbial processes for AOM as metalloenzymes. Hence, in many physiological and biogeochemical aspects, further research is required to investigate the potential availability of Cu, Li, and Ti in anaerobic methanogens/methanotrophs in pure cultures.
https://www.nature.com/articles/s41598-022-21184-6
___________________________
Isolating different natural and anthropogenic PAHs in the sediments from the northern Bering-Chukchi margin: Implications for transport processes in a warming Arctic
2020
https://www.sciencedirect.com/science/article/abs/pii/S0048969720331284
___________________________
Metabarcoding of zooplankton diversity within the Chukchi Borderland, Arctic Ocean: improved resolution from multi-gene markers and region-specific DNA databases
February 2021
https://www.researchgate.net/publication/348362633_Metabarcoding_of_zooplankton_diversity_within_the_Chukchi_Borderland_Arctic_Ocean_improved_resolution_from_multi-gene_markers_and_region-specific_DNA_databases
___________________________
Bedrock samples from the Chukchi Borderland, Arctic Ocean—First Chinese dredge in the polar regions
16 November 2019
https://link.springer.com/article/10.1007/s13131-019-1507-2
___________________________
Meso–Cenozoic evolution of the southwestern Chukchi Borderland, Arctic Ocean
2018
https://www.sciencedirect.com/science/article/abs/pii/S0264817218301752
___________________________
Origin and Fate of the Chukchi Slope Current Using a Numerical Model and In‐Situ Data
May 2021
Abstract and Figures
___________________________
The Hidden Ocean 2016: Chukchi Borderlands
https://oceanexplorer.noaa.gov/explorations/16arctic/background/edu/edu.html
___________________________
Scientific drilling in the Chukchi Sea: Linking North Pacific and Arctic Ocean history
2013
Introduction and overall objectives
The lack of deep-sea drilling is a huge impediment to our comprehension of the Arctic Ocean, one of the last remaining Earth Science frontiers and a stage for the most dramatic expression of climate change. Because of operational constraints in ice-covered waters, the only drilling in the Arctic Ocean thus far has been the 2006 IODP Leg 302, also known as the ACEX (Arctic Coring Expedition). The fast, climate-forced retreat of Arctic sea ice, which has dramatically accelerated in recent years, opens new prospects for drilling in the Arctic without the high-cost, multi-ship setup used in heavy ice conditions during the ACEX. The two areas of the Arctic, where seasonally ice-free water opens especially quickly are the Barents and Chukchi regions, which are affected by the warming influence of the Atlantic and Pacific oceans, respectively. These regions are therefore especially sensitive to climatic and paleoceanographic changes and constitute priority target areas for scientific drilling.
The Chukchi margin is one of the most sensitive high-latitude areas to both climate variability and sea-level fluctuations. It is in the Chukchi Sea and adjacent areas of the Arctic Ocean that vast expanses of open water now replace summer sea ice at accelerating rates. In addition to global climatic forcings, this dramatic change is related to the effect of Pacific water inflow via the Bering Strait, which influences sedimentary, hydrographic, biological, and ice conditions in and beyond this region. Late Cenozoic climatic, sea-level, and tectonic changes radically impacted the Chukchi shelf, a gateway between the Pacific and Arctic oceans that turns into a Beringian land bridge between America and Eurasia during low sea-level stands.
The significance of the Chukchi margin for studies of the Arctic-Pacific connection, sea-ice and glacial history, and high-latitude shelf-basin interactions makes it a natural attraction for research initiatives ranging from modern processes to geological history and prehistoric archeology. A number of research programs have targeted the Chukchi Sea and adjacent areas in recent years including expeditions with geological/geophysical components, and more are being planned for the coming years. These activities reveal a growing international interest in the Chukchi region, with a widening range of participating countries in addition to those that have traditionally worked in the Arctic in the 20th century. This reality creates incentives for broadening international cooperation, which can greatly increase the overall efficiency of the scientific output. An excellent international research opportunity can be provided by bringing the Integrated Ocean Drilling Program into the western Arctic.
https://research.byrd.osu.edu/workshops/sdcs_2013/preamble.php
___________________________
Zooplankton
assemblages along the North American Arctic: Ecological connectivity
shaped by ocean circulation and bathymetry from the Chukchi Sea to
Labrador Sea
November 09 2022
https://online.ucpress.edu/elementa/article/10/1/00053/194647/Zooplankton-assemblages-along-the-North-American
___________________________
Plastic pollution increasingly clogging N.L. coastlines, decades of data show
Sep 21, 2020
https://www.cbc.ca/news/canada/newfoundland-labrador/plastic-pollution-report-newfoundland-labrador-1.5728083
___________________________
Plastic pollution in the Labrador Sea: An assessment using the seabird northern fulmar Fulmarus glacialis as a biological monitoring species
2017
https://www.sciencedirect.com/science/article/abs/pii/S0025326X17308020
___________________________
Intensification and shutdown of deep convection in the Labrador Sea were caused by changes in atmospheric and freshwater dynamics
27 March 2024
Abstract
Labrador Sea winter convection forms a cold, fresh and dense water mass, Labrador Sea Water, that sinks to the intermediate and deep layers and spreads across the ocean. Convective mixing undergoes multi-year cycles of intensification (deepening) and relaxation (shoaling), which have been also shown to modulate long-term changes in the atmospheric gas uptake by the sea. Here I analyze Argo float and ship-based observations to document the 2012-2023 convective cycle. I find that the highest winter cooling for the 1994-2023 period was in 2015, while the deepest convection for the 1996-2023 period was in 2018. Convective mixing continued to deepen after 2015 because the 2012-2015 winter mixing events preconditioned the water column to be susceptible to deep convection in three more years. The progressively intensified 2012-2018 winter convections generated the largest and densest class of Labrador Sea Water since 1995. Convection weakened afterwards, rapidly shoaling by 800 m per year in the winters of 2021 and 2023. Distinct processes were responsible for these two convective shutdowns. In 2021, a collapse and an eastward shift of the stratospheric polar vortex, and a weakening and a southwestward shift of the Icelandic Low resulted in extremely low surface cooling and convection depth. In 2023, by contrast, convective shutdown was caused by extensive upper layer freshening originated from extreme Arctic sea-ice melt due to Arctic Amplification of Global Warming.
https://www.nature.com/articles/s43247-024-01296-9
___________________________
New insights into the role of atmospheric conditions in Labrador Sea deep convection
June 20, 2016
https://www.climate.gov/news-features/feed/new-insights-role-atmospheric-conditions-labrador-sea-deep-convection
___________________________
Studies of Labrador Sea Water formation and variability in the subpolar North Atlantic in the light of international partnership and collaboration
2014
https://www.sciencedirect.com/science/article/abs/pii/S0079661114002201
___________________________
The Labrador Current restricts the Arctic freshwater-induced weakening of the AMOC
2024
The Labrador Sea is one of the main regions where the surface Atlantic water loses its heat to the atmosphere (thus gets heavier) and sinks into the deep ocean, producing what’s known as deep ocean convection that mainly drives the Atlantic Meridional Ocean Circulation (AMOC). It is also characterized by the Labrador Current, a strong cyclonic ocean circulation (i.e., anticlockwise) along the lateral boundaries. The Labrador Sea is constantly affected by Arctic freshwater (in both solid and liquid forms) from the north through Davis Strait and from the east by the West Greenland Current. The future projected increase in the Arctic freshwater flux should increase the buoyancy of the Labrador Sea (i.e., making the surface water less heavy), weakening the deep convection and thus the AMOC. However, a new study published in Nature Communications utilized a high-resolution (~10 km) climate model forced by increasing greenhouse gases (under RCP8.5 scenario) to show that the Labrador Current strongly restricts the spread of Arctic freshwater from Davis Strait to the interior Labrador Sea, by rapidly transporting the Arctic freshwater to the south; thus the freshening is mostly confined to the shelf close to Newfoundland and Labrador of Canada. This in turn limits the Arctic freshwater-induced weakening of the AMOC. This study also pointed out that the Labrador Current is not adequately resolved and thus much weaker than observed in low-resolution (~100 km) models typically used in the Coupled Model Intercomparison Project (CMIP) phase 5 and 6 protocols; thus, the role of the Labrador Current in limiting the Arctic freshwater-induced weakening of the AMOC is not properly represented in the CMIP5 and CMIP6 model projections for the future.
There are a couple of caveats to note. In the high-resolution model simulation (CESM1.3) used in this study, increasing snow & rainfall over land around the Arctic Circle and the associated increase in river runoff are resolved, as well as Arctic sea ice melting. However, no Greenland ice sheet melting or Arctic land ice melting was included in the high-resolution model simulation. It should be also noted that the projected weakening of the total AMOC in this high-resolution model is quite consistent with that in the low-resolution version of the same model, although its vertical structure differs between the high and low-resolution versions (Gou et al., 2024).
Figure 4 from Shan et al. (2024): Weakening of Labrador Sea overturning and the Atlantic Meridional overturning circulation (AMOC). (a, c) Changes of overturning across the west leg of Overturning in the Subpolar North Atlantic Program observing system (OSNAP West) in a High-Res and c Low-Res. Solid (dashed) lines indicate the mean in 2006–2015 (2091–2100). The percentage changes in the maximum overturning streamfunction between 2006–2015 and 2091–2100 is denoted on the upper-right corner in a and c. b, d Percentage changes in the AMOC from 2006–2015 to 2091–2100 in b High-Res and d Low-Res. The percentage changes are calculated as the AMOC streamfunction differences between 2091–2100 and 2006–2015, divided by the maximum AMOC at 40oN in 2006–2015 in each simulation. The AMOC is calculated in density space and then remapped into depth space using the time and zonal mean depth of each density layer.
https://ocean2climate.org/2024/09/08/the-labrador-current-restricts-the-arctic-freshwater-induced-weakening-of-the-amoc/
___________________________
Seasonality of pCO2 and air-sea CO2 fluxes in the Central Labrador Sea
4 November 2024
The Labrador Sea in the subpolar North Atlantic is known for its large air-to-sea CO2 fluxes, which can be around 40% higher than in other regions of intense ocean uptake like the Eastern Pacific and within the Northwest Atlantic. This region is also a hot-spot for storage of anthropogenic CO2. Deep water is formed here, so that dissolved gas uptake by the surface ocean directly connects to deeper waters, helping to determine how much atmospheric CO2 may be sequestered (or released) by the deep ocean. Currently, the Central Labrador Sea acts as a year-round sink of atmospheric CO2, with intensification of uptake driven by biological production in spring and lasting through summer and fall. Observational estimates of air-sea CO2 fluxes in the region rely upon very limited, scattered data with a distinct lack of wintertime observations. Here, we compile surface ocean observations of pCO2 from moorings and underway measurements, including previously unreported data, between 2000 and 2020, to create a baseline seasonal climatology for the Central Labrador Sea. This is used as a reference to compare against other observational-based and statistical estimates of regional surface pCO2 and air-sea fluxes from a collection of global products. The comparison reveals systematic differences in the representation of the seasonal cycle of pCO2 and uncertainties in the magnitude of air-sea CO2 fluxes. The analysis reveals the paramount importance of long-term, seasonally-resolved data coverage in this region in order to accurately quantify the size of the present ocean sink for atmospheric CO2 and its sensitivity to climate perturbations.
https://news-oceanacidification-icc.org/2024/11/04/seasonality-of-pco2-and-air-sea-co2-fluxes-in-the-central-labrador-sea/
___________________________
Marine plastic debris in northern fulmars from the Canadian high Arctic
2009
https://www.sciencegate.app/document/10.1016/j.marpolbul.2008.04.017
___________________________
Marine plastic debris in northern fulmars from Davis Strait, Nunavut, Canada
2006
https://ui.adsabs.harvard.edu/abs/2006MarPB..52..813M/abstract
___________________________
A history of monitoring marine birds at sea in eastern and Arctic Canada
2024
https://www.sciencedirect.com/org/science/article/pii/S2368746024000371
___________________________
Northern fulmars as biological monitors of trends of plastic pollution in the eastern North Pacific
2012
https://www.sciencedirect.com/science/article/abs/pii/S0025326X12001828
___________________________
Monitoring plastic ingestion by the northern fulmar Fulmarus glacialis in the North Sea
2011
https://www.sciencedirect.com/science/article/abs/pii/S0269749111003344
___________________________
Modeling Dissolved Pb Concentrations in the Western Arctic Ocean: The Continued Legacy of Anthropogenic Pollution
25 April 2025
https://agupubs.onlinelibrary.wiley.com/doi/10.1029/2025JC022415
___________________________
A Sailor Found a Pitch-Black Iceberg That May Hold Secrets From 100,000 Years Ago
June 18, 2025

A Sailor Spied a 100,000-Year-Old Black Iceberg
Here’s what you’ll learn when you read this story:
A sailor recently spotted a rare black iceberg off the coast of Labrador, Canada.
According to experts, the iceberg could be up to 100,000 years old.
Possible reasons for the unique coloration include volcanic soot, ash from a meteor strike, and debris collected during the iceberg’s journey across the sea.
As climate change leads to warming global temperatures, nature’s time capsules—a.k.a. glaciers, permafrost, and icebergs—are melting and exposing millennia of history. Whether they be mummified animals or ancient bacteria, the finds are incredible. Now, a sailor has seen something particularly unbelievable floating in the frozen sea near the coast of northeastern Canada: a black, veiny iceberg...
https://www.yahoo.com/news/sailor-found-pitch-black-iceberg-120000375.html
___________________________
Long-lost ‘failed’ continent hidden under 6,500ft-deep sea between US and Europe – experts find why doomed land vanished
Jul 26 2024

It's linked to the failed break-up of North America and Greenland
A GIANT chunk of a long-lost "microcontinent" that never fully formed has been found.
The failed land mass between North America and Europe was born around 58 million years ago – but was ultimately doomed.
Evidence of the continental mishap was found beneath the Davis Strait.
This is an arm of the Arctic Ocean north of the Labrador Sea between Canada and Greenland.
Scientists say the seafloor beneath the waterway is "anomalously thick" – and now they know why.
It's the eerie remains of what experts are calling the Davis Strait Proto-Microcontinent (or DSPM).
https://www.the-sun.com/tech/12026407/lost-continent-davis-strait-canada-greenland-north-america/
___________________________
Lomonosov Ridge
https://en.wikipedia.org/wiki/Lomonosov_Ridge
The Lomonosov Ridge (Russian: Хребет Ломоносова, Danish: Lomonosovryggen) is an unusual underwater ridge of continental crust in the Arctic Ocean. It spans 1,800 kilometres (1,100 mi) between the New Siberian Islands over the central part of the ocean to Ellesmere Island of the Canadian Arctic Archipelago.[1] The ridge divides the Arctic Basin into the Eurasian Basin and the Amerasian Basin. The width of the Lomonosov Ridge varies from 60 to 200 kilometres (37 to 124 mi). It rises 3,300 to 3,700 metres (10,800 to 12,100 ft) above the 4,200-metre (13,800 ft) deep seabed. The minimum depth of the ocean above the ridge is less than 400 metres (1,300 ft).[2] Slopes of the ridge are relatively steep, broken up by canyons, and covered with layers of silt. It is an aseismic ridge.
The Lomonosov Ridge was first discovered by the Soviet high-latitude expeditions in 1948 and is named after Mikhail Lomonosov. The name was approved by the GEBCO Sub-Committee on Undersea Feature Names (SCUFN).
Territorial dispute
In the 2000s, the geological structure of the ridge attracted international attention due to a 20 December 2001 official submission by the Russian Federation to the UN Commission on the Limits of the Continental Shelf in accordance with the United Nations Convention on the Law of the Sea (article 76, paragraph 8). The document proposed establishing new outer limits for the Russian continental shelf, beyond the previous 200-nautical-mile (370 km; 230 mi) zone, but within the Russian Arctic sector. The territory claimed by Russia in the submission is a large portion of the Arctic reaching the North Pole. One of the arguments was a statement that the underwater Lomonosov Ridge and Mendeleev Ridge are extensions of the Eurasian continent. In 2002 the UN Commission neither rejected nor accepted the Russian proposal, recommending additional research.
Danish scientists hope to prove that the ridge is an extension of Greenland, rather than an extension of Canada's adjacent Ellesmere Island, and Denmark became another claimant to the area in 2014.[8] Canada, also a claimant, asserts that the ridge is an extension of its continental shelf. In April 2007, Canadian and Russian scientists were sent to map the ridge as a possible precedent for determining sovereignty over the area.[1] In late June 2007, Russian scientists reiterated their claim that the ridge is an extension of Russia's territory,[9] and in 2011 a Russian scientist ignored Canada's claim, instead saying that Russia and Denmark claim different parts of the ridge and the claims are not conflicting.[10] Other sources indicate that some areas are disputed.
Canada is expected to make further claims. Denmark and Russia have agreed to follow certain procedures when making claims. If the Danish claims are accepted by the Commission in summer 2015, the distribution of areas may still be a matter of negotiation between claiming countries – a process which can take several years.[14][needs update] The rhetoric used in making claims is also subject to discussion.
A 21-member UN arbitration panel is considering the competing claims, with the focus on the Lomonosov Ridge.
___________________________
The rush to claim an undersea mountain range
23rd July 2020
https://www.bbc.com/future/article/20200722-the-rush-to-claim-an-undersea-mountain-range
___________________________
Kinematics of the Polar Area of Lomonosov Ridge Bottom in Arctic
16 November 2021
https://link.springer.com/chapter/10.1007/978-3-030-76328-2_29
___________________________
The Lomonosov Ridge as a natural extension of the Eurasian continental margin into the Arctic Basin
2012
https://www.sciencedirect.com/science/article/abs/pii/S1068797112002234
___________________________
Lomonosov Ridge, One of the most mysterious mountain ranges in the world.
July 26, 2020
https://mountainsmagleb.com/2020/07/26/lomonosov-ridge-one-of-the-most-mysterious-mountain-ranges-in-the-world/
___________________________
A Note on Arctic Oceanography and the Lomonosov Range
Published 1954
https://www.semanticscholar.org/paper/A-Note-on-Arctic-Oceanography-and-the-Lomonosov-Metcalf/d1da202d9d8c4eb4fccd5e8552997ba0c15c1cfb
___________________________
Morphology and structure of the Lomonosov Ridge, Arctic Ocean
24 May 2006
https://agupubs.onlinelibrary.wiley.com/doi/full/10.1029/2005GC001114
___________________________
Russia’s Proposed Extended Continental Shelf in the Arctic Ocean: Science Setting the Stage for Law
May 24, 2021
https://asil.org/insights/volume/25/issue/8
___________________________
The Arctic Ocean boundary current along the Eurasian slope and the adjacent Lomonosov Ridge: Water mass properties, transports and transformations from moored instruments
2001
https://researchportal.helsinki.fi/en/publications/the-arctic-ocean-boundary-current-along-the-eurasian-slope-and-th
___________________________
Seabed erosion on the Lomonosov Ridge, central Arctic Ocean: A tale of deep draft icebergs in the Eurasia Basin and the influence of Atlantic water inflow on iceberg motion?
Sep 1, 2004
https://www.deepdyve.com/lp/wiley/seabed-erosion-on-the-lomonosov-ridge-central-arctic-ocean-a-tale-of-5Cr3n9v0K2
___________________________
Marine sediment core data from the Lomonosov Ridge off Greenland, Arctic Ocean
2019-04-09
https://bolin.su.se/data/?k=Arctic+%22Turborotalita%20quinqueloba%22
___________________________
Topography of the ocean floor
https://www.britannica.com/place/Arctic-Ocean/Topography-of-the-ocean-floor
___________________________
Sediment deformation atop the Lomonosov Ridge, central Arctic Ocean: Evidence for gas-charged sediment mobilization?
2022
https://www.sciencedirect.com/science/article/pii/S0264817222000332
___________________________
Mineralogical evidence of Middle Miocene glacial ice in the central Arctic Ocean sediments
Sep 2009
https://www.researchgate.net/figure/ACEX-302-drilling-site-in-Lomonosov-Ridge-Arctic-Ocean-image-reproduced-from-the-GEBCO_fig1_260415384
___________________________
Gas-Geochemical Anomalies of Hydrocarbon Gases in the Bottom Sediments of the Lomonosov Ridge and Podvodnikov Basin of the Arctic Ocean
30 December 2021
https://link.springer.com/article/10.1134/S1028334X21120163
___________________________
Morphology and structure of the Lomonosov Ridge, Arctic Ocean
2006
https://www.ldeo.columbia.edu/node/10445
___________________________
Model of the separation of the Marvin Spur from the Lomonosov Ridge in the Arctic Ocean
22 August 2014
https://link.springer.com/article/10.1134/S0001437014040110
___________________________
Mass wasting on the submarine Lomonosov Ridge, central Arctic Ocean
2007
https://www.sciencedirect.com/science/article/abs/pii/S0025322707001107
___________________________
Magmatic and rifting-related features of the Lomonosov Ridge, and relationships to the continent–ocean transition zone in the Amundsen Basin, Arctic Ocean
03 February 2022
https://academic.oup.com/gji/article/229/2/1309/6521444?login=false
___________________________
Paleomagnetism of Quaternary sediments from Lomonosov Ridge and Yermak Plateau: implications for age models in the Arctic Ocean
16 January 2012
https://eprints.soton.ac.uk/351179/
___________________________
Pleistocene stratigraphy and paleoenvironmental variation from Lomonosov Ridge sediments, central Arctic Ocean
2001
https://www.sciencedirect.com/science/article/abs/pii/S0921818101001102
___________________________
Microbial diversity in Cenozoic sediments recovered from the Lomonosov Ridge in the Central Arctic Basin
02 March 2009
https://ami-journals.onlinelibrary.wiley.com/doi/10.1111/j.1462-2920.2008.01834.x
___________________________
A Mesozoic Ocean In The Arctic: Paleontological Evidence
January 2002
https://www.researchgate.net/publication/237466024_A_Mesozoic_Ocean_In_The_Arctic_Paleontological_Evidence
___________________________
Physico-chemical characteristics and origin of hypersaline meromictic Lake Garrow in the Canadian high Arctic
1989
Garrow Lake (75° 23′ N; 96° 50′ W), located 3 km from the southern tip of Little Cornwallis Island and 6.7 m above mean sea level, is a meromictic ecto-creno-cryogenic lake with an area of 418 ha and a maximum water depth of 49 m. The thermal stratification of this lake is mesothermic (heliothermic). Some of the solar energy that penetrates through the 2 m ice cover is stored for a long period of time in the upper level of the monimolimnion, under a greenhouse effect due the water density gradient. The energy transfer (0.06 °C m −1) by conduction toward the bottom sediments is very constant from one year to the next and is likely to prevent the presence of permafrost under this water body.In its chemical composition, this meromictic lake is quite comparable to the world's saltiest water bodies and is the first lake, with a salinity greater than sea water to be reported for the Canadian Arctic. Its anoxic monimolimnion is nearly three times (90‰) as salty as normal sea water.This hypersaline water seems to have been derived from isostatic trapped marine waters within the present lacustrine basin as well as from underground during deglaciation of the area. The subsequent freezing-out of salt from the underground waters and the migration and accumulation of these waters in the bottom of Garrow Lake through a talik within the permafrost were the main contributing factors. The speed of formation and migration of the underground brine was a function of the postglacial isostatic uplift rate as well as the permafrost growth rate.
___________________________
Samples from Lomonosov Ridge place new constraints on the geological evolution of Arctic Ocean
2018
Abstract
A number of rock samples were collected from two dredge positions on the Lomonosov Ridge at water depths of 2–3.5 km. The dredge samples are dominated by sediments deformed and metamorphosed under greenschist-facies conditions 470 myr ago according to 40Ar/39Ar dating of metamorphic muscovite. This shows that the Lomonosov Ridge was involved in a major Mid-Ordovician orogenic event that correlates with early arc–terrane accretion observed in northern Ellesmere Island, Svalbard, and other parts of the Caledonian belt. Detrital zircon age spectra of these metasediments span the Mesoproterozoic–Palaeoproterozoic with a main peak at around 1.6 Ga, and a pattern similar to that known from Caledonian metasedimentary rocks in East Greenland and northern Norway, as well as from Cambrian sediments in Estonia and Palaeozoic sediments on Novaya Zemlya. A second population of dredge samples comprises undeformed, non-metamorphic sandstones and siltstones. Detrital zircons in these sediments span the Palaeoproterozoic with a few Archaean zircons. Both rock types are covered by an up to 8 Ma ferromanganese crust and are evaluated to represent outcrop, and apatite fission-track data from three of the rock samples indicate that exposure at the seabed corresponds to a regional event of uplift and erosion that affected the Arctic in the Late Miocene. The data from the Lomonosov Ridge suggest that the 470 Ma orogenic event extended from Scotland and northern Scandinavia into the Arctic, including Svalbard, the Pearya Terrane and the Chukchi Borderlands.
___________________________
Protactinium-231 and Thorium-230 Abundances and High Scavenging Rates in the Western Arctic Ocean
17 Apr 1998
Abstract
The Canadian Basin of the Arctic Ocean, largely ice covered and isolated from deep contact with the more dynamic Eurasian Basin by the Lomonosov Ridge, has historically been considered an area of low productivity and particle flux and sluggish circulation. High-sensitivity mass-spectrometric measurements of the naturally occurring radionuclides protactinium-231 and thorium-230 in the deep Canada Basin and on the adjacent shelf indicate high particle fluxes and scavenging rates in this region. The thorium-232 data suggest that offshore advection of particulate material from the shelves contributes to scavenging of reactive materials in areas of permanent ice cover.
https://www.science.org/doi/10.1126/science.280.5362.405
___________________________
Heat flow measurements on the Lomonosov Ridge, Arctic Ocean
04 January 2014
https://link.springer.com/article/10.1007/s13131-013-0384-3
___________________________
Flow of Canadian basin deep water in the Western Eurasian Basin of the Arctic Ocean
2010
https://www.sciencedirect.com/science/article/pii/S0967063710000300
___________________________
Ocean acidification
February 27, 2017
International research team reports ocean acidification spreading rapidly in Arctic Ocean in area and depth
Pacific Winter Water
The researchers studied water samples taken during cruises by Chinese ice breaker XueLong (meaning “snow dragon”) in summer 2008 and 2010 from the upper ocean of the Arctic’s marginal seas to the basins as far north as 88 degrees latitude, just below the North Pole, as well as data from three other cruises.
Scientists measured dissolved inorganic carbon and alkalinity which allows them to calculate pH and the saturation state for aragonite, a carbonate mineral that marine organisms need to build their shells.
Data collected by ship and model simulations suggest that increased Pacific Winter Water (PWW), driven by circulation patterns and retreating sea ice in the summer season, is primarily responsible for this OA expansion, according to Di Qi, the paper’s lead author and a doctoral student of Chen.
“This work will help increase our understanding of climate change, carbon cycling, and ocean acidification in the Arctic, particularly as it affects marine and fishery science and technology,” said Chen.
PWW comes from the Pacific Ocean through the Bering Strait and shelf of the Chukchi Sea and into the Arctic basin. In recent years, melting sea ice has allowed more of the Pacific water to flow through the Bering Strait into the Arctic Ocean. Pacific Ocean water is already high in carbon dioxide and has higher acidity. As the ocean mass moves north, it absorbs additional carbon dioxide from decomposing organic matter in the water and sediments, increasing acidity.
The melting and retreating of Arctic sea ice in the summer months also has allowed PWW to move further north than in the past when currents pushed it westward toward the Canadian archipelago.
Arctic ocean ice melt in the summer, once found only in shallow waters of depths less than 650 feet or 200 meters, now spreads further into the Arctic Ocean.
“It’s like a melting pond floating on the Arctic Ocean. It’s a thin water mass that exchanges carbon dioxide rapidly with the atmosphere above, causing carbon dioxide and acidity to increase in the meltwater on top of the seawater,” said Cai. “When the ice forms in winter, acidified waters below the ice become dense and sink down into the water column, spreading into deeper waters.”
https://www.udel.edu/udaily/2017/february/arctic-acidification/
___________________________
A warm and poorly ventilated deep Arctic Mediterranean during the last glacial period
14 Aug 2015
Slow circulation in the cold Arctic
https://www.science.org/doi/10.1126/science.aaa9554
___________________________
The melting ice of the Arctic (1/2) | DW Documentary
Dec 25, 2022
https://www.youtube.com/watch?v=GystZIxWQ3o
___________________________
The melting ice of the Arctic (2/2) | DW Documentary
Dec 30, 2022
https://www.youtube.com/watch?v=Hz6xkR4mNlo
___________________________
Post-Glacial Isostatic Adjustment and Global Warming in Subarctic Canada: Implications for Islands of the James Bay Region
2009
https://pubs.aina.ucalgary.ca/arctic/Arctic62-4-458.pdf
___________________________
What They Didn't Teach You at School about Planet Mercury | NASA's MESSENGER Discoveries
Mar 28, 2023
https://www.youtube.com/watch?v=B588JHKSlEE
___________________________
Insider Just Announced Something Is Happening Under Alaska
Mar 16, 2023
https://www.youtube.com/watch?v=iqMFtRLKkqM
___________________________
The US NAVY Is Mobilizing After This Just Appeared In ALASKA - Solomon's Temple Investigation Marathon #1091
2025
https://archive.org/details/solomons-temple-1091
___________________________
THIS IS LIFE IN ICELAND: The strangest country in the world?
Mar 4, 2023
https://www.youtube.com/watch?v=kxxm3Gi8Xyk
___________________________
10 Things You Didn’t Know About Greenland
Jul 21, 2011

Northern Lights: Nuuk, Greenland

ELEPHANT FOOT GLACIER

Greenland aerial from above

ERODED ICEBERGS IN ERIC’S FJORD

ICE CAP OF KANGERDLUARSSUK

Greenland iceberg Ilulissat

EAST TASIILAQ, GREENLAND

REINDEER HERD NEAR IVITUUT, GREENLAND

ICEBERG OFF SYDPROVEN, GREENLAND
https://twistedsifter.com/2011/07/10-things-you-didnt-know-about-greenland/
___________________________
Microfaunal Recording of Recent Environmental Changes in the Herschel Basin, Western Arctic Ocean
20 March 2023
https://arctic.au.dk/news-and-events/news/show/artikel/microfaunal-recording-of-recent-environmental-changes-in-the-herschel-basin-western-arctic-ocean
___________________________
A new glacial isostatic adjustment model of the Innuitian Ice Sheet, Arctic Canada
2015
https://www.sciencedirect.com/science/article/abs/pii/S0277379115001493
___________________________
Increases in the Pacific inflow to the Arctic from
1990 to 2015, and insights into seasonal trends and driving mechanisms
from year-round Bering Strait mooring data
2017
https://www.sciencedirect.com/science/article/abs/pii/S0079661117302215
___________________________
Spectacular Secrets of the North Sea
Jan 6, 2023
https://www.youtube.com/watch?v=43dHpDpResw
___________________________
New Discovery in Iceland Scares Scientists
Feb 2, 2023
https://www.youtube.com/watch?v=9Z7PELJszho
___________________________
Terrifying New Discovery Under Iceland That Scares Scientists
Mar 12, 2023
https://www.youtube.com/watch?v=b0lxJ6QNYzA
___________________________
Scientists are Frightened by Recent Discoveries in Iceland
Feb 18, 2023
https://www.youtube.com/watch?v=ivS-sr4UCLg
___________________________
Risk Takers - 114 - Polar Bear Alert Agent
Dec 17, 2015
https://www.youtube.com/watch?v=PCAurytDrds
___________________________
Flood Geology | Episode 2 | The Great Ice Age | Michael J. Oard
Jun 19, 2021
https://www.youtube.com/watch?v=6ekejmQKfNI
___________________________
Deadly Pacific (Full Episode) | Drain the Oceans
Jan 15, 2023
https://www.youtube.com/watch?v=4-qO0d6r1f0
___________________________
How Ancient Floods Have Shaped Our Landscape | Earthshocks: Megaflood | Earth Stories
Apr 9, 2022
https://www.youtube.com/watch?v=t3Km-NjcEvM
___________________________
THE SHRINKING HIPPOS OF ANCIENT EUROPE
October 14, 2013
https://passionforfreshideas.com/articles/shrinking-hippos-ancient-europe/
___________________________
Clan of the North (Full Episode) | Kingdom of the Polar Bears
Jun 14, 2022
https://www.youtube.com/watch?v=D6_e6yKH26Q
___________________________
Underwater volcano: into the abyss
Apr 15, 2022
https://www.youtube.com/watch?v=djJaZoNvUcs
___________________________
Be a Predator: Polar Bear vs. Leopard Seals | Wild Life Documentary
May 6, 2016
https://www.youtube.com/watch?v=SB1l6UTS5BE
___________________________
Life With Polar Bears In The Frozen Arctic | Polar Bear Alcatraz | Real Wild
Jan 13, 2018
https://www.youtube.com/watch?v=4ChXHRUjVRw
___________________________
Discovering Secret Canada: Rainforests, Volcanoes, And Caves | Uncharted Canada Compilation | TRACKS
Dec 24, 2022
https://www.youtube.com/watch?v=qsnjzEkMqe4
___________________________
The Mistery of the Piri Reis map
2023
https://www.youtube.com/watch?v=wxbq67Odqjs
___________________________
Arctic Animals
A List of Arctic Wildlife

https://www.coolantarctica.com/Antarctica%20fact%20file/arctic_animal.php
___________________________
Discover The Venomous Arctic Snake That Survives -57° Bitter Cold
August 27, 2022

European adders are the only snakes found north of the Arctic Circle.
https://a-z-animals.com/blog/discover-the-venomous-arctic-snake-that-survives-57-bitter-cold/
___________________________
AMAZING Arctic Snakes Fight and Mate | Deadly Vipers | BBC Studios
Nov 24, 2008
https://www.youtube.com/watch?v=7TF7d4jvays
___________________________
Vipera berus
https://en.wikipedia.org/wiki/Vipera_berus
__________________________
Warming alters cascading effects of a dominant arthropod predator on fungal community composition in the Arctic
2024
ABSTRACT
Rapid climate change in the Arctic is altering microbial structure and function, with important consequences for the global ecosystem. Emerging evidence suggests organisms in higher trophic levels may also influence microbial communities, but whether warming alters these effects is unclear. Wolf spiders are dominant Arctic predators whose densities are expected to increase with warming. These predators have temperature-dependent effects on decomposition via their consumption of fungal-feeding detritivores, suggesting they may indirectly affect the microbial structure as well. To address this, we used a fully factorial mesocosm experiment to test the effects of wolf spider density and warming on litter microbial structure in Arctic tundra. We deployed replicate litter bags at the surface and belowground in the organic soil profile and analyzed the litter for bacterial and fungal community structure, mass loss, and nutrient characteristics after 2 and 14 months. We found there were significant interactive effects of wolf spider density and warming on fungal but not bacterial communities. Specifically, higher wolf spider densities caused greater fungal diversity under ambient temperature but lower fungal diversity under warming at the soil surface. We also observed interactive treatment effects on fungal composition belowground. Wolf spider density influenced surface bacterial composition, but the effects did not change with warming. These findings suggest a widespread predator can have indirect, cascading effects on litter microbes and that effects on fungi specifically shift under future expected levels of warming. Overall, our study highlights that trophic interactions may play important, albeit overlooked, roles in driving microbial responses to warming in Arctic terrestrial ecosystems.
https://pmc.ncbi.nlm.nih.gov/articles/PMC11253614/
___________________________
Highly endangered sunflower star finds refuge in Canadian fjords
April 10, 2025
https://phys.org/news/2025-04-highly-endangered-sunflower-star-refuge.html
___________________________
Hunting toxic chemicals in the Arctic
March 31, 2022
https://phys.org/news/2022-03-toxic-chemicals-arctic.html
___________________________
Canada proposes phase out of 'forever chemicals' in consumer products
March 5, 2025
https://phys.org/news/2025-03-canada-phase-chemicals-consumer-products.html
___________________________
Arctic snow shows up to 71 times more PFAS during sunny months
December 19, 2024
https://phys.org/news/2024-12-arctic-pfas-sunny-months.html
___________________________
Greenland Inuit face health risks from 'forever chemicals' in diet
March 13, 2025
https://phys.org/news/2025-03-greenland-inuit-health-chemicals-diet.html
___________________________
Tundra Food Chain
https://www.sciencefacts.net/tundra-food-chain.html
___________________________
How Inuit Survive Polar Bear Attacks
Dec 7, 2024
https://www.youtube.com/watch?v=SMhlfNSRChY
___________________________
10 Inuit Survival Tips Everyone Should Learn
Feb 11, 2025
https://www.youtube.com/watch?v=QXQfCt6EyuE
___________________________
How Inuit Sleep At -84°F (-64°C) Without Heat
Feb 7, 2025
https://www.youtube.com/watch?v=tstCguR660Y
___________________________
How Inuit Start Fires In Rain
Feb 22, 2025
https://www.youtube.com/watch?v=iBEOdtpnGVE
___________________________
How Inuit Get Drinking Water At - 84°F (-64°C
Dec 19, 2024
https://www.youtube.com/watch?v=X5sIWA13ZGQ
___________________________
How Inuit Get Food At −84°F (−64°C)
Dec 20, 2024
https://www.youtube.com/watch?v=G3gunoDkLVs
___________________________
How Meat Helped Inuits Survive For Generations
Jan 2, 2025
https://www.youtube.com/watch?v=7tMjVQU9_mY
___________________________
Abundance and types of plastic pollution in surface waters in the Eastern Arctic (Inuit Nunangat) and the case for reconciliation science
2021
https://www.sciencedirect.com/science/article/abs/pii/S0048969721018775
___________________________
ICEBERG field research continues in Qaqortoq, Narsaq, and Nanortalik, South Greenland — Studying pollution and its impact on local communities
June 5 2025
https://arctic-iceberg.eu/iceberg-field-research-continues-in-qaqortoq-narsaq-and-nanortalik-south-greenland-studying-pollution-and-its-impact-on-local-communities/
___________________________
Narsarsuaq
https://en.wikipedia.org/wiki/Narsarsuaq
Climate
Narsarsuaq experiences boundary subarctic climate (Köppen: Dfc), which with a 1.1 °C (1.98 °F) margin escapes being classified as polar climate that is typical for the rest of Greenland. Despite its rather chilly temperatures, Narsarsuaq is one of the few places in Greenland with abundant naturally growing trees. This is due to several factors. Its geographical position is extremely sheltered from harsh subpolar winds by multiple layers of tall mountains to the west, and there is a heavy oceanic influence that results in a rather stable and steady amount of precipitation year-round. The oceanic influence can be observed in the occasional Atlantic storms that often pound the region (resulting in a fairly wet climate) and a moderate amount of precipitation per year (which could also be considered quite high by Greenlandic standards). Due to the fair climatic conditions, Narsarsuaq is the site of Greenland's only botanical garden, the "Greenlandic Arboretum".
___________________________
Nalunaq environmental baseline study 1998-2001
2005
https://www2.dmu.dk/1_viden/2_Publikationer/3_fagrapporter/rapporter/FR562.PDF
___________________________
Uunartoq Qeqertaq
https://en.wikipedia.org/wiki/Uunartoq_Qeqertaq
Uunartoq Qeqertaq (Greenlandic), Warming Island in English, is an island off the east central coast of Greenland, 550 kilometres (342 miles) north of the Arctic Circle. It became recognised as an island only in September 2005, by US explorer Dennis Schmitt. It was attached to the mainland of Liverpool Land by glacial ice even in 2002, when the ice shelves began retreating rapidly in this area, so that by 2005 it was no longer attached to the mainland. Members of the scientific community believe this newly discovered island is a direct result of global warming.
Controversy
Patrick Michaels, a climatologist and prominent global warming denier, created a controversy over the history of Warming Island in a post on his website, World Climate Report, in which he argued that the island had been previously uncovered in the 1950s toward the end of a brief warm period in Greenland.
Despite a general lack of suitably detailed maps, Michaels found a map published by Ernst Hofer, a photographer who did aerial surveys of the area in the early 1950s, which showed the Warming Island landmass unconnected to Greenland. Michaels concluded therefore that Warming Island was also a separate island when observed by Hofer in the 1950s, and more broadly that Warming Island is an example of unjustified concern about the future outcomes of global warming.
Dennis Schmitt countered Michaels' theory in an article by New York Times reporter Andy Revkin, contending that Hofer's map is inaccurate. Citing discrepancies such as the absence on Hofer's map of nearby Reynolds Island, he suggested that the discrepant features are consistent with an aerial view of the area when covered with fog, which has often obscured low-lying areas like Reynold's Island and the ice-bridge connecting Warming Island to the Greenlandic mainland. He further observed, "I see by the markings of the 1957 document that it is to be construed as indeed only schematic, that it is explicitly incomplete."
Michaels explained that Hofer included the map in his book "so as to place his pictures and stories in context."
No photographic evidence is available that would resolve the issue.
The island was also part of a 2011 controversy when it was included in the Times Atlas of the World, along with a revised depiction of the Greenland ice sheet that showed a 15% reduction. After being alerted through the media, the U.S. National Snow and Ice Data Center reported that the atlas editors must have used a 2001 map showing only the thickest segment of the ice sheet.
___________________________
Contamination of arctic Fjord sediments by Pb–Zn mining at Maarmorilik in central West Greenland
2010
https://www.sciencedirect.com/science/article/abs/pii/S0025326X10000378
___________________________
Lead and zinc in sediments and biota from Maarmorilik, West Greenland: an assessment of the environmental impact of mining wastes on an Arctic fjord system
2000
https://www.sciencedirect.com/science/article/abs/pii/S0269749100002141
___________________________
Glacier retreat alters downstream fjord ecosystem structure and function in Greenland
29 June 2023
https://www.nature.com/articles/s41561-023-01218-y
___________________________
List of fjords of Greenland
https://en.wikipedia.org/wiki/List_of_fjords_of_Greenland
___________________________
Beach litter sources around Nuuk, Greenland: An analysis by UArctic summer school graduate course students
April 2023
https://www.researchgate.net/publication/370105681_Beach_litter_sources_around_Nuuk_Greenland_An_analysis_by_UArctic_summer_school_graduate_course_students
___________________________
Denmark suggests Greenland is responsible for cleaning up old US pollution
November 10, 2016
https://www.arctictoday.com/denmark-suggests-greenland-is-responsible-for-cleaning-up-old-us-pollution/
___________________________
The radioactive contamination study in south-western Greenland tundra in 2012–2013
2019
https://www.sciencedirect.com/science/article/abs/pii/S0265931X19305053
___________________________
Measurements of nitrogen dioxide in Greenland using Palmes diffusion tubes
2000
Abstract
Measurements
of nitrogen dioxide using the Palmes diffusion tubes in Uummannaq,
Aasiaat, and Nuuk, all located along the west-coast of Greenland, have
demonstrated that the levels of pollution at the most heavily impacted
sites are comparable to levels in much larger towns in Denmark. The
highest concentrations were, in general, observed near sites influenced
by car traffic (peak concentrations of up to 16 ppbv), medium
concentrations were observed in the residential areas (2–6 ppbv), and
very low levels were found at the background locations in the town
outskirts (1–2 ppbv). Observations of nitrogen dioxide concentrations
less than 0.1 ppbv at a remote site, Akia, 25 km from Nuuk, indicate
that, compared to local sources, long-range transport of nitrogen
dioxide is not important in western Greenland.
https://pubs.rsc.org/en/content/articlehtml/2001/em/b008325i
___________________________
Decadal changes and long-term trends in the Arctic atmosphere
https://www.pmel.noaa.gov/arctic-zone/essay_walsh.html
___________________________
Shrinking Polar Circle - AIRS Temperature Anomaly Trends in the Arctic
May 10, 2022
With a 20 year record from the AIRS instrument, we are able to examine trends in atmospheric temperature in the data. The animation on the left shows the global monthly mean temperatures for each month of the AIRS mission at a pressure level of 931 mb from the Version 2 of the CLIMCAPS-Aqua L3 data product.
The graph on the right shows in white the anomaly in temperature in the Arctic region obtained by taking the difference in the average temperature for each month from 60N to 90N from the average temperature for that month in this region over the entire time period. The white line through the data is a linear fit and shows an upward trend in the anomaly.
We also show in this figure a blue line that represents the ‘zero-anomaly latitude’ trendline defined as the starting latitude that would be required to have a zero anomaly when integrating poleward to 90N. We see that the zero-anomaly latitude moves poleward, indicating that less of the lower latitudes can be integrated to give an equivalent temperature to the average for the mission.
Back to the figure on the left, the blue circles show the starting point and time dependence of the zero anomaly latitude trendline. The AIRS data shown here are indicating a shrinking of the polar circle, as seen on other data sets.
At the time of the production of this animation, the observed trends seen in the data have not been validated. We share them with the community at this time to inspire further investigation and validation.
___________________________
2012: Magnetic Pole Reversal Happens All The (Geologic) Time
Nov 30, 2011
https://www.nasa.gov/topics/earth/features/2012-poleReversal.html
___________________________
Warming Arctic linked to polar vortex outbreaks farther south
2021
Warmer air weakens the vortex, which normally keeps cold air trapped in Arctic, letting it go south
https://www.cbc.ca/news/science/warming-arctic-1.6163581
___________________________
Fremantle Sells Banner Factual Original ‘Arctic Drift: A Year In the Ice’ to 170 Territories (EXCLUSIVE)
Oct 8, 2021
https://variety.com/2021/tv/news/fremantle-arctic-drift-170-territories-1235084179/#!
___________________________
No scientific consensus yet on whether warming Arctic may lead to more extreme weather
2021
In
the past month alone, Germany, Belgium and the Netherlands have
suffered horrific flooding, Siberia caught fire, and the Arctic Sea
suffered near-record melting.
Meanwhile, in North America, after record-high temperatures, formerly rare fire thunderstorms have become near-daily events.
There
is one big theory connecting climate change to the weather patterns
behind events as disparate as fire and floods, heatwaves and melting
ice, across three different continents.
It is elegant,
reasonably easy to understand and has profound implications — but
because it is at the frontier of climate science, not all researchers
are yet convinced.
https://www.abc.net.au/news/2021-07-22/one-big-climate-theory/100311336
___________________________
Unraveling the Arctic’s Surprising Rain Surge
___________________________
Why Atlantic Hurricanes Are Getting Stronger Faster Than Other Storms
September 30, 2022
https://time.com/6218869/why-atlantic-hurricanes-are-getting-stronger/
___________________________
10 Incredible Weather Phenomena That Occur Only Once in a Lifetime


https://collectiveweather.com/10-incredible-weather-phenomena-that-occur-only-once-in-a-lifetime/
___________________________
10 Most Unpredictable Weather Phenomena
January 2, 2025
Supercells
Supercells are the giants of the storm world, commanding respect and caution from both meteorologists and storm chasers alike. These massive, swirling thunderstorms are capable of producing severe weather that can leave a trail of devastation in their wake. What makes supercells particularly daunting is their erratic nature. They can escalate rapidly, shifting from a benign cloud cluster to a full-blown storm with alarming speed. This unpredictability often leaves meteorologists scrambling to provide timely warnings. Within these colossal storms, conditions can be ripe for the formation of tornadoes, golf-ball-sized hail, and flash floods. Each minute with a supercell feels like walking on a tightrope—one wrong step, and everything changes.
Tornadoes
Heat Bursts

Heat bursts are the night owls of weather phenomena, known for their clandestine nature. Imagine going to bed on a cool night, only to wake up suddenly sweating as the temperature spikes dramatically.
This rare phenomenon occurs when warm, dry air plummets during a thunderstorm, causing a sharp temperature increase. The conditions surrounding a heat burst are incredibly specific—a perfect storm, if you will—which is why they are so rare.
Generally occurring at night, these temperature surges can catch people off guard, adding to their mysterious allure. While not particularly dangerous, the suddenness of a heat burst adds it to the list of unpredictable weather events.
Volcanic Lightning (Dirty Thunderstorms)
Volcanic lightning, also enchantingly referred to as “dirty thunderstorms,” is as mesmerizing as it is enigmatic. When a volcano erupts, it spews forth ash and particles into the atmosphere. These particulates can lead to the creation of static electricity, resulting in captivating lightning storms that illuminate the volcanic plume. The artwork painted by these electrical discharges against the darkened sky is nothing short of magical. Given the chaotic nature of volcanic activities and the conditions needed for electrical charges to accumulate, predicting these thunderstorms is extremely challenging. Despite their unpredictability, they offer a visual spectacle that photographers and scientists alike eagerly await.
Microbursts
Microbursts are like the “microwave bursts” of the weather world—intense, brief, and potentially destructive. These downbursts of wind occur when cold air descends swiftly during a thunderstorm, emitting high-speed winds upon impact with the ground. They can flatten trees and buildings in seconds and are especially perilous for aviation. Pilots dread the thought of encountering a microburst, as it can severely affect an aircraft’s lift, sometimes with disastrous consequences. One moment, the sky may seem calm, and the next, the air is whipping with intense force. It’s this sudden and localized destruction that keeps microbursts high on the list of unpredictable weather phenomena.
Polar Vortex Disruptions
The polar vortex is traditionally confined to the arctic regions, swirling with icy air. However, its boundaries are not always stable. When the vortex breaks apart, frigid air can spill southward, resulting in unexpected cold snaps in areas far from the poles. These disruptions are notorious for their unpredictability, transforming mild winters into brutally cold episodes. One day you might enjoy a sunny, crisp afternoon, and the next, you’re bundling up against bone-chilling winds. Such drastic shifts catch even the most prepared regions off guard, adding another layer of unpredictability to weather forecasting.
Haboobs (Dust Storms)
Haboobs, with their mysterious name and towering presence, paint a picture straight out of a desert scene. Massive walls of dust are stirred by collapsing thunderstorms, sweeping through arid regions with an ominous presence. The visual is cinematic, as these dust storms can reduce visibility to mere meters. What makes them particularly challenging to predict is their sudden onset and speed. One minute you’re basking in clear skies, and the next, you’re engulfed in a cloud of swirling dust. For travelers and residents in arid regions, the booth heralds caution and preparedness, a reminder of nature’s unpredictability.
Thundersnow
A weather marvel that fuses two seemingly opposing elements, thundersnow redefines what we know about winter storms. Picture a heavy snowstorm punctuated by dramatic flashes of lightning and rolls of thunder. As rare as it is surprising, thundersnow often accompanies intense winter storms. The conditions necessary for its formation are specific, making it a rarity, much like a blue moon. It’s not just the visual spectacle that captures attention—the eerie combination of snow muffling the landscape, contrasted with the roaring thunder, creates an unforgettable experience. For weather enthusiasts, witnessing thundersnow is akin to spotting a mythical creature.
Waterspouts
Cousins to tornadoes, waterspouts are swirling columns of air and water rising over oceans or lakes. While they appear less menacing than their terrestrial counterparts, their formation can be just as unpredictable. One moment the water is calm, and the next, a spout may form, twisting its way upward. They can pose serious threats to marine vessels and coastal areas, as their movements are hard to forecast. Waterspouts often dissipate without incident, yet their sudden appearance keeps mariners on their toes. While encounters with these swirling phenomena can make for thrilling tales, they are best observed from a safe distance.
Ball Lightning
Ball lightning is one of the most mystifying phenomena, fascinating scientists and curious minds alike. Imagine glowing spheres of light, floating through the air during a thunderstorm, defying explanation and capturing our imagination. Unlike typical lightning that zigzags across the sky, ball lightning is much more elusive, with no clear path or behavior. Their appearance can last from mere seconds to several minutes, leaving some to question if what they witnessed was real. Despite years of research, ball lightning remains one of the least understood weather occurrences, adding an element of mystery to storms. Witness stories often border on the incredulous, with ball lightning sometimes seen hovering outside windows or floating harmlessly through homes.
___________________________
The polar vortex above the Arctic has been spinning backwards for weeks. Here's why.
March 28, 2024
Atmospheric scientists were surprised earlier this month to notice that the Arctic's polar vortex reversed its trajectory as it began spinning in the opposite direction. What's more: It has yet to stop.
The change occurred around March 4 and is among the six strongest such events since 1979, Amy Butler, a climate scientist at the National Oceanic and Atmospheric Administration (NOAA), told Spaceweather.com.
The rotating mass of cold air that circles in the Arctic stratosphere is infamous for triggering extreme cold and storms in various regions, but fortunately that has not happened in this case, according to Butler, the author of NOAA's new polar vortex blog. Instead, what Butler calls "Sudden Stratospheric Warming events" led to an increase of polar ozone from lower latitudes surrounding the Arctic, causing the swirling reversal.
"Atmospheric planetary waves have been breaking in the polar stratosphere, increasing its temperature," Butler told SpaceWeather.com. "Also, warming air helps prevent chemical ozone loss."
The so-called "ozone spike" is the biggest in the month of March since record-keeping began in 1979, the outlet reported.
What is a polar vortex?
The stratospheric polar vortex is a large-scale region of circulating winds that helps to confine cold air to the polar regions, according to NASA.
But when it weakens or is disturbed, that cold air can leak into lower latitudes and cause major weather events.
Residing high up in the stratosphere about 30 miles above Earth's surface, the vortex is most prominent during the winter. The winds spin at speeds of around 155 mph, according to the U.K. Met Office, nearly matching the minimum wind speed for a Category 5 hurricane.
Disruptions to the polar vortex can cause severe weather in the U.S., such as in 2021 when Louisville, Kentucky saw "an abrupt end to the mostly tranquil weather the region had experienced for much of 2020," according to NOAA.
What caused the polar vortex reversal?
According to NOAA, the vortex has been noticeably active this winter.
The prevailing west-to-east "screaming-fast winds" circling the North Pole have completely reversed twice this year, the agency said in a March 20 blog post.
The culprit for the disruption lies on a sudden atmospheric warming caused by planetary waves that jostle the stratosphere from below and can reverse a vortex's flow, according to NOAA.
The disruptions can also have an effect on weather here in the U.S., such as the cold snap that the central region of the country experienced in January, NOAA said.
So how much longer should it last?
Butler told SpaceWeather.com that the winds are starting to slow down, meaning the ozone spike will subside and westerly winds will resume around the end of March.
https://www.usatoday.com/story/news/world/2024/03/28/polar-vortex-spinning-backwards/73129855007/
___________________________
The polar vortex is hitting the brakes
For much of this winter season, the polar vortex winds at 60°N have been racing around the stratospheric polar region. During February alone, these west-to-east winds were two times stronger than normal for that time of year. However, the latest forecasts suggest that the polar vortex is about to switch gears with a major vortex disruption to happen this weekend. Read on to find out why the polar vortex could be bottoming out early this season.
___________________________
Here’s What to Know About the Polar Vortex Collapse
Mar 6, 2025
https://time.com/7265299/what-to-know-polar-vortex-collapse/
___________________________
The pollution polar vortex
Feb 2025
https://www.arcticwwf.org/the-circle/stories/the-pollution-polar-vortex/
___________________________
'Major disruption' has caused Arctic polar vortex to slide off North Pole, scientists say
April 4, 2025
A major disruption to the Arctic polar vortex has bumped the ring of wind that circles the North Pole off its perch and towards Europe, a new animation shows.
The migration could trigger colder-than-average temperatures in parts of the continent and across the eastern U.S. over the coming week, climate scientists say.
The polar vortex started wandering off course March 9, when its high winds suddenly switched from blowing west to east to blowing in the opposite direction. This switch normally happens each year, but it tends to occur in mid-April — meaning this year's reversal struck unusually early, according to a blog post published April 3 by the National Oceanic and Atmospheric Administration (NOAA).
___________________________
Coldest January since 2011 brewing for US to lead to multiple winter storms
Dec 29, 2024
Dramatically colder conditions are ahead as an Arctic blast moves into
the U.S. starting next week. The bitterly cold pattern could be the
coldest January in more than a decade and may be strewn with winter
storms for the Midwest, South and East.
___________________________
La Nina is Not Going Away. What Does This Mean for This Summer’s Weather?
2022
___________________________
Understanding the Arctic polar vortex
Polar vortex versus polar jet stream
The Arctic polar vortex is a band of strong westerly winds that forms in the stratosphere between about 10 and 30 miles above the North Pole every winter. The winds enclose a large pool of extremely cold air. (There is an even stronger polar vortex in the Southern Hemisphere stratosphere in its winter.) The stronger the winds, the more the air inside is isolated from warmer latitudes, and the colder it gets.
According to NOAA stratosphere expert Amy Butler, people often confuse the polar vortex with the polar jet stream, but the two are in completely separate layers of the atmosphere. The polar jet stream occurs in the troposphere, at altitudes between 5-9 miles above the surface. It marks the boundary between surface air masses, separating warmer, mid-latitude air and colder, polar air. It’s the polar jet stream that plays such a big role in our day-to-day winter weather in the mid-latitudes, not the polar vortex.
The polar vortex and our winter weather
The polar vortex doesn’t always influence winter weather in the mid-latitudes. When it does, however, the effects can be extreme. When the polar vortex is especially strong, for example, the polar jet steam tends to stay farther north and to exhibit a more zonal flow, with less meandering. At the surface, this stable stratospheric state is often associated with an even colder than usual Arctic, and milder-than-usual weather in the mid-latitudes. The Arctic Oscillation, which tracks hemisphere-scale wind and air pressure patterns, is often positive.
At the other extreme, the polar vortex is occasionally knocked off kilter when especially strong atmospheric waves in the troposphere break upward into the stratosphere. The vortex slows, and it may wobble, slide off the pole, split into several lobes, or—in the most extreme cases—temporarily reverse direction. Regardless of their “flavor,” these disruptions have one thing in common: a spike in polar stratosphere temperatures, which is why they’re called sudden stratospheric warmings.
In the weeks following the stratospheric upheaval, the polar jet stream will often develop a wavy shape, with deep troughs and steep ridges that can become nearly stationary for days. The exact nature of the interaction—how the polar jet “feels” the disruption in the polar vortex and why it reacts the way it does—isn’t fully understood. Under the high-pressure ridges, warm air floods north into parts of the Arctic, often driving extreme melt, while polar air fills the low-pressure troughs, bringing wintry conditions farther south than average. The Arctic Oscillation often slips into its negative phase.
The polar vortex and the February 2021 cold extreme in the south-central United States
According to Butler, it’s reasonable to suppose that the polar vortex played a role in the extreme winter weather outbreak that struck the Southern Plains in late February. There is plenty of research linking disruptions of the stratospheric polar vortex to extreme cold air outbreaks in the mid-latitudes of the United States or Eurasia a few weeks later.
“We did have a sudden stratospheric warming in January,” explained Butler. “The polar vortex weakened. It got stretched out of shape
and slid southward off the pole. Most of the time when this happens—and
it happens on average about every other year in the Arctic—some part of
the mid-latitudes will ultimately experience a cold air outbreak. The
disruption of the vortex encouraged the polar jet stream to become
wavier for several weeks, and in combination with other weather
patterns, created favorable conditions for a severe cold air outbreak in
the central U.S.”
On the other hand, she said, plenty of Arctic cold air outbreaks happen in a given winter without any help from the polar vortex. Not to mention, sometimes the polar vortex is disrupted and there are few, if any, impacts on the weather down at the surface. So blaming the event solely on the polar vortex would be a stretch. (For a perspective on the possible role played Pacific ocean temperature patterns in a similar event that occurred in winter of 2013/14 and might be at play during this event, check out Dennis Hartmann’s ENSO blog post and his updated comments.)
The polar vortex and global warming
Among the questions readers have been asking us is whether global warming is affecting the polar vortex in a way that would—paradoxically—make severe winter weather outbreaks in the mid-latitudes more likely. According to Butler, the idea isn’t as counter-intuitive as it seems at first glance.
“For example, disruptions of the polar vortex occur when the vortex is bumped from below by large-scale atmospheric waves flowing around the troposphere,” said Butler. “The waves are always there, but anything that changes their strength or location—including changes in surface temperature and pressure that result from sea ice loss—can potentially influence the polar vortex. So the idea would be that even though you have an overall warming trend, you might see an increase in the severity of individual winter weather events in some locations.”
Among the possibilities is that the polar vortex’s “preferred” location may be sensitive to regional variations in sea ice cover. For example, one study linked lower-than-average February sea ice extent in the eastern Arctic’s Barents and Kara Seas to a shift in the polar vortex toward Eurasia between the 1980s and the 2000s. The vortex shift was accompanied by colder-than-average winters across Siberia and the mid-latitudes of central Eurasia.
No clear trend, but limited data
But while the hypothesis is plausible, Butler said, “I don’t think there is any convincing evidence of a long-term trend in the polar vortex. What we see in the record is this very interesting period in the 1990s, when there were no sudden stratospheric warming events observed in the Arctic. In other words, the vortex was strong and stable. But then they started back up again in the late 1990s, and over the next decade there was one almost every year. So there was a window of time in the early 2010s where it seemed like there might be a trend toward weaker, more disrupted or shifted states of the Arctic polar vortex. But it hasn’t continued, and more and more, it’s looking like what seemed to be the beginning of a trend was just natural variability, or maybe just a rebound from the quiet of the 1990s...”
https://www.climate.gov/news-features/understanding-climate/understanding-arctic-polar-vortex
___________________________
The Transpolar Drift conveys methane from the Siberian Shelf to the central Arctic Ocean
14 March 2018
Abstract
Methane sources and sinks in the Arctic are poorly quantified. In particular, methane emissions from the Arctic Ocean and the potential sink capacity are still under debate. In this context sea ice impact on and the intense cycling of methane between sea ice and Polar surface water (PSW) becomes pivotal. We report on methane super- and under-saturation in PSW in the Eurasian Basin (EB), strongly linked to sea ice-ocean interactions. In the southern EB under-saturation in PSW is caused by both inflow of warm Atlantic water and short-time contact with sea ice. By comparison in the northern EB long-time sea ice-PSW contact triggered by freezing and melting events induces a methane excess. We reveal the Ttranspolar Drift Stream as crucial for methane transport and show that inter-annual shifts in sea ice drift patterns generate inter-annually patchy methane excess in PSW. Using backward trajectories combined with δ18O signatures of sea ice cores we determine the sea ice source regions to be in the Laptev Sea Polynyas and the off shelf regime in 2011 and 2015, respectively. We denote the Transpolar Drift regime as decisive for the fate of methane released on the Siberian shelves.
https://www.nature.com/articles/s41598-018-22801-z
___________________________
New study solves long-standing mystery of what may have triggered ice age
June 24, 2022
https://phys.org/news/2022-06-long-standing-mystery-triggered-ice-age.html
___________________________
Cracking the case of Arctic sea ice breakup
June 1, 2022
A
distributed sensor network may help researchers identify the physical
processes contributing to diminishing sea ice in the planet’s
fastest-warming region.
https://news.mit.edu/2022/cracking-case-arctic-sea-ice-breakup-0601
___________________________
Scientists stunned by ‘unthinkable’ temperature surge in Arctic, Antarctica
March 21, 2022
There
has been an “unthinkable” simultaneous surge in temperatures in the
Arctic and Antarctic, stunning scientists around the world
https://www.news.com.au/technology/environment/massive-temperature-surge-in-arctic-antarctica-stuns-scientists/news-story/66b28bc3e55649b4fc0a0ce4cbb02d62
___________________________
Sea level rise
https://en.wikipedia.org/wiki/Sea_level_rise
___________________________
King tide
A king tide is an especially high spring tide, especially the perigean spring tides which occur three or four times a year. King tide is not a scientific term, nor is it used in a scientific context.
The expression originated in Australia, New Zealand and other Pacific nations to describe especially high tides that occur a few times per year. It is now used in North America as well,[1] particularly in low-lying South Florida, where king tides can cause tidal flooding. In Vancouver, Canada, king tides are a growing problem along its seawall.
Definition
King tides are the highest tides. They are naturally occurring, predictable events.
Tides are the movement of water across Earth's surface caused by the combined effects of the gravitational forces exerted by the Moon, Sun, and the rotation of Earth which manifest in the local rise and fall of sea levels. Tides are driven by the relative positions of the Earth, Sun, Moon, land formations, and relative location on Earth. In the lunar month, the highest tides occur roughly every 14 days, at the new and full moons, when the gravitational pull of the Moon and the Sun are in alignment. These highest tides in the lunar cycle are called spring tides.
The proximity of the Moon in relation to Earth and Earth in relation to the Sun also has an effect on tidal ranges. The Moon moves around Earth in an elliptic orbit that takes about 29 days to complete. The gravitational force is greatest when the Moon is at perigee – closest to Earth – and least when it is at apogee – farthest from Earth – about two weeks after perigee. The Moon has a larger effect on the tides than the Sun, but the Sun's position also has an influence on the tides. Earth moves around the Sun in an elliptic orbit that takes a little over 365 days to complete. Its gravitational force is greatest when the Earth is at perihelion – closest to the Sun in early January – and least when the Earth is at aphelion – farthest from the Sun in early July.
The king tides occur at new and full moon when the Earth, Moon and Sun are aligned at perigee and perihelion, resulting in the largest tidal range seen over the course of a year. So, tides are enhanced when the Earth is closest to the Sun around January 2 of each year. They are reduced when it is furthest from the Sun, around July 2.[3]
The predicted heights of a king tide can be further augmented by local weather patterns and ocean conditions.
https://en.wikipedia.org/wiki/King_tide
___________________________
Bay of Fundy Tides: The Highest Tides in the World!
Twice everyday the bay fills and empties of a billion tonnes of water during each tide cycle—that’s more than the flow of all the world’s freshwater rivers combined.
The Bay of Fundy has the highest tides in the world, and those enormous tides alone make that the Bay of Fundy is one of the world’s greatest natural wonders.
The height of the tide difference ranges from 3.5 meters (11ft) along the southwest shore of Nova Scotia and steadily increases as the flood waters travel up the 280 km (174 miles) of shoreline to the head of the Bay where, in the Minas Basin, the height of the tide can reach an incredible 16 meters (53ft)
The force created by these mighty waters is equal to 8000 locomotives or 25 million horses at the Minas Channel. The immense energy of the tides stir up nutrients from the ocean floor, the mud flats and salt water marshes, providing an abundance of food for the birds, whales, fish and bottom dwellers that visit or call Fundy home.
This highly productive, rich and diverse natural ecosystem has shaped the environment, the economy and the culture of the Fundy region. The effect of the world’s highest tides on the Bay’s shores has created dramatic cliffs and awesome sea stacks. The red sandstone and volcanic rock have been worn away to reveal fossils from over 300 million years ago.
What Causes the Tides?
Tides are considered the heartbeat of our planet’s oceans. They are the periodic rise and fall of the earth’s bodies of open water, and are a result of the gravitational pull of the moon and sun on the earth, as well as the perpetual spinning rotation of the earth itself.
By far the largest influence is the gravitational effect of the moon as it pulls the water toward itself, making a bulge on the surface of the ocean at the side of the moon (lunar tide).
At the same time, the centrifugal force (caused by the spinning of the Earth-Moon system) acting on the water particles at earth’s surface opposite the moon,creates a second bulge. These bulges are what we refer to as high tide.
As the moon revolves around the earth the bulges shift with it causing a shift in the water level. It’s the combination of the speed at which the earth rotates on its own axis (once in 24 hours), and the speed at which the moon revolves around the earth (in 27.3 days), that dictate the time it takes to go from high to low tide.
Because the moon orbits in the same direction the earth rotates around its axis, it takes a little more than a day—24 hours and 53 minutes—for the earth to fully rotate in relation to the moon (i.e. where from a fixed point on earth the moon appears in the same position in the sky as a day earlier). (Kudos to Gord Steadman for providing the proper wording)
Since the effect of the moon is the same when it’s straight “above” us as when it’s straight “underneath” us, one tide cycle (from high to high, or low to low) takes half that time: about 12 hours and 26 minutes. This in turn means that the time between a high tide and a low tide (and vice versa) is, on average, six hours and 13 minutes. This explains why tides arrive at the same location almost an hour later each day.
___________________________
Tide
https://en.wikipedia.org/wiki/Tide#Principal_lunar_semi-diurnal_constituent
___________________________
Slack tide
Slack tide or slack water is the short period in a body of tidal water when the water is completely unstressed, and there is no movement either way in the tidal stream. It occurs before the direction of the tidal stream reverses.[1] Slack water can be estimated using a tidal atlas or the tidal diamond information on a nautical chart.[2] The time of slack water, particularly in constricted waters, does not occur at high and low water,[3] and in certain areas, such as Primera Angostura, the ebb may run for up to three hours after the water level has started to rise. Similarly, the flood may run for up to three hours after the water has started to fall. In 1884, Thornton Lecky illustrated the phenomenon with an inland basin of infinite size, connected to the sea by a narrow mouth. Since the level of the basin is always at mean sea level, the flood in the mouth starts at half tide, and its velocity is at its greatest at the time of high water, with the strongest ebb occurring conversely at low water.[4]
Implications for seafarers
For scuba divers, the absence of a flow means that less effort is required to swim and there is less likelihood of drifting away from a vessel or shore. Slack water following high tide can improve underwater visibility, as the previously incoming tide brings clear water with it. Following low tide, visibility can be reduced as the ebb draws silt, mud, and other particulates with it. In areas with potentially dangerous tides and currents, it is standard practice for divers to plan a dive at slack times.
For any vessel, a favourable flow will improve the vessel's speed over the bottom for a given speed in the water. Difficult channels are also more safely navigated during slack water, as any flow may set a vessel out of a channel into danger.
Combined tidal stream and current
In many locations, in addition to the tidal streams there is also a current causing the tidal stream in the one direction to be stronger than, and last for longer than the stream in the opposite direction six hours later. Variations in the strength of that current will also vary the time when the stream reverses, thus altering the time and duration of slack water. Variations in wind stress also directly affect the height of the tide, and the inverse relationship between the height of the tide and atmospheric pressure is well understood (1 cm change in sea level for each 1 mb change in pressure) while the duration of slack water at a given location is inversely related to the height of the tide at that location.
Misconceptions
https://en.wikipedia.org/wiki/Slack_tide
___________________________
Sea level
https://en.wikipedia.org/wiki/Sea_level
___________________________
What are spring and neap tides?
A spring tide—popularly known as a "King Tide"—refers to the 'springing forth' of the tide during new and full moon.
A neap tide—seven days after a spring tide—refers to a period of moderate tides when the sun and moon are at right angles to each other.
Tides are long-period waves that roll around the planet as the ocean is "pulled" back and forth by the gravitational pull of the moon and the sun as these bodies interact with the Earth in their monthly and yearly orbits.
During full or new moons—which occur when the Earth, sun, and moon are nearly in alignment—average tidal ranges are slightly larger. This occurs twice each month. The moon appears new (dark) when it is directly between the Earth and the sun. The moon appears full when the Earth is between the moon and the sun. In both cases, the gravitational pull of the sun is "added" to the gravitational pull of the moon on Earth, causing the oceans to bulge a bit more than usual. This means that high tides are a little higher and low tides are a little lower than average.
These are called spring tides, a common historical term that has nothing to do with the season of spring. Rather, the term is derived from the concept of the tide "springing forth." Spring tides occur twice each lunar month all year long, without regard to the season.
Seven days after a spring tide, the sun and moon are at right angles to each other. When this happens, the bulge of the ocean caused by the sun partially cancels out the bulge of the ocean caused by the moon. This produces moderate tides known as neap tides, meaning that high tides are a little lower and low tides are a little higher than average. Neap tides occur during the first and third quarter moon, when the moon appears "half full."
https://oceanservice.noaa.gov/facts/springtide.html
___________________________
Experts Head to Arctic to Assess Climate Change Impact Amid Record Heatwave
https://www.msn.com/en-us/weather/topstories/experts-head-to-arctic-to-assess-climate-change-impact-amid-record-heatwave/ar-AAZ5R41
___________________________
Melting Arctic ice could transform international shipping routes, study finds
June 20, 2022
https://phys.org/news/2022-06-arctic-ice-international-shipping-routes.html
___________________________
Oceanic
lithosphere magnetization: Marine magnetic investigations of crustal
accretion and tectonic processes in mid-ocean ridge environments
September 2008
https://www.researchgate.net/publication/33548977_Oceanic_lithosphere_magnetization_Marine_magnetic_investigations_of_crustal_accretion_and_tectonic_processes_in_mid-ocean_ridge_environments
___________________________
Post-glacial rebound
Post-glacial rebound (also called isostatic rebound or crustal rebound) is the rise of land masses after the removal of the huge weight of ice sheets during the last glacial period, which had caused isostatic depression. Post-glacial rebound and isostatic depression are phases of glacial isostasy (glacial isostatic adjustment, glacioisostasy), the deformation of the Earth's crust in response to changes in ice mass distribution. The direct raising effects of post-glacial rebound are readily apparent in parts of Northern Eurasia, Northern America, Patagonia, and Antarctica. However, through the processes of ocean siphoning and continental levering, the effects of post-glacial rebound on sea level are felt globally far from the locations of current and former ice sheets.
Global sea levels
To form the ice sheets of the last Ice Age, water from the oceans evaporated, condensed as snow and was deposited as ice in high latitudes. Thus global sea level fell during glaciation.
The ice sheets at the last glacial maximum were so massive that global sea level fell by about 120 metres. Thus continental shelves were exposed and many islands became connected with the continents through dry land. This was the case between the British Isles and Europe (Doggerland), or between Taiwan, the Indonesian islands and Asia (Sundaland). A land bridge also existed between Siberia and Alaska that allowed the migration of people and animals during the last glacial maximum.
The fall in sea level also affects the circulation of ocean currents and thus has important impact on climate during the glacial maximum.
During deglaciation, the melted ice water returns to the oceans, thus sea level in the ocean increases again. However, geological records of sea level changes show that the redistribution of the melted ice water is not the same everywhere in the oceans. In other words, depending upon the location, the rise in sea level at a certain site may be more than that at another site. This is due to the gravitational attraction between the mass of the melted water and the other masses, such as remaining ice sheets, glaciers, water masses and mantle rocks and the changes in centrifugal potential due to Earth's variable rotation.

A model of present-day mass change due to post-glacial rebound and the reloading of the ocean basins with seawater. Blue and purple areas indicate rising due to the removal of the ice sheets. Yellow and red areas indicate falling as mantle material moved away from these areas in order to supply the rising areas, and because of the collapse of the forebulges around the ice sheets.

This layered beach at Bathurst Inlet, Nunavut is an example of post-glacial rebound after the last Ice Age. Little to no tide helped to form its layer-cake look. Isostatic rebound is still underway here.
https://en.wikipedia.org/wiki/Post-glacial_rebound
___________________________
Isostatic depression
Isostatic depression is the sinking of large parts of the Earth's crust into the asthenosphere caused by a heavy weight placed on the Earth's surface, often glacial ice during continental glaciation. Isostatic depression and isostatic rebound occur at rates of centimeters per year. Greenland is an example of an isostatically depressed region.
Glacial isostatic depression
Isostatic depression is a phase of glacial isostasy, along with isostatic rebound. Glacial isostasy is the Earth's response to changing surface loads of ice and water during the expansion and contraction of large ice sheets. The Earth's asthenosphere acts viscoelastically, flowing when exposed to loads and non-hydrostatic stress, such as ice sheets, for an extended period of time. The Earth's crust is depressed by the product of thickness of ice and the ratio of ice and mantle densities. This large ice load results in elastic deformation of the entire lithospheric mantle over the span of 10,000-100,000 years, with the load eventually supported by the lithosphere after the limit of local isostatic depression has been attained. Historically, isostatic depression has been used to estimate global ice volume by relating the magnitude of depression to the density of ice and upper mantle material.
Glacial megalakes can form in regional depressions under the influence of glacial load.
Isostatic depression in Greenland
Greenland is isostatically depressed by the Greenland ice sheet. However, due to deglaciation induced by climate change, the regions near the shrinking ice sheet have begun to uplift, a process known as post-glacial rebound. Modeling these glacial isostatic adjustments has been an area of interest for some time now as the entire topography of Greenland is affected by these movements. These movements are unique in that they can be observed on a human time scale unlike other geological processes. Models have been created to assess what future equilibrium states of the Greenland ice sheet will look like.
https://en.wikipedia.org/wiki/Isostatic_depression
___________________________
Raised beach
A raised beach, coastal terrace, or perched coastline is a relatively flat, horizontal or gently inclined surface of marine origin, mostly an old abrasion platform which has been lifted out of the sphere of wave activity (sometimes called "tread"). Thus, it lies above or under the current sea level, depending on the time of its formation. It is bounded by a steeper ascending slope on the landward side and a steeper descending slope on the seaward side (sometimes called "riser"). Due to its generally flat shape, it is often used for anthropogenic structures such as settlements and infrastructure.
A raised beach is an emergent coastal landform. Raised beaches and marine terraces are beaches or wave-cut platforms raised above the shoreline by a relative fall in the sea level.
Around the world, a combination of tectonic coastal uplift and Quaternary sea-level fluctuations has resulted in the formation of marine terrace sequences, most of which were formed during separate interglacial highstands that can be correlated to marine isotope stages (MIS).
A marine terrace commonly retains a shoreline angle or inner edge, the slope inflection between the marine abrasion platform and the associated paleo sea cliff. The shoreline angle represents the maximum shoreline of a transgression and therefore a paleo-sea level.
https://en.wikipedia.org/wiki/Raised_beach
___________________________
Isostatic Rebound: How Earth’s Surface Rises after Glaciers Retreat
January 3, 2025
The Earth’s surface is constantly shifting. One process that illustrates this is isostatic rebound, also referred to as post-glacial rebound or glacial isostatic adjustment. This phenomenon occurs as land that was once compressed under the weight of glaciers slowly rises back up—a process that can take thousands of years.
What causes isostatic rebound?
During the last Ice Age, large ice sheets covered vast areas of the Northern Hemisphere. These ice sheets were so heavy that they pressed down on the Earth’s crust, pushing it into the softer mantle below. When the ice began to melt, the pressure was released, and the crust started to rise back to its original elevation. This upward movement isn’t instantaneous; it takes place at a slow pace, with some areas still rebounding today.
This rate of the Earth’s crust rising back up is called Isostatic rebound, or post-glacial rebound or glacial isostatic adjustment. Regions that experienced heavy glaciation during the Ice Age, such as parts of Scandinavia and Canada, are where isostatic rebound is most noticeable.
Notable examples of isostatic rebound
Scandinavia
An example of isostatic rebound can be found in Scandinavia. Here, the land that was once buried under the Fennoscandian Ice Sheet continues to rise at a rate of several millimeters per year. Over the past 10,000 years, some parts of the region have risen by 286 meters as the Earth’s crust adjusts to the loss of the ice sheet’s weight. This ongoing rebound has reshaped coastlines and created new landforms, providing evidence of the region’s glacial history.
Hudson Bay, Canada
In Canada, the land around Hudson Bay is also rebounding from the effects of the Laurentide Ice Sheet, which covered much of North America during the last Ice Age. The rebound in this region, while slower compared to Scandinavia, continues to shape the area’s landscape.
Kvarken Archipelago, Finland
The Kvarken Archipelago in Finland also experiences isostatic rebound. According to NASA, this region sees uplift at approximately 9 millimeters per year, with about 700 hectares of new land emerging from the sea annually. This process is transforming the shallow coastline and creating new islands.
The Kvarken Archipelago has features like the De Geer moraines, which are ridges formed by sediment deposited at the edges of retreating glaciers. These moraines are typically 1 to 2 kilometers long, 2 to 5 meters high, and spaced 50 to 200 meters apart. As the land rises, these glacial features become more visible, providing a record of past glacial activity.
Recent advancements in LiDAR technology have uncovered additional moraines in southern and western Finland, giving scientists a more detailed understanding of how glaciers shaped the terrain.
Scientists believe the formation and spacing of De Geer moraines are influenced by the rate of ice retreat, water depth, and underlying terrain. Recent LiDAR-based elevation models have revealed more of these formations in southern and western Finland than previously known, offering new insights into glacial dynamics.
Over the next several thousand years, the land is expected to continue rising until the remaining 100 meters of depression caused by the ice are balanced. Geophysical and climate models help predict how the landscape will evolve, but the rate of apparent uplift will also depend on global sea level changes.
Forebulge
While areas directly under former ice sheets rise, regions at the edges of those ice sheets—known as the forebulge—experience the opposite effect. During glaciation, the weight of the ice caused the crust at the ice sheet’s periphery to bulge upward. As the ice melted and the land beneath it began to rebound, this forebulge started to collapse, causing the surrounding regions to sink.
This process, known as forebulge collapse, significantly impacts local sea levels. For instance, while areas like Scandinavia experience falling relative sea levels due to land uplift, regions affected by forebulge collapse, such as parts of the Eastern United States, face rising relative sea levels.
Around Chesapeake Bay, the land is sinking due to forebulge collapse. According to NOAA, this subsidence could result in land sinking by as much as half a foot over the next century, compounding the effects of rising global sea levels. This makes forebulge collapse a critical factor in understanding the challenges faced by coastal communities.
Isostatic rebound is ongoing
The process of isostatic rebound is ongoing. In places like the Kvarken Archipelago, scientists estimate that the land will continue to rise for thousands of years, with some areas potentially rebounding by another 100 meters before reaching equilibrium. Advances in geophysical and climate modeling are helping researchers predict how landscapes will evolve as this process continues.
At the same time, isostatic rebound helps scientists understand Earth’s glacial past. Features like the De Geer moraines and newly exposed landforms provide insights into the dynamics of glacial retreat and the interactions between ice, land, and sea.
https://www.geographyrealm.com/isostatic-rebound-glaciers/
___________________________
Dynamic regimes of the Greenland Ice Sheet emerging from interacting melt–elevation and glacial isostatic adjustment feedbacks
22 Jul 2022
https://esd.copernicus.org/articles/13/1077/2022/
___________________________
Constraints on the Greenland Ice Sheet since the Last Glacial Maximum from sea-level observations and glacial-rebound models
2003
https://www.sciencedirect.com/science/article/abs/pii/S0277379103003147
___________________________
Timescales of glacial isostatic adjustment in Greenland: is transient rheology required?
11 March 2024
SUMMARY
The possibility of a transient rheological response to ice age loading, first discussed in the literature of the 1980s, has received renewed attention. Transient behaviour across centennial to millennial timescales has been invoked to reconcile apparently contradictory inferences of steady-state (Maxwell) viscosity based on two distinct data sets from Greenland: Holocene sea-level curves and Global Navigation Satellite System (GNSS) derived modern crustal uplift data. To revisit this issue, we first compute depth-dependent Fréchet kernels using 1-D Maxwell viscoelastic Earth models and demonstrate that the mantle resolving power of the two Greenland data sets is highly distinct, reflecting the differing spatial scale of the associated surface loading: the sea-level records are sensitive to viscosity structure across the entire upper mantle while uplift rates associated with post-1000 CE fluctuations of the Greenland Ice Sheet have a dominant sensitivity to shallow asthenosphere viscosity. Guided by these results, we present forward models which demonstrate that a moderate low viscosity zone beneath the lithosphere in Maxwell Earth models provides a simple route to simultaneously reconciling both data sets by significantly increasing predictions of present-day uplift rates in Greenland whilst having negligible impact on predictions of Holocene relative sea-level curves from the region. Our analysis does not rule out the possibility of transient deformation, but it suggests that it is not required to simultaneously explain these two data sets. A definitive demonstration of transient behaviour requires that one account for the resolving power of the data sets in modelling the glacial isostatic adjustment process.
https://academic.oup.com/gji/article/237/2/989/7625600?login=false
___________________________
Bed roughness beneath the Greenland ice sheet
10 July 2017
https://www.cambridge.org/core/journals/journal-of-glaciology/article/bed-roughness-beneath-the-greenland-ice-sheet/B6B991B737795C6B5AF10B2A6D0EE177
___________________________
Changes in a Greenland Glacier Hid a Grim Truth of Ice Sheet's Destruction
06 February 2025
https://www.sciencealert.com/changes-in-a-greenland-glacier-hid-a-grim-truth-of-ice-sheets-destruction
___________________________
Greenland's Ice Sheet Was Growing. Now It's in a Terrifying Decline
April 23, 2019
https://www.livescience.com/65302-greenland-ice-melting-so-much-faster.html
___________________________
Plate Movement - 200 Million Years Ago to Today
https://www.iris.edu/hq/inclass/animation/plate_movement__200_million_years_ago_to_today
___________________________
Geomagnetic reversal
https://www.creationwiki.org/Geomagnetic_reversal
___________________________
Earth’s magnetic field broke down 42,000 years ago and caused massive sudden climate change
February 18, 2021
The
world experienced a few centuries of apocalyptic conditions 42,000
years ago, triggered by a reversal of the Earth’s magnetic poles
combined with changes in the Sun’s behaviour. That’s the key finding of
our new multidisciplinary study, published in Science.
This last
major geomagnetic reversal triggered a series of dramatic events that
have far-reaching consequences for our planet. They read like the plot
of a horror movie: the ozone layer was destroyed, electrical storms
raged across the tropics, solar winds generated spectacular light shows
(auroras), Arctic air poured across North America, ice sheets and
glaciers surged and weather patterns shifted violently.
During
these events, life on earth was exposed to intense ultraviolet light,
Neanderthals and giant animals known as megafauna went extinct, while
modern humans sought protection in caves.
https://theconversation.com/earths-magnetic-field-broke-down-42-000-years-ago-and-caused-massive-sudden-climate-change-155580
___________________________
Scientists Discovered How Neanderthals Conquered the Ice Age
Jan 12, 2023
https://www.youtube.com/watch?v=_GoboLaTFMs
___________________________
Pole Shift Is HAPPENING! Earth's Magnetic Field Is Getting Weaker!
Feb 4, 2023
https://www.youtube.com/watch?v=0d55np01aPU
___________________________
What forms when iron rich minerals in cooling lava align with the direction of Earth’s magnetic field?
April 16, 2022
___________________________
Earth's Magnetic Field and Wandering Poles
March 06, 2019
https://www.livescience.com/64930-earths-magenetic-field.html
___________________________
Does a current reversal also reverse a magnetic field’s polarity?
https://www.quora.com/Does-a-current-reversal-also-reverse-a-magnetic-field%E2%80%99s-polarity?share=1
___________________________
Magnet and Neuron Model Also Predicts Arctic Sea Ice Melt
July 24, 2019
https://www.scientificamerican.com/article/magnet-and-neuron-model-also-predicts-arctic-sea-ice-melt/
___________________________
Secret Earth - The Dark Side Of Google Earth
Nov 15, 2021
https://www.youtube.com/watch?v=YM_TDWankJc
___________________________
Sedimentation rates in the Makarov Basin, central Arctic Ocean: A paleomagnetic and rock magnetic approach
2001
https://www.deepdyve.com/lp/wiley/sedimentation-rates-in-the-makarov-basin-central-arctic-ocean-a-D00DSV2hAA
___________________________
Climate Change Has Shifted the Locations of Earth's North and South Poles
May 14, 2013
Increased
melting of the Greenland Ice Sheet and other ice losses worldwide have
helped to move the North Pole several centimeters east each year since
2005
https://www.scientificamerican.com/article/climate-change-has-shifted-location-north-south-poles/
___________________________
Earth’s last magnetic reversal took less than 100 years
October 16, 2014
https://earthsky.org/earth/earths-magnetic-field-could-flip-within-a-human-lifetime/
___________________________
Predural Depression Structures in the Arctic Urals Magnetic Field
02 February 2019
https://link.springer.com/chapter/10.1007/978-3-319-97670-9_45
___________________________
Earth's Magnetosphere: Protecting Our Planet from Harmful Space Energy
August 3, 2021
Unlike
Mercury, Venus, and Mars, Earth is surrounded by an immense magnetic
field called the magnetosphere. Generated by powerful, dynamic forces at
the center of our world, our magnetosphere shields us from erosion of
our atmosphere by the solar wind (charged particles our Sun continually
spews at us), erosion and particle radiation from coronal mass ejections
(massive clouds of energetic and magnetized solar plasma and
radiation), and cosmic rays from deep space. Our magnetosphere plays the
role of gatekeeper, repelling this unwanted energy that’s harmful to
life on Earth, trapping most of it a safe distance from Earth’s surface
in twin doughnut-shaped zones called the Van Allen Belts...
https://climate.nasa.gov/news/3105/earths-magnetosphere-protecting-our-planet-from-harmful-space-energy/
___________________________
Alfred Wegener’s Continental Drift Hypothesis
Jun 8, 2020
https://geo.libretexts.org/Courses/Gettysburg_College/Book%3A_An_Introduction_to_Geology_(Johnson_Affolter_Inkenbrandt_and_Mosher)/02%3A_Plate_Tectonics/2.01%3A_Alfred_Wegeners_Continental_Drift_Hypothesis
___________________________
Mid-Ocean Ridges and Mantle Plumes Answer Sheet - Version 2
https://www.coursehero.com/file/154193561/Mid-Ocean-Ridges-and-Mantle-Plumes-Answer-Sheet-Version-2-Taggedpdf/
___________________________
Tectonic degassing drove global temperature trends since 20 Ma
30 Jun 2022
https://www.science.org/doi/10.1126/science.abl4353
___________________________
How Do Magnetic Stripes Form on the Ocean Floor?
March 30, 2020
https://www.reference.com/geography/magnetic-stripes-form-ocean-floor-b47cded5a73b2ce8
___________________________
Variability
of Sea-Surface Magnetic Anomalies at Ultraslow Spreading Centers:
Consequence of Detachment Faulting and Contrasted Magmatism?
31 January 2022
https://agupubs.onlinelibrary.wiley.com/doi/abs/10.1029/2021GL097276
___________________________
Where does magnetic striping exist?
At
the mid-ocean ridge spreading axis, these flips in the direction of the
Earth's magnetic field are recorded in the magnetization of the lava.
This creates a symmetrical pattern of magnetic stripes of opposite
polarity on either side of mid-ocean ridges.
Where does magnetic striping occur?
Magnetic
Striping is when the sea floor is spreading, and magma from the mantle
is rising through the Earth's crust. That magma then turns into new
crust, forming the "Oceanic Crust".
Where can magnetic anomalies be found?
As
new crust is produced in Earth's mid-oceanic ridges and the seafloor
spreads, they move in recognizable, stripe-like patterns. You can also
spot magnetic anomalies—places with unusually high amounts of
magnetism—on the map. One such anomaly is in the Central African
Republic.
https://scottick.firesidegrillandbar.com/where-does-magnetic-striping-exist
___________________________
Sea Floor Spreading
Plate Tectonics and the Sea Floor
2016
https://www.most.org/wp-content/uploads/2016/10/Sea_Floor_SpreadingMSA.pdf
___________________________
Magnetic anomaly map of Ori Massif and its implications for oceanic plateau formation
2018
https://www.sciencedirect.com/science/article/abs/pii/S0012821X18304953
___________________________
Magnetometers
revealed that the basalt rocks along the mid-ocean ridges are aligned
in alternating, symmetrical patters. Which factors are responsible for
this orientation?
2018
https://brainly.com/question/10623762
___________________________
Magnetic Anomalies over the Mid-Atlantic Ridge near 27{degrees}N
1967
https://pubmed.ncbi.nlm.nih.gov/17792827/
___________________________
How active is the Mid-Atlantic Ridge?
June 25, 2024
How active is the Mid-Atlantic Ridge?
The Mid-Atlantic Ridge is an actively spreading underwater mountain range located in the Atlantic Ocean. It is a divergent plate boundary where the North American Plate and the Eurasian Plate move apart from each other. Here are some answers to frequently asked questions about the activity of the Mid-Atlantic Ridge:
What is currently happening to the Mid-Atlantic Ridge?
The plates at the Mid-Atlantic Ridge are still moving apart, causing the Atlantic to grow at a rate of about 2.5 cm per year in an east-west direction.
https://www.ncesc.com/geographic-faq/how-active-is-the-mid-atlantic-ridge/
___________________________
Why are there volcanoes along the Mid-Atlantic Ridge?
June 25, 2024
The Mid-Atlantic Ridge is a massive underwater mountain range that runs through the middle of the Atlantic Ocean. It is the boundary where the North American and Eurasian tectonic plates meet and move apart from each other. The volcanic activity along the Mid-Atlantic Ridge is a result of the plates pulling away from each other, allowing magma from beneath the ocean floor to rise to the surface. This process creates new seafloor and forms new volcanic structures, including ridges, plateaus, islands, and seamounts.
How are volcanoes formed along the Mid-Atlantic Ridge?
As the plates are pulling away, magma from a dozen kilometers below the ocean floor rises to the surface, forming new seafloor. This process of massive volcanic events gives rise to large structures, such as ridges, plateaus, islands, and seamounts.
https://www.ncesc.com/geographic-faq/why-are-there-volcanoes-along-the-mid-atlantic-ridge/
___________________________
The Longest Mountain Range on Earth is Underwater

Thingvellir, Iceland.
Among the most awe-inspiring features of our planet's topography is the Mid-Ocean Ridge, an extensive underwater mountain range that spans the globe. This colossal geological formation, stretching approximately 65,000 kilometers (40,390 miles), surpasses any terrestrial mountain range in both length and complexity.
Serving as a critical component of the Earth's lithosphere, the Mid-Ocean Ridge plays a fundamental role in the process of plate tectonics, influencing the creation of new oceanic crust and the distribution of seismic activity.
https://www.worldatlas.com/oceans/the-longest-mountain-range-on-earth-is-underwater.html
___________________________
Decoding the Mid-Atlantic Ridge: Unveiling the True Nature of Earth’s Enigmatic Oceanic Feature
May 7, 2024
The Mid-Atlantic Ridge: A Geological Miracle
The Mid-Atlantic Ridge is a vast undersea mountain range that extends
about 10,000 miles (16,000 kilometers) along the bottom of the Atlantic
Ocean. It is the longest mountain range on Earth and is characterized
by a central rift valley that runs along its entire length. This ridge
is the result of tectonic activity, specifically the divergent movement
of the Eurasian and North American plates.
At the Mid-Atlantic Ridge, magma from the Earth’s mantle rises to the
surface, creating new crust and pushing the existing crust apart. As the
molten rock cools and solidifies, it forms a continuous chain of
underwater mountains. This process is known as seafloor spreading, and
it is the driving force behind the formation and growth of the
Mid-Atlantic Ridge.
___________________________
A New Understanding of the Mid-Atlantic Ridge and Plate Tectonics
Geologists have long thought that mid-ocean ridges are relatively passive participants in plate tectonics. But a new study shows that there might be more activity going on beneath the equatorial Mid-Atlantic Ridge.
The study, published in Nature, suggests that beneath the ridge, upwelling from a thin mantle transition zone (MTZ) might be driving seafloor spreading.
“It was assumed that these gravitational forces, which are pulling down, are contributing to the spreads at the ridges,” said Matthew Agius, lead author of the new study and a researcher at Roma Tre University in Rome. This conventional view explains that gravity pulls subducting plates away from the ridge, a process that is accommodated by passive mantle upwelling at the ridge itself.
https://eos.org/articles/a-new-understanding-of-the-mid-atlantic-ridge-and-plate-tectonics
___________________________
Mid-ocean ridge unfaulting revealed by magmatic intrusions
10 April 2024
Abstract
Mid-ocean ridges (MORs) are quintessential sites of tectonic extension1,2,3,4, at which divergence between lithospheric plates shapes abyssal hills that cover about two-thirds of the Earth’s surface5,6. Here we show that tectonic extension at the ridge axis can be partially undone by tectonic shortening across the ridge flanks. This process is evidenced by recent sequences of reverse-faulting earthquakes about 15 km off-axis at the Mid-Atlantic Ridge and Carlsberg Ridge. Using mechanical models, we show that shallow compression of the ridge flanks up to the brittle failure point is a natural consequence of lithosphere unbending away from the axial relief. Intrusion of magma-filled fractures, which manifests as migrating swarms of extensional seismicity along the ridge axis, can provide the small increment of compressive stress that triggers reverse-faulting earthquakes. Through bathymetric analyses, we further find that reverse reactivation of MOR normal faults is a widely occurring process that can reduce the amplitude of abyssal hills by as much as 50%, shortly after they form at the ridge axis. This ‘unfaulting’ mechanism exerts a first-order influence on the fabric of the global ocean floor and provides a physical explanation for reverse-faulting earthquakes in an extensional environment.
https://www.nature.com/articles/s41586-024-07247-w
___________________________
Deep sea explosive activity on the Mid-Atlantic Ridge near 34°50′N: Magma composition, vesicularity and volatile content
2000
https://www.sciencedirect.com/science/article/abs/pii/S0377027399001900
___________________________
Hydrothermal activity on the southern Mid-Atlantic Ridge: Tectonically- and volcanically-controlled venting at 4–5°S
2008
https://www.sciencedirect.com/science/article/abs/pii/S0012821X08004196
___________________________
Geochemical characteristics of sediments in the southern Mid-Atlantic Ridge indicate hydrothermal activity: Evidence from rare earth elements
2024
https://www.sciencedirect.com/science/article/abs/pii/S0264817224003532
___________________________
Distributions of hydrothermal activity along the Mid-Atlantic Ridge: interplay of magmatic and tectonic controls
1998
https://www.sciencedirect.com/science/article/abs/pii/S0012821X98000934
___________________________
Mid-Atlantic Ridge Volcanic Processes
1998
https://www.whoi.edu/oceanus/feature/mid-atlantic-ridge-volcanic-processes/
___________________________
In Search of Hydrothermal Lost Cities: Searching for Serpentinization-Driven Hydrothermal Activity on Oceanic Core Complexes of the Mid-Atlantic Ridge
May 5, 2023
Scientists discovered three new hydrothermal vent fields during an expedition to the Mid-Atlantic Ridge from March 3 to April 11, 2023, on Schmidt Ocean Institute’s new research vessel Falkor (too).

A high-temperature hydrothermal vent field discovered on Puy des Folles Seamount on the Mid-Atlantic Ridge, at approximately 2,000 meters (6,562 feet) in depth, during the In Search of Hydrothermal Lost Cities expedition. Image courtesy of Schmidt Ocean Institute
https://oceanexplorer.noaa.gov/explorations/23lost-cities/welcome.html
___________________________
Scientists discover hydrothermal vent activity along the Puy de Folles vent field
April 17, 2023
___________________________
Is Iceland Splitting in Half? – How Moving Tectonic Plates Impacts the Country
___________________________
Tectonic Plates in Iceland and Where to Find Them

Iceland is uniquely located on the rift between the North American and Eurasian tectonic plates. As these massive plates separate, they mold the country's ever-changing landscape.
https://guidetoiceland.is/best-of-iceland/tectonic-plates-in-iceland
___________________________
Understanding plate motions
https://pubs.usgs.gov/gip/dynamic/understanding.html
___________________________
Steadying Mid-Ocean Ridge Spreading Rates
4 September 2020
Researchers
used an up-to-date global magnetic anomaly data set to track the
history of magnetic field reversals and obtain more accurate estimates
of tectonic spreading rates.
https://eos.org/research-spotlights/steadying-mid-ocean-ridge-spreading-rates
___________________________
Magnetic Reversals and Moving Continents
https://pwg.gsfc.nasa.gov/earthmag/reversal.htm
___________________________
A
Late Cretaceous-Eocene Geomagnetic Polarity Timescale (MQSD20) That
Steadies Spreading Rates on Multiple Mid-Ocean Ridge Flanks
11 July 2020
https://agupubs.onlinelibrary.wiley.com/doi/full/10.1029/2020JB020034
___________________________
Magnetic and Gravimetric Anomaly Maps of the Arctic
2010
https://ccgm.org/en/home/227-magnetic-and-gravimetric-anomaly-maps-of-the-arctic-pdf-9782917310335.html
___________________________
Mid-Oceanic Ridges
http://www.grandunification.com/hypertext/Mid_Oceanic_Ridges.html
___________________________
Arctic experiences second warmest year since 1900
2020
https://www.upi.com/Science_News/2020/12/08/Arctic-experiences-second-warmest-year-since-1900/6631607455748/
___________________________
The polar cap magnetic activity indices in the southern (PCS) and northern (PCN) polar caps: Consistency and discrepancy
2002
http://www.igpp.ucla.edu/public/rmcpherr/MagneticIndices/PCIndex/PolarCapIndex/Lukiannova2002GL015179.pdf
___________________________
Magnetism
https://simple.wikipedia.org/wiki/Magnetism
___________________________
Ancient Tree With Record of Earth's Magnetic Field Reversal in Its Rings Discovered
7/4/19
https://www.newsweek.com/ancient-tree-discovered-earths-magnetic-field-1447570
___________________________
True Polar Shift? Wandering magnetic pole could point to unsettled Earth core
January 15, 2019
https://www.news.com.au/technology/environment/climate-change/true-polar-shift-wandering-magnetic-pole-could-point-to-unsettled-earth-core/news-story/282db94d50aba6ed1be25df04f383f2f
___________________________
Earth's fast-moving magnetic north pole is messing with navigation
February 4, 2019
An update on true north had to come ahead of schedule.
https://www.engadget.com/2019-02-04-magnetic-north-pole-movement-affects-navigation.html
___________________________
Arctic–Antarctic asymmetry of the ionospheric weather
2022
https://www.sciencedirect.com/science/article/abs/pii/S0273117722003696
___________________________
Asymmetry of the Ionosphere Variability in the North and South Auroral Zones at the Extreme Geomagnetic AE and Apo Indices
16 January 2025
Abstract
Differences in geomagnetic and ionospheric activity are investigated for the maximum monthly–hourly values of the auroral electrojet AE index, measured on a network of magnetometers above 60° in the Northern hemisphere from 1995 to 2019. The selected extreme AE indices were compared with the time–matched 1-h Apo indices observed in the sub-auroral zone from 1995 to the present. A high correlation of 300 selected values of AE and Apo indices (cc = 0.69) was obtained for the period of their synchronous observations in 1995–2019. For a comparison, variations of the ionospheric zonal dispersion (Net Volume, NT) are considered designating the difference between the positive and negative deviations of TEC from the quiet state in the selected zone. The NT is produced from TEC-based W-index values at the grid in the auroral zones of the Northern and Southern hemispheres for the geomagnetic latitudes exceeding ±60°. The NT values were estimated from JPL maps of the total electron content, GIM–TEC, and the corresponding W-index maps converted from geographic to geomagnetic coordinates. We observed an asymmetry of the ionospheric variability in the Northern and Southern auroral zones with the dominance of the positive (negative) NT values in the local winter (summer). At the same time, the seasonal variation of the geomagnetic AE and Apo indices recorded mainly in the Northern Hemisphere shows changes similar to the ionospheric variations of NT in the Southern Hemisphere with a decrease in the amplitude by the winter solstice. The analytical dependences of NT indices on the day of year in the North and South auroral zones were derived suitable for estimating the ionospheric variability in the operational forecasting models of the ionosphere.
https://link.springer.com/article/10.1134/S0016793224700130
___________________________
Decline of geomagnetic and ionospheric activity at earthquake during spotless Sun
2022
https://www.sciencedirect.com/science/article/abs/pii/S0273117722010213
___________________________
Disturbances in the Magnetosphere and Ionosphere during Spotless Sun
20 June 2023
https://link.springer.com/article/10.1134/S0016793222600813
___________________________
Polar express: magnetic north pole speeds towards Russia
2019
Surge affects navigation and is believed to be caused by a ‘jet’ stream in Earth’s liquid outer core
https://www.theguardian.com/world/2019/feb/05/magnetic-north-pole-moving-pretty-fast-towards-russia
___________________________
Lithospheric Magnetic Anomalies of the Eastern Part of the Arctic Ocean as Images of Tectonic Structures
2022
https://link.springer.com/article/10.1134/S0001433821090371
___________________________
Magnetic field in the Arctic regions
2020-10-21
https://geomag.nrcan.gc.ca/mag_fld/arctics-en.php
___________________________
North magnetic pole
https://en.wikipedia.org/wiki/North_magnetic_pole
___________________________
Volcanic activity sparks the Arctic Oscillation
04 August 2021
https://www.nature.com/articles/s41598-021-94935-6
___________________________
James Clark Ross and the Discovery of the Magnetic North Pole
2019
https://www.encyclopedia.com/science/encyclopedias-almanacs-transcripts-and-maps/james-clark-ross-and-discovery-magnetic-north-pole
___________________________
Oceanic
lithosphere magnetization : marine magnetic investigations of crustal
accretion and tectonic processes in mid-ocean ridge environments
2007
https://darchive.mblwhoilibrary.org/handle/1912/2031?show=full
___________________________
Probing the Age of the Oldest Ocean Crust in the Pacific
5 April 2021
A
new study extends the calibration of the Mesozoic Sequence down to the
Mid Jurassic with multiscale marine magnetic anomaly data, demonstrating
extraordinarily high reversal frequency.
https://eos.org/editor-highlights/probing-the-age-of-the-oldest-ocean-crust-in-the-pacific
___________________________
Magnetic Anomalies and Calculating Spreading Rates
2001
https://fog.ccsf.edu/kwiese/content/Classes/MagneticAnomalies.pdf
___________________________
Oceanic plateau formation by seafloor spreading implied by Tamu Massif magnetic anomalies
08 July 2019
https://www.nature.com/articles/s41561-019-0390-y
___________________________
Arctic Ocean bathymetry and its connections to tectonics, oceanography and climate
06 March 2025
https://www.nature.com/articles/s43017-025-00647-0
___________________________
Is it true that Earth's magnetic field occasionally reverses its polarity?
https://www.usgs.gov/faqs/it-true-earths-magnetic-field-occasionally-reverses-its-polarity
___________________________
A global survey of marine magnetic anomalies to constrain the Late Cretaceous- Eocene time scale
Date: September 2015 - August 2019
https://people.climate.columbia.edu/projects/view/32
___________________________
What Is Normal Polarity?
April 05, 2020
https://www.reference.com/science/normal-polarity-5319407db68a91e0
___________________________
Geomagnetic reversal
https://en.wikipedia.org/wiki/Geomagnetic_reversal
A
geomagnetic reversal is a change in a planet's magnetic field such that
the positions of magnetic north and magnetic south are interchanged
(not to be confused with geographic north and geographic south). The
Earth's field has alternated between periods of normal polarity, in
which the predominant direction of the field was the same as the present
direction, and reverse polarity, in which it was the opposite. These
periods are called chrons.
Reversal occurrences are statistically
random. There have been 183 reversals over the last 83 million years
(on average once every ~450,000 years). The latest, the Brunhes–Matuyama
reversal, occurred 780,000 years ago, with widely varying estimates of
how quickly it happened. Other sources estimate that the time that it
takes for a reversal to complete is on average around 7,000 years for
the four most recent reversals. Clement (2004) suggests that this
duration is dependent on latitude, with shorter durations at low
latitudes, and longer durations at mid and high latitudes. Although
variable, the duration of a full reversal is typically between 2,000 and
12,000 years.
Although there have been periods in which the
field reversed globally (such as the Laschamp excursion) for several
hundred years, these events are classified as excursions rather than
full geomagnetic reversals. Stable polarity chrons often show large,
rapid directional excursions, which occur more often than reversals, and
could be seen as failed reversals. During such an excursion, the field
reverses in the liquid outer core, but not in the solid inner core.
Diffusion in the liquid outer core is on timescales of 500 years or
less, while that of the solid inner core is longer, around 3,000 years.
___________________________
Magnetic Polarity of Pillow Basalts from Reykjanes Ridge
1969
https://www.jstor.org/stable/1728072
___________________________
‘Aerosols should mean more warming in the south’–More North. Hemisphere warming is well-understood
Nov 21, 2006
Objection:
Scientists claim that global warming from greenhouse gases is being
countered somewhat by global dimming from aerosol pollution. They even
claim that aerosol pollution caused the cooling in the mid-century. But
GHGs are evenly mixed around the globe, while aerosols are
disproportionately concentrated in the Northern Hemisphere. It follows
that warming should be greater in the Southern Hemisphere -- but that's
the opposite of what is happening. Clearly climate scientists do not
know what is really going on...
https://grist.org/article/aerosols-should-mean-more-warming-in-the-south/
___________________________
Dimethyl sulfide and its role in aerosol formation and growth in the Arctic summer – a modelling study
2019
https://doaj.org/article/ce1b8fd0a05f414e8d58abda02260d03
___________________________
Cryosphere: Earth’s Snow, Ice, and Permafrost
https://www.usgs.gov/programs/ecosystems-land-change-science-program/science/cryosphere-earths-snow-ice-and-permafrost
___________________________
New reports sound the alarm on the cryosphere
19 December 2024
https://wmo.int/media/news/new-reports-sound-alarm-cryosphere
___________________________
'Cryosphere meltdown' will impact Arctic marine carbon cycles and ecosystems, new study warns
April 25, 2025
https://phys.org/news/2025-04-cryosphere-meltdown-impact-arctic-marine.html
___________________________
Earth’s cryosphere is vital for everyone. Here’s how NASA keeps track of its changes.
Apr 20, 2021
https://www.nasa.gov/missions/icebridge/earths-cryosphere-is-vital-for-everyone-heres-how-nasa-keeps-track-of-its-changes/
___________________________
Anomalous radon emanation linked to preseismic electromagnetic phenomena
2007
Abstract
Anomalous emanation of radon (222 Rn) was observed preceding large earthquakes and is considered to be linked to preseismic electromagnetic phenomena (e.g. great changes of atmospheric electric field and ionospheric disturbances). Here we analyze atmospheric radon concentration and estimate changes of electrical conditions in atmosphere due to preseismic radon anomaly. The increase of radon emanation obeys crustal damage evolution, following a powerlaw of time-to-earthquake. Moreover, the radon emanation decreases the atmospheric electric field by 40%, besides influencing the maximum strength of atmospheric electric field by 10 4-10 5 V/m enough to trigger ionospheric disturbances. These changes are within the ranges observed or explaining electromagnetic phenomena associated with large earthquakes.
___________________________
Melting permafrost could expose millions to invisible cancer-causing gas
Inside the race against radon.
May 23, 2022
https://www.inverse.com/science/permafrost-melt-radon-cancer
___________________________
Scientists fear more lung cancer as radon is released from thawing permafrost
4 May 2021
Scientists from the Russian Academy of Sciences hypothesize that as the melting of the permafrost becomes more prevalent, so will the incidence of lung cancer.
___________________________
Abundance and sinking of particulate black carbon in the western Arctic and Subarctic Oceans
15 July 2016
Abstract
The abundance and sinking of particulate black carbon (PBC) were examined for the first time in the western Arctic and Subarctic Oceans. In the central Arctic Ocean, high PBC concentrations with a mean of 0.021 ± 0.016 μmol L−1 were observed in the marginal ice zone (MIZ). A number of parameters, including temperature, salinity and 234Th/238U ratios, indicated that both the rapid release of atmospherically deposited PBC on sea ice and a slow sinking rate were responsible for the comparable PBC concentrations between the MIZ and mid-latitudinal Pacific Ocean (ML). On the Chukchi and Bering Shelves (CBS), PBC concentrations were also comparable to those obtained in the ML. Further, significant deficits of 234Th revealed the rapid sinking of PBC on the CBS. These results implied additional source terms for PBC in addition to atmospheric deposition and fluvial discharge on the western Arctic shelves. Based on 234Th/238U disequilibria, the net sinking rate of PBC out of the surface water was −0.8 ± 2.5 μmol m−3 d−1 (mean ± s.d.) in the MIZ. In contrast, on the shelves, the average sinking rate of PBC was 6.1 ± 4.6 μmol m−3 d−1. Thus, the western Arctic Shelf was probably an effective location for burying PBC.
https://www.nature.com/articles/srep29959
___________________________
The sequestration sink of soot black carbon in the Northern European Shelf sediments
1 March 2012
To
test the hypothesis that ocean margin sediments are a key final
repository in the large‐scale biogeospheric cycling of soot black carbon
(soot‐BC), an extensive survey was conducted along the ∼2,000 km
stretch of the Swedish Continental Shelf (SCS). The soot‐BC content in
the 120 spatially distributed SCS sediments was 0.180.130.26% dw (median
with interquartile ranges), corresponding to ∼5% of total organic
carbon. Using side‐scan sonar constraints to estimate the areal fraction
of postglacial clay sediments that are accumulation bottoms (15% of
SCS), the soot‐BC inventory in the SCS mixed surface sediment was
estimated at ∼4,000 Gg. Combining this with radiochronological
constraints on sediment mass accumulation fluxes, the soot‐BC sink on
the SCS was ∼300 Gg/yr, which yielded an area‐extrapolated estimate for
the Northern European Shelf (NES) of ∼1,100 Gg/yr. This sediment soot‐BC
sink is ∼50 times larger than the river discharge fluxes of soot‐BC to
these coastal waters, however, of similar magnitude as estimates of
atmospheric soot‐BC emission from the upwind European continent. While
large uncertainties remain regarding the large‐scale to global BC cycle,
this study combines with two previous investigations to suggest that
continental shelf sediments are a major final repository of atmospheric
soot‐BC. Future progress on the soot‐BC cycle and how it interacts with
the full carbon cycle is likely to benefit from14C determinations of the
sedimentary soot‐BC and similar extensive studies of coastal sediment
in complementary regimes such as off heavily soot‐BC‐producing areas in S
and E Asia and on the large pan‐Arctic shelf.
___________________________
Organochlorine Pesticides and PAHs in the Surface Water and Atmosphere of the North Atlantic and Arctic Ocean
___________________________
Microplastics in sea ice and seawater beneath ice floes from the Arctic Ocean
19 March 2020
Abstract
Within the past decade, an alarm was raised about microplastics in the remote and seemingly pristine Arctic Ocean. To gain further insight about the issue, microplastic abundance, distribution and composition in sea ice cores (n = 25) and waters underlying ice floes (n = 22) were assessed in the Arctic Central Basin (ACB). Potential microplastics were visually isolated and subsequently analysed using Fourier Transform Infrared (FT-IR) Spectroscopy. Microplastic abundance in surface waters underlying ice floes (0–18 particles m−3) were orders of magnitude lower than microplastic concentrations in sea ice cores (2–17 particles L−1). No consistent pattern was apparent in the vertical distribution of microplastics within sea ice cores. Backward drift trajectories estimated that cores possibly originated from the Siberian shelves, western Arctic and central Arctic. Knowledge about microplastics in environmental compartments of the Arctic Ocean is important in assessing the potential threats posed by microplastics to polar organisms.
https://www.nature.com/articles/s41598-020-61948-6
___________________________
Pollution in the Arctic Ocean
01 October 2021
Abstract
The Arctic Ocean (AO) is, despite its isolated localization in the extreme north, where human activity is restricted, exposed to anthropogenic pollution that has, or threatens to have, impact on the ecology. In this review, we discuss the characteristics of the AO that favors transport of pollutants from lower latitudes to the AO. We point out how important the physical qualities of the pollutants are, which routes they are taking into the AO, if by water currents, air or by rivers, and how they are circulating within the AO and entering the biological food web. It is based on knowledge we have on geography, air and water currents, water masses and the biological communities. Ice and ice cover are given special attention, both as a physical barrier for water/air exchange and how ice cover production affects the concentration of pollutants. By using examples from well-known pollutants (e.g., legacy organochlorine pesticides, currently used pesticides and mercury), we show, from measured field data, how these factors determine the distribution of pollutants and will summarize what can be learned from the analysis of contents in animals (birds, mammals and fish). We present assessments of the biological, chemical and physical effects the pollutants have. The paper finishes with a description of the new threats that are to be expected by new pollution sources related to climate change that opens passages for expanding traffic and exploration in the AO.
https://link.springer.com/chapter/10.1007/978-3-030-75602-4_5
___________________________
Plastic pollution in the Eurasian Arctic – where does it come from and how does it get there?
Feb 03, 2021
Plastic pollution is now found in most places of the planet. Even in areas with little human activity, water masses transport microplastics that become part of the food web and threaten marine ecosystems.
While the Arctic Ocean is no longer considered plastic free, there are large knowledge gaps concerning where the plastic is coming from and how it affects organisms and their habitats.
The Eurasian Arctic is one of the most underreported areas. This is where we went in September 2019, with the R/V Akademik Mstislav Keldysh on its 78th research cruise.Researchers from different institutions in Norway, Russia and the UK worked on board to gather samples of floating plastic debris through the Barents, Kara, Laptev and East-Siberian Seas.
Microplastics are small pieces of plastic that can have very different chemical compositions (polymer types) and morphology (such as fibers, fragments or films). Their shape, size and weight can further help us identify where the plastic particles may come from.
If we could find out more about what drives plastic pollution and distribution of microplastics in the Arctic Ocean, we could contribute to the monitoring and mitigation of this issue. The project was partly funded by the Norwegian Ministry of Climate and Environment project ESCIMO, which aims to “Establish regional capacity to measure and model the distribution and input of microplastics to the Barents Sea from rivers and currents”. Russian ministries and foundation grants helped fund the project for similar reasons.
So how does the plastic end up in the Arctic Ocean in the first place?
The thermohaline circulation, also known as “the great ocean conveyor belt,” transports and mixes the waters of the world’s oceans. In particular, the currents transfer plastic from the North Atlantic to the Arctic and pollute the Barents Sea and the Greenland Sea. The Arctic rivers can also be potential sources. Further, microplastics transported in the Artic sea ice and released when the ice melts, may be another important pathway.
As we know from Asian countries, most of the plastic pollution in the worlds’ oceans come from just a few rivers that wash enormous amounts of waste into the ocean. But as far as we knew, there weren’t any data on transportation of plastic pollution by Siberian rivers into the Arctic Ocean.
By comparing samples from the different areas, we could analyze the distribution of microplastics in connection with oceanographical properties.
During the cruise, we collected a total of 48 samples from the surface water using a Neuston net. We also collected 60 subsurface samples by using a ship-board underway pump-through system with an intake 3 meter below the surface. Installing this underway system was particularly challenging, because the collection of microplastics was accompanied by measurements of oceanographic characteristics, such as temperature, salinity, turbidity, dissolved oxygen and so on.
The samples were taken from the Barents, Kara, Laptev and East-Siberian Seas. But the borders between these seas are not separating the different type of water masses that can transport and circulate microplastics in different ways. When analyzing the samples, we therefore also compared four main water masses: The Atlantic surface water, the Polar surface water and the Great Siberian rivers plumes, which we further divided into the inner and outer plumes.
What we wanted to find out was how much microplastics there were, the type of plastics, the properties of the particles and to identify their potential sources.
When analyzing the samples, we found that all areas and water masses had some amount of microplastics, except the surface samples from the Polar surface water. In general, the concentrations of plastics were relatively low. 12 of 48 surface water samples contained microplastics. In the subsurface samples, 50 of 60 contained plastics. We found on average 0.004 items of microplastics per m3 in the surface samples, and 0.8 items per m3 in the subsurface samples.
When analyzing the distribution of the different types of microplastics, we saw clear differences between the water masses. For example, the subsurface samples from the inner plumes were characterized by the highest abundance of fibers and an absence of fragments. Further, the microplastic characteristics (the abundance of fragments and the ratio of fragments/fibres) were statistically different between in the samples from the Atlantic surface water and in the riverine plumes.
This meant that we could distinguish between microplastics transported to the Arctic Ocean from the North Atlantic, and microplastics discharged from the Ob, Yenisei and Lena rivers. While these water masses have similar plastic concentrations (numbers of items per m3), the weight concentration of the particles was ten times higher for the Atlantic surface water than the river plumes.
By combining our observations of the distribution of microplastics and their different characteristics, we identified two main sources of microplastics to the Eurasian Arctic: Inflow from the North Atlantic and discharges from the Great Siberian Rivers.
In contrast to other places in the world, the role of rivers haven’t been considered that much when analyzing microplastics in the Arctic. Our data showed that the Great Siberian Rivers should be considered when trying to understand the distribution and potential sources of microplastics in the Arctic Ocean. We can also suggest that the properties of microplastics can be used to identify different sources and water masses...
___________________________
Arctic methane deposits 'starting to release', scientists say
27 Oct 2020
Exclusive: expedition says preliminary findings indicate that new source
of greenhouse gas off East Siberian coast has been triggered
https://www.theguardian.com/science/2020/oct/27/sleeping-giant-arctic-methane-deposits-starting-to-release-scientists-find
___________________________
Increasing levels of carbon dioxide in Arctic coastal seas
June 18, 2012
https://www.sciencedaily.com/releases/2012/06/120618153743.htm
___________________________
NEWS: Mysterious Siberian crater attributed to methane
1 Aug 2014
http://arp.arctic.ac.uk/news/2014/aug/1/news-mysterious-siberian-crater-attributed-methane/index.html
___________________________
Expedition to study methane gas bubbling out of the Arctic seafloor
September 21, 2012
https://www.mbari.org/expedition-to-study-methane-gas-bubbling-out-of-the-arctic-seafloor/
___________________________
Evidence for ice-free summers in the late Miocene central Arctic Ocean
2016
https://pubmed.ncbi.nlm.nih.gov/27041737/
___________________________
Mass wasting on Alpha Ridge in the Arctic Ocean: new insights from multibeam bathymetry and sub-bottom profiler data
13 May 2020
https://www.semanticscholar.org/paper/Mass-wasting-on-Alpha-Ridge-in-the-Arctic-Ocean%3A-Boggild-Mosher/bffd3e465b8095166b96231de87d7ce522419f9b
___________________________
Reduced Arctic sea ice extent during the mid-Pliocene Warm Period concurrent with increased Atlantic-climate regime
2020
https://www.sciencedirect.com/science/article/abs/pii/S0012821X20304799
___________________________
Ancient ocean currents may have changed pace and intensity of ice ages
June 26, 2014
https://www.nsf.gov/news/news_summ.jsp?cntn_id=131830
___________________________
A warm and poorly ventilated deep Arctic Mediterranean during the last glacial period
14 Aug 2015
https://www.science.org/doi/10.1126/science.aaa9554
___________________________
Technogenic Radioactivity of Waters in the Central Arctic Basin and Adjacent Water Areas
28 May 2019
Abstract
The contemporary radiation situation in the Arctic Basin and Russian Arctic seas is assessed on the basis of data from 2013 to 2017. Statistically significant differences are revealed in the mean volumetric activity of 137Cs in the surface water layer. The tendency toward a west-to-east decrease in seawater pollution is noted. The maximum 137Cs concentrations are characteristic of the Barents and Kara seas. The least polluted waters are reported in the Laptev and East Siberian seas, which are the most remote from the sources of technogenic radionuclides in Europe.
https://link.springer.com/article/10.1134/S1028334X19030073
___________________________
Sea-ice coverage variability on the Northern Sea Routes, 1980–2011
26 July 2017
Abstract
We analyze sea-ice conditions along seven segments of the Northern Sea Route (NSR) over four time periods. We researched sea ice by segment, using data from the satellite microwave sensors SMMR, SSM/I and AMSR-E. The four analysis periods (periods I–IV: 1980–88, 1989–2001, 2002–06 and 2007–11, respectively) were determined based on changes in the extent of minimum sea ice throughout the Arctic Ocean. Sea ice showed a decreasing tendency from period I to period IV. For example, sea-ice area in period IV decreased compared to previous periods in the eastern East Siberian Sea and around Severnaya Zemlya, areas that had very high sea-ice concentrations in period I. Sea-ice area in the eastern East Siberian Sea decreased sharply during period III, whereas the Severnaya Zemlya area maintained a high ice concentration. In period IV, sea-ice coverage around Severnaya Zemlya was low, although it remained at 25% in the area east of Severnaya Zemlya, which is a key area for navigation. The proportion of multi-year (MY) ice drastically decreased after winter 2002, and only a small amount of MY ice existed in the winters of 2003–06. MY ice disappeared from the eastern East Siberian Sea after 2007. On the other hand, around Severnaya Zemlya the proportion of MY ice showed cyclic ups and downs between 1997 and 2008. Thus, the persistence of various types of sea ice varies according to region. The persistence of various types of sea ice around Severnaya Zemlya also varied each year.
___________________________
The Arctic Ocean as a dead end for floating plastics in the North Atlantic branch of the Thermohaline Circulation
19 Apr 2017
Abstract
https://www.science.org/doi/10.1126/sciadv.1600582
___________________________
Diatom ooze—A large marine mercury sink
26 Jul 2018
Mercury sinking
Abstract
https://www.science.org/doi/10.1126/science.aat2735
___________________________
234Th-derived particulate organic carbon export flux in the western Arctic Ocean
Abstract
To evaluate the particle dynamics and estimate the POC (particulate organic carbon) export flux from the euphotic zone in the western Arctic Ocean, 234Th-238U disequilibrium was applied during the second Chinese National Arctic Research Expedition (July 15–September 26, 2003). The POC export fluxes are estimated from the measured profiles of the 234Th/238U activity ratios and the POC/PTh ratios. The average residence times of the particulate and dissolved 234Th in the euphotic zone are 33 d and 121 d, and their average export fluxes are 480 dpm/m2d and 760 dpm/m2d, respectively. The scavenging and removal processes of particle reactive elements are active in the upper layer of the Chukchi Sea. The average residence time of 234Th increases from shelf to basin, while the export fluxes of 234Th decrease. The estimated POC export fluxes from the euphotic zone vary from 2.1 to 20.3 mmol/m2d, indicating that the western Arctic Ocean is an important carbon sink in summer due to efficient biological pump.
https://link.springer.com/article/10.1007/s00343-010-9933-1?noAccess=true
___________________________
High variability of atmospheric mercury in the summertime boundary layer through the central Arctic Ocean
2014
Abstract
The biogeochemical cycles of mercury in the Arctic springtime have been intensively investigated due to mercury being rapidly removed from the atmosphere. However, the behavior of mercury in the Arctic summertime is still poorly understood. Here we report the characteristics of total gaseous mercury (TGM) concentrations through the central Arctic Ocean from July to September, 2012. The TGM concentrations varied considerably (from 0.15 ng/m3 to 4.58 ng/m3), and displayed a normal distribution with an average of 1.23 ± 0.61 ng/m3. The highest frequency range was 1.0–1.5 ng/m3, lower than previously reported background values in the Northern Hemisphere. Inhomogeneous distributions were observed over the Arctic Ocean due to the effect of sea ice melt and/or runoff. A lower level of TGM was found in July than in September, potentially because ocean emission was outweighed by chemical loss.
Atmospheric mercury is an atmospheric pollutant with two main sources: anthropogenic and natural. Commonly, anthropogenic sources include coal combustion, waste incineration, metal smelting, refining and manufacturing, and gold mining. Natural sources include emissions from oceans, surface soils, water bodies (both fresh and salty water), vegetation surfaces, wild fires, crustal out-gassing, volcanoes, and geothermal sources1,2. Due to its relatively high vapor pressure, low solubility and relatively long atmospheric residence time (about 1 year), mercury can be globally transported3, even to remote areas such as the Arctic4 and Antarctica5. During its long-range transport, gaseous elemental mercury can deposit on surfaces through both wet and dry processes acting on Hg(II) and Hg(p) species1. Once deposited into the environment, inorganic mercury species are likely to convert into highly toxic methyl mercury (MeHg) species, which are then enriched in the aquatic food chain and may pose threats to human health eventually1.
At present, the seasonality of atmospheric mercury based on the long term site observation is obvious in the Arctic. The pattern of variability for atmospheric mercury in the Arctic area presented the spring minimum and summer maximum6,7. During the polar spring, the depletion of Hg0 correlated with the loss of O38. This depletion event was initiated by halogen species originating from sea salt linked to sea ice9 or snow on the sea ice10 after polar sunrise in the Arctic springtime11. The deposited mercury in the Arctic can undergo both reduction and oxidation processes in the snow and some may be re-emitted to the atmosphere12. However, the variable characteristics of atmospheric mercury in the Arctic summer, especially over the Arctic Ocean, are poorly understood. It is known that oceans play an important role in the cycle of global mercury because they can serve as sources or sinks for atmospheric mercury through air-sea exchange13,14. Modeling work showed that the maximum mercury in Arctic summer may be driven by river sources based upon a few site observations15. The Beringia 2005 expedition over the Arctic Ocean in the Northwest passage presented a rapid increase of mercury in air when entering the ice-covered waters4. As the Arctic Ocean has undergone a shift in decreasing sea ice extent in summer, the effect of this shift on the cycle of atmospheric mercury remains unknown.
During the 5th Chinese National Arctic Research Expedition (CHINARE 2012), the Chinese vessel Xuelong passed through the Northeast Passage and the central Arctic Ocean. Moreover, in CHINARE 2010 Xuelong cruised the same track in the Chukchi Sea. This provides opportunity to investigate the spatial and temporal distribution of atmospheric mercury over the Arctic Ocean and to examine the complex interrelations.
https://www.ncbi.nlm.nih.gov/pmc/articles/PMC4133707/
___________________________
Mercury in bottom sediments of marginal seas of northeast Asia
12 August 2014
https://link.springer.com/article/10.1134/S1819714014040046
___________________________
Cracked sea ice stirs up Arctic mercury concern
Jan 15, 2014
Vigorous mixing in the air above large cracks in Arctic sea ice that expose seawater to cold polar air pumps atmospheric mercury down to the surface, finds a NASA field campaign.
Vigorous mixing in the air above large cracks in Arctic sea ice that expose seawater to cold polar air pumps atmospheric mercury down to the surface, finds a NASA field campaign. This process can lead to more of the toxic pollutant entering the food chain, where it can negatively affect the health of fish and animals who eat them, including humans.
Scientists measured increased concentrations of mercury near ground level after sea ice off the coast of Barrow, Alaska, cracked, creating open seawater channels called leads. The researchers were in the Arctic for the NASA-led Bromine, Ozone, and Mercury Experiment (BROMEX) in 2012.
"None of us had suspected that we would find this kind of process associated with leads," said Son Nghiem, a scientist at NASA's Jet Propulsion Laboratory, Pasadena, Calif. Nghiem is the BROMEX principal investigator and a coauthor of a paper reporting the discovery published in Nature on Jan. 15.
The mercury-pumping reaction takes place because open water in a lead is much warmer than the air above it, according to study lead author Chris Moore of the Desert Research Institute, Reno, Nev. Because of that temperature difference, the air above the lead churns like the air above a boiling pot. "The mixing is so strong, it actually pulls down mercury from a higher layer of the atmosphere to near the surface," Moore said. The mixing, marked by dense clouds spewing out of the leads, extends up into the atmosphere about a quarter-mile (400 meters). Moore estimates this may be the height where the mercury pumping occurs.
Almost all of the mercury in the Arctic atmosphere is transported there in gaseous form from sources in areas farther south. Scientists have long known that mercury in the air near ground level undergoes complex chemical reactions that deposit the element on the surface. Once the mercury is completely removed from the air, these reactions stop. However, this newly discovered mixing triggered by leads in the sea ice forces down additional mercury to restart and sustain the reactions.
Leads have become more widespread across the Arctic Ocean as climate change has reduced Arctic sea ice cover. "Over the past decade, we've been seeing more new sea ice rather than perennial ice that has survived for several years. New ice is thinner and saltier and cracks more easily. More new ice means more leads as well," said Nghiem.
To understand the effects of the leads, the team took ground-based measurements of mercury and other chemical species over the frozen Chukchi Sea and over snow-covered land. They used images from the Moderate Resolution Imaging Spectroradiometer (MODIS) instrument on NASA's Terra satellite to observe sea ice and a National Oceanic and Atmospheric Administration model of air transport to gain insight into what was upwind of their mercury measurements.
Co-author Daniel Obrist, also from the Desert Research Institute, said, "The 'aha' moment came when we combined the surface measurements with the satellite data and model. We considered a bunch of chemical processes and sources to explain the increased levels of mercury we observed, until we finally realized it was this pumping process."
Nghiem points out that this new finding has come at a turning point for action on Arctic mercury pollution. The Minamata Convention, a global treaty to curb mercury pollution in which Arctic vulnerability is particularly noted, has been signed by 94 nations since it was opened for signatures in Oct. 2013. Arctic mercury pollution originates almost entirely in nations as far south as the tropics, from sources such as wildfires, coal burning and gold mining. "Once the Minamata Convention has been ratified and becomes international law, we expect this work to help assess its effectiveness," Nghiem said.
https://climate.nasa.gov/news/1028/cracked-sea-ice-stirs-up-arctic-mercury-concern/
___________________________
Increase in anthropogenic mercury in marginal sea sediments of the Northwest Pacific Ocean
2018 Nov 7
Abstract
Over the past century, the addition of anthropogenic mercury (HgANTH) to vast areas of North Pacific marginal seas adjacent to the northeast Asian continent has tripled. Analysis of sediment cores showed that the rate of HgANTH addition (HgANTH flux) was greatest in the East China and Yellow Seas (9.1 μg m-2 yr-1) in the vicinity of China (the source continent), but was small in the Bering and western Arctic Ocean (Chukchi Sea) (0.9 μg m-2 yr-1; the regions furthest from China). Our results show that HgANTH has reached open ocean sedimentary environments over extended areas of the northwestern Pacific Ocean, via the formation of organic-mercury complexes and deposition. The implication of these findings is that the addition of HgANTH (via atmospheric deposition and riverine input) to the ocean environment is responsible for elevated Hg flux into sedimentary environments in the northwest Pacific Ocean.
https://pubmed.ncbi.nlm.nih.gov/30448670/
___________________________
Sea ice leads cause changes in mercury and ozone levels in the Arctic
January 17, 2014
https://oceanbites.org/sea-ice-leads-cause-changes-in-mercury-and-ozone-levels-in-the-arctic/
___________________________
Total and Methylated Mercury in the Beaufort Sea: The Role of Local and Recent Organic Remineralization
October 1, 2012
Abstract
Mercury is a major contaminant in the Arctic marine ecosystem. While
extensive studies have been conducted on mercury in the Arctic’s
atmosphere and biota, far less is known about the distribution and
dynamics of mercury species in the Arctic Ocean. Here, we present
vertical profiles for total mercury (HgT) and total methylated mercury (MeHgT,
sum of monomethylmercury and dimethylmercury) from the Beaufort Sea of
the Arctic Ocean at locations with differing sea ice conditions. The
concentration of HgT ranged from 0.40 to 2.9 pM, with a
surface enrichment that can be attributed to a combination of sea
ice-modified atmospheric deposition and riverine input. The
concentration of MeHgT ranged from <0.04 to 0.59 pM, with a
subsurface peak occurring at the same depth as a nutrient maximum with
lower dissolved oxygen, which is consistent with the recent findings in
the Pacific Ocean, Southern Ocean, and Mediterranean Sea. However,
unlike the interior ocean regions, the nutrient maximum in the Beaufort
Sea is predominantly an advective feature produced over the Chukchi
Shelf. On the basis of the short lifetime of monomethylmercury in
seawater, we propose that the MeHgT profile in the Beaufort
Sea reflects the local, short-term remineralization of labile organic
matter, and not the larger signal of organic remineralization advected
from the Chukchi Sea in the halocline. The finding that MeHgT is produced locally, reflecting recent strength of organic matter cycling, not only explains wide variance in MeHgT in seawater and biota over time and space, but also implies that MeHgT could be used as an indicator of the recent export flux of labile organic matter.
https://pubs.acs.org/doi/10.1021/es302882d
___________________________
Exposure radius of a local coal mine in an Arctic coastal system; correlation between PAHs and mercury as a marker for a local mercury source
2021 Jul
Abstract
Mercury in the Arctic originates from emissions and releases at lower latitudes and, to a lesser extent, from local and regional sources. The relationship between mercury (Hg) and polycyclic aromatic hydrocarbons (PAHs) in sediment can be applied as an indicator of the mercury source. This research examines the Hg contamination gradient from a land-based coal mine to the surrounding coastal environment to quantify the impact of local sources. Total mercury and PAH (Σ14PAH) were measured in terrestrial and marine sediments as well as in marine biota. Samples were collected at the mine and two reference sites. Mercury and Σ14PAH concentrations in samples collected at the mine site were significantly higher than those at the reference sites. This was also found in the biota samples, although less pronounced. This work addresses the complexities of interpreting data concerning very low contaminant levels in a relatively pristine environment. A clear correlation between PAH and Hg concentration in sediment was found, although a large number of samples had levels below detection limits. PAH profiles, hierarchical clustering, and molecular diagnostic ratios provided further insight into the origin of PAHs and Hg, showing that signatures in sediments from the nearest reference site were more similar to the mine, which was not the case for the other reference site. The observed exposure radius from the mine was small and diluted from land to water to marine biota. Due to low contamination levels and variable PAH profiles, marine biota was less suitable for tracing the exposure radius for this local land-based Hg source. With an expected increase in mobility and availability of contaminants in the warming Arctic, changes in input of PAHs and Hg from land-based sources to the marine system need close monitoring.
https://www.ncbi.nlm.nih.gov/pmc/articles/PMC8295130/
___________________________
Arctic sea-ice controls the release of mercury
January 20, 2011
A French-American team, including researchers from CNRS, IRD, the Université Paul Sabatier and the Université de Pau (1), has recently highlighted a new role that sea-ice plays in the mercury cycle in the Arctic. By blocking sunlight, sea-ice could influence the breakdown and transfer into the atmosphere of toxic forms of mercury present in the surface waters of the Arctic Ocean. These results, which suggest that climate plays a key role in the mercury cycle and that the release of mercury into the atmosphere could be accentuated by the melting of Arctic sea-ice, are published in the journal Nature Geoscience (February issue).
Mercury (Hg) is the only heavy metal that is essentially found in gaseous form in the atmosphere. Since the industrial revolution, emissions of anthropogenic Hg resulting from the combustion of fossil fuels have exceeded natural emissions. Both anthropogenic emissions and natural emissions (which mainly stem from the oceans and gases released by volcanoes) reach the Polar Regions under the action of atmospheric currents. In this way, fallout from global atmospheric pollution contributes to depositing mercury in Arctic ecosystems, even though these are far away from major anthropogenic emission sources.
In the Arctic atmosphere, elementary mercury is oxidized into a form that deposits easily in the cryosphere (snow, ice). Then, when the ice melts, this oxidized form can in turn be re-mobilized and transformed, via physicochemical and biological processes, into a toxin: methylmercury (CH3Hg). It is this toxic form that is ingested by living organisms. It accumulates throughout the food chain and can reach concentrations one million times higher than those measured in surface waters at the very top of the chain. Over the last two decades, mercury and methylmercury concentration monitoring programs in different regions of the Arctic have been showing contrasting geographic and temporal trends. What are the reasons for these variations? What processes govern the mercury cycle?
To understand these phenomena better, the researchers focused on murre eggs collected in several Arctic and sub-Arctic locations (Gulf of Alaska, Bering Sea and the Chukchi Sea). Situated at the top of the food chain, these sea birds incorporate the mercury contamination present in the chain and are thus an excellent sentinel species for measuring the impact of this pollutant on marine ecosystems. For instance, the quantity of mercury in their eggs provides an accurate reflection of mercury levels in Arctic ecosystems at a given time. More specifically, the team of scientists measured the isotopic signature (2) of Hg in these eggs and noted that it showed significant geographic variations. The isotopic signature variations of most chemical elements (carbon, nitrogen, etc.) mainly depend on their mass difference (12C, 13C).
Surprisingly, mercury isotopes do not follow the same "rule": its odd isotopes (199Hg, 201Hg) behave differently to its even isotopes (198Hg, 200Hg, etc). This particularity is an extremely rare phenomenon on Earth (3). For mercury, this anomaly is closely related to sea-ice cover around murre colonies' egg laying sites. Knowing the important role played by light in the photodegradation of methylmercury, the researchers succeeded in establishing how much of this toxin could be destroyed by sunlight, whether in the presence or in the absence of sea-ice. In this way, they determined that the presence of sea-ice prevents both the photochemical breakdown of methylmercury and that it limits exchanges of mercury between the Arctic Ocean and the atmosphere.
These results suggest that climate plays a key role in the mercury
cycle. Accelerated melting of sea-ice over the coming decades will
therefore influence the biogeochemical cycle of this pollutant in a
significant manner. Analysis of mercury at the isotopic scale now opens
new research avenues to better understand the dynamics of this priority
pollutant and its impact on the environment.
https://www.sciencedaily.com/releases/2011/01/110119084753.htm
___________________________
Cracked sea ice & Arctic mercury
Jan 22, 2014
VIGOROUS mixing in the air above large cracks in the Arctic Sea ice, which exposes seawater to cold polar air, pumps atmospheric mercury down to the surface, a field campaign by the National Aeronautics and Space Administration (NASA) of the United States has found. This process can lead to more of the toxic pollutant entering the food chain, which can negatively affect the health of fish and the animals who eat them, including humans.
Following the cracking of sea ice off the coast of Barrow, Alaska, which created open seawater channels called leads, scientists found that concentrations of mercury near the ground level had increased. The researchers were in the Arctic for the NASA-led Bromine, Ozone, and Mercury Experiment (BROMEX) in 2012.
___________________________
Integrated ecosystem research in the Pacific Arctic – understanding ecosystem processes, timing and change
2020
https://www.sciencedirect.com/science/article/abs/pii/S0967064520300990
___________________________
High variability of atmospheric mercury in the summertime boundary layer through the central Arctic Ocean
August 2014
Abstract and Figures
___________________________
Influence of carbon and lipid sources on variation of mercury and other trace elements in polar bears (Ursus maritimus)
2005
___________________________
Contaminants in arctic snow collected over northwest Alaskan sea ice
2002
Abstract
https://pubs.er.usgs.gov/publication/70024388
___________________________
Century-old mercury pollution still poisoning Arctic wildlife
Jun 12, 2025
Mercury pollution from coal burning and mining a century ago continues poisoning Arctic wildlife today, with concentrations in polar bears and toothed whales now reaching levels 20 to 30 times higher than before industrialization, according to a study published today in Nature Communications.
Despite global efforts to reduce mercury emissions since the 1970s, researchers found that ocean currents are delivering legacy pollution to the Arctic, where it may persist for centuries. The study offers the first comprehensive explanation for why mercury levels in Arctic animals have failed to decline even as atmospheric emissions have dropped.
Ocean Currents Carry Century-Old Contamination
Researchers from Aarhus University and the University of Copenhagen analyzed more than 700 samples collected across Greenland over four decades, including tissues from polar bears, seals, fish, and peat.
Using mercury isotopes as chemical fingerprints, they traced contamination patterns that align with ocean current flows.
"Transport of mercury from major sources like China to Greenland via ocean currents can take up to 150 years," said Professor Rune Dietz from Aarhus University. While mercury released into the atmosphere circulates for about one year before settling, once it enters the ocean it can persist for over 300 years.
The team found that central West Greenland receives mercury through Atlantic inflow via the Irminger Current, while other regions are influenced by Arctic Ocean currents.
Health Risks Mount for Wildlife and Communities
Mercury acts as a potent neurotoxin that affects immune systems, reproduction, and sensory functions in animals. The contamination poses particular risks to Indigenous communities that rely on marine mammals for food.
"We have not seen any proof of actual kills of top predators, but the loads in toothed whales and polar bears, as well as the Inuit populations in the highest exposed areas, are high enough to show neurological effects," Dietz told BBC Science Focus.
More than one-third of polar bears in the Beaufort Sea region face high risk of health effects from mercury, while over half of hooded seals in the Davis Strait are similarly threatened, according to a 2018 Arctic Council report.
Policy Implications for Global Treaties
The findings carry implications for the UN Minamata Convention on Mercury, which aims to reduce global mercury pollution
. The research suggests that even with continued emission reductions, Arctic ecosystems may not recover for generations due to the long residence time of mercury in oceans.
"We've monitored mercury in Arctic animals for over 40 years. Despite declining global emissions since the 1970s, we see no corresponding decrease in Arctic concentrations—on the contrary," Dietz said
.
https://www.perplexity.ai/page/century-old-mercury-pollution-EzZ3XJh1ROi2Lj3M9Q7RKA
___________________________
Oceanographers Board a Fleet of Icebreakers to Study Mercury Pollution in the Arctic Ocean
The Arctic Ocean lies in one of the most remote regions of the planet, thousands of miles away from industrial cities and mining operations that release anthropogenic mercury to the environment. Global dispersion of mercury pollution is boundless -- even at the top of the world the Arctic is not out of reach and photochemical reactions with snow and ice may even amplify deposition to the basin. This summer, three separate research teams from the United States, Canada, and Germany are traveling to the Arctic Ocean to determine how mercury enters the basin and ultimately, the marine food web.
Mercury is released to the environment through natural processes such as volcanic emissions and weathering, and not-so-natural processes like burning massive quantities of coal to generate electricity or stripping mercury from ore for industry and mining. At room temperature mercury is a liquid, but when heated it becomes a gas that can travel with air masses for up to one year, reaching remote regions like the Arctic Ocean.
The amount of mercury in the ocean has increased since the industrial revolution began in the late 1700s. This is a problem because the ocean is alive with microscopic bacteria that have an uncanny ability to add carbon and hydrogen to mercury creating a toxic compound call methylmercury. Phytoplankton absorb methylmercury from seawater contaminating the base of the food web, methylmercury then biomagnifies up the food chain reaching high concentrations in top predators such as ringed seals and Beluga whales that are important food staples for many Arctic communities.
Humans are exposed to methylmercury through the consumption of seafood and unfortunately, concentrations are high in many Arctic marine mammals. The United States Environmental Protection Agency recommends limiting daily consumption to 0.1 micrograms of methylmercury per kilogram of body mass. Based on this recommendation, one 3 oz serving of Arctic Char, Beluga whale, or ringed seal would deliver two to four times the daily recommended dose of methylmercury to a 150 lb individual. Many women in Alaska, Greenland, northern Canada and Russia have blood mercury levels considered unsafe by both U.S. and Canadian public health guidelines. During pregnancy, methylmercury in the maternal bloodstream is thought to impair the neurological development of unborn children. A recent study in the Canadian Arctic found that children exposed to high levels of methylmercury in utero were 3x more likely to suffer from a learning disability later in life.
In the Arctic, atmospheric deposition of mercury has increased by a factor of three since the industrial revolution but some top predator marine mammals have 10-15 times more mercury than the pre-industrial era -- mercury is accumulating in Arctic marine mammals faster than it is deposited. Where is the excess mercury coming from? One theory is that river discharge delivers large quantities of mercury from Arctic watersheds. The Arctic Ocean is only 1 per cent of global ocean surface area but receives 10 per cent of global river discharge, and a majority of this discharge occurs during a short three month period that could deliver a large annual pulse of mercury to the basin.
This summer the United States, Canada, and Germany will send three
separate icebreakers into the Arctic Ocean to study mercury chemistry in
the basin. This work is part of an international program called GEOTRACES,
an organized effort to study trace metals and elements in the global
ocean. Our goal is to understand how mercury moves through the Arctic
Ocean and why mercury concentrations in the Arctic are increasing at a
faster rate than other parts of the world. We will measure mercury and
methylmercury in hundreds of seawater, snow, melt pond and aerosol
samples. I will be joining the U.S. team which departs on August 9th from Dutch Harbor, Alaska onboard the Healy,
a Coast Guard icebreaker. We will collect samples from the Pacific
Ocean, the Bering Strait, and the Chukchi Sea before attempting to break
through the ice all the way to the North Pole. The German team will
depart from Norway on August 15, and the Canadian expedition is
currently underway.
https://www.huffpost.com/entry/oceanographers-board-a-fl_b_7921510
___________________________
Research vessel provides comprehensive assessment of the changing Central Arctic Ocean
October 11, 2024
https://phys.org/news/2024-10-vessel-comprehensive-central-arctic-ocean.html
___________________________
A mass budget for mercury and methylmercury in the Arctic Ocean
___________________________
The delivery of mercury to the Beaufort Sea of the Arctic Ocean by the Mackenzie River
2006
https://www.sciencedirect.com/science/article/abs/pii/S0048969706008230
___________________________
Subsurface seawater methylmercury maximum explains biotic mercury concentrations in the Canadian Arctic
27 September 2018
Abstract
Mercury (Hg) is a contaminant of major concern in Arctic marine ecosystems. Decades of Hg observations in marine biota from across the Canadian Arctic show generally higher concentrations in the west than in the east. Various hypotheses have attributed this longitudinal biotic Hg gradient to regional differences in atmospheric or terrestrial inputs of inorganic Hg, but it is methylmercury (MeHg) that accumulates and biomagnifies in marine biota. Here, we present high-resolution vertical profiles of total Hg and MeHg in seawater along a transect from the Canada Basin, across the Canadian Arctic Archipelago (CAA) and Baffin Bay, and into the Labrador Sea. Total Hg concentrations are lower in the western Arctic, opposing the biotic Hg distributions. In contrast, MeHg exhibits a distinctive subsurface maximum at shallow depths of 100–300 m, with its peak concentration decreasing eastwards. As this subsurface MeHg maximum lies within the habitat of zooplankton and other lower trophic-level biota, biological uptake of subsurface MeHg and subsequent biomagnification readily explains the biotic Hg concentration gradient. Understanding the risk of MeHg to the Arctic marine ecosystem and Indigenous Peoples will thus require an elucidation of the processes that generate and maintain this subsurface MeHg maximum.
https://www.nature.com/articles/s41598-018-32760-0/
___________________________
Linking mercury exposure to habitat and feeding behaviour in Beaufort Sea beluga whales
2007
https://www.sciencedirect.com/science/article/abs/pii/S0924796307002072
___________________________
Mercury concentrations in Southern Beaufort Sea polar bears: variation based on stable isotopes of carbon and nitrogen
2009
Abstract
Total Hg concentration was measured in hair and whole blood of 52 adult Southern Beaufort Sea polar bears (Ursus maritimus) captured in the spring of 2005. Stable isotopic signatures (i.e., 13C/12C, delta13C; 15N/14N, delta15N) in hair and two blood compartments (packed blood cells/clot and serum) were determined to assess the variation of Hg concentrations among polar bears in relation to their feeding ecology and other biological factors. Concentrations of Hg in hair and blood (2.2-23.9 microg/g dry wt and 0.007-0.213 microg/g wet wt, respectively) were within the range of values previously reported for polar bears in Canada and East Greenland. Mercury concentration in hair from females was higher than that in hair from males, and concentration was related to interactions between delta13C, delta15N, and longitude of capture location. Mercury concentrations in hair were inversely correlated to delta13C in hair and blood, suggesting that polar bears with greater total Hg concentrations fed more on pelagic prey, such as ringed seals or beluga whale, than on benthic prey. Variability in Hg concentrations in polar bear hair and blood may be the result of intraspecific or regional variation in prey selection rather than strictly trophic level interactions.
https://pubmed.ncbi.nlm.nih.gov/19226182/
___________________________
Toxic mercury levels are actually declining in Alaskan polar bears—but that’s not as great as it sounds
Jun 15, 2017
https://www.popsci.com/decreased-mercury-levels-in-alaskan-polar-bears/
___________________________
High mercury levels found in Svalbard birds
April 8, 2025
https://phys.org/news/2025-04-high-mercury-svalbard-birds.html
___________________________
Biogeographic Provinces of Total and Methyl Mercury in Zooplankton and Fish from the Beaufort and Chukchi Seas: Results from the SHEBA Drift
May 20, 2005
Abstract
Samples of copepods (Calanus hyperboreus) and arctic cod (Boreogadus saida) were collected along the SHEBA (Surface HEat Budget of the Arctic) drift track, which commenced in the Canada Basin (October 1997) and finished in the Mendeleev Basin (October 1998). Here, we report total mercury (HgT) and CH3Hg concentrations in these biological samples and examine concentration variability along the drift track in the context of trophic variation, inputs from land, spring mercury depletion events (MDEs), and oceanographic provinces. We find background concentrations of HgT in C. hyperboreus as low as 0.02 μg/g (dw), with the Canada Basin samples exhibiting approximately 2-fold higher mercury concentrations than those from the Chukchi Plateau and Mendeleev Abyssal Plain. This east-to-west trend in mercury concentration is punctuated by two and possibly three intervals of elevated mercury (HgT, 0.10−0.12 μg/g (dw); CH3Hg, 0.023−0.028 μg/g (dw)) along the drift track. One interval of elevated HgT and CH3Hg levels occurred during and shortly after melt. %CH3Hg reached a maximum of 60% during this time period, three times higher than any other time during the drift. This transient rise in C. hyperboreus CH3Hg concentration seems to strongly point to mercury accumulated in snow during MDEs. However, the alignment of elevated mercury samples with oceanographic fronts and the observed regional differences between basins suggest that variation of mercury concentration is primarily a consequence of ocean structure. Given that large animals such as whales selectively forage in regions of higher food concentration such as fronts, recent change in the ice climate of the western Arctic Ocean, perhaps mediated by changes in heat storage, may provide the means to change their exposure to mercury thus explaining observed increases in mercury concentrations in western beluga whales during the 1990s.
https://pubs.acs.org/doi/10.1021/es0482278
___________________________
Arctic Contamination: Mercury In Mackenzie River Delta Dramatically Higher Than Previously Believed
June 18, 2009
University of Alberta researchers conducting a water study in the Mackenzie River Delta have found a dramatically higher delivery of mercury from the Mackenzie River to the Arctic Ocean than determined in previous studies.
Researcher Jennifer Graydon analyzed water in the Mackenzie River as it flowed north into the Beaufort Sea.
She collected samples for three months and discovered the total amount of mercury exported from the river during that three-month period was equal to an entire year's worth of mercury calculated in previous studies.
Graydon's research and previous studies measured export of all chemical forms of mercury in water including methyl mercury.
"Methyl mercury is a neurotoxin and it's primarily passed on to humans through contaminated fish muscle," Graydon said.
"This leaves northern communities vulnerable, because a large part of their diet is Arctic fish species and Beluga whales." Gradyon says existing studies already show Beluga whales in the western Arctic have higher mercury levels in their flesh than Belugas in the eastern Arctic.
The Mackenzie River empties in the Beaufort Sea at the western edge of the Northwest Territories.
Graydon's new estimates were confined to the three months the research team spent on the delta while previous research used data to model mercury export over the course of an entire year.
"Previous annual mercury delivery estimates are premature because of the understudied effects of spring ice-jamming and of 45,000 delta lakes," said Graydon.
"That influence water chemistry as the Mackenzie River passes through the delta."
"There are very few point sources for mercury in the Arctic," said Graydon.
"Mercury is a metal that undergoes long range transport so the Arctic is getting mercury from a global pool." Graydon says the biggest contributor of man-made mercury pollution is coal-fired power production.
This summer U of A researchers will return to the Mackenzie region after it floods to study mercury levels in the thousands of lakes in the delta when flooded by the river. Graydon's Mackenzie River research was published in the journal Science of the Total Environment earlier this year.
https://www.sciencedaily.com/releases/2009/06/090616133934.htm
___________________________
Atmospheric mercury over sea ice during the OASIS-2009 campaign
24 Jul 2013
https://acp.copernicus.org/articles/13/7007/2013/
___________________________
Mercury in the marine environment of the Canadian Arctic: Review of recent findings
___________________________
Mercury and stable isotope cycles in baleen plates are consistent with year-round feeding in two bowhead whale (Balaena mysticetus) populations
28 April 2018
https://link.springer.com/article/10.1007/s00300-018-2329-y
___________________________
A mass budget for mercury and methylmercury in the Arctic Ocean
03 February 2016
https://agupubs.onlinelibrary.wiley.com/doi/10.1002/2015GB005280
___________________________
Canadian mercury science assessment: summary of key results
___________________________
COASTAL AND OFFSHORE PERMAFROST IN A CHANGING ARCTIC
October 13, 2020
Eroding permafrost coasts
Many areas of the Beaufort Sea coast and northern Siberia are experiencing accelerated rates of coastal retreat. The nature of coastal erosion is quite unique in permafrost environments that are dominated by ice-rich sediments.
This video shows an eroding coast occurring on northern Richards Island (Northwest Territories, Canada) with varied geology and permafrost features. Assessments of coastal areas like these require knowledge of the terrestrial environments being eroded (sediment properties, ground ice, and ground temperatures), oceanographic regimes (waves, water temperatures, and sea ice), as well as cliff and beach processes (failure mode, sediment flows, and nearshore sediment dynamics).
https://storymaps.arcgis.com/stories/c163de04de7849cdb917fee88015dd73
___________________________
How we solved an Arctic mercury mystery
October 19, 2018
https://phys.org/news/2018-10-arctic-mercury-mystery.html
___________________________
Beaufort Sea
https://en.wikipedia.org/wiki/Beaufort_Sea
Border Dispute
There is an unresolved dispute involving a wedge-shaped slice on the International Boundary in the Beaufort Sea, between the Canadian territory of Yukon and the U.S. state of Alaska. Canada claims the maritime boundary to be along the 141st meridian west out to a distance of 200 nmi (370 km; 230 mi), following the Alaska–Yukon land border.[15][16] This follows the natural prolongation principle, which holds that a nation's maritime boundary should reflect the 'natural prolongation' of where its land territory reaches the coast. The position of the United States is that the boundary line should be perpendicular to the coast out to a distance of 200 nmi (370 km; 230 mi), following a line of equidistance from the coast.[16][17] The equidistance principle argues that a nation's maritime boundaries should conform to a median line that is equidistant from the shores of neighbouring nations. This difference creates a wedge with an area of about 21,000 km2 (8,100 sq mi) that is claimed by both nations.
Moratorium on commercial fishing
On August 20, 2009 United States Secretary of Commerce Gary Locke announced a moratorium on fishing the Beaufort Sea north of Alaska.[23][24] According to Locke:
"As Arctic sea ice recedes due to climate change, there is increasing interest in commercial fishing in Arctic waters. We are in a position to plan for sustainable fishing that does not damage the overall health of this fragile ecosystem. This plan takes a precautionary approach to any development of commercial fishing in an area where there has been none in the past."
There is no widespread commercial fisheries in those waters now.
Hydrology and climate
The Beaufort Sea is frozen over through the year, except for August and September when the ice breaks near the coast and opens what was once a 50–100 km (31–62 mi) wide strip of open water.[2] During the 2000s, due to climate change in the Arctic, the ice-free area in late summer greatly enlarged. During the record minimum extent of Arctic sea ice in September, 2012, the sea ice boundary had retreated northward much farther than normal from the coast.[29][30][31][32]
The channels of the Mackenzie River thaw earlier, in late May–early June. This thawing increases the average water discharge from about 150,000 to 250,000 m3/s (5,300,000 to 8,800,000 cu ft/s).[28]
Hidden changes in the ice cover of the Beaufort Sea were discovered in 2009. Whereas the ice area remain stable, as detected by the observation satellites, so as the associated water temperature and salinity, the ice structure has changed recently. The new ice, called rotten ice, is thinner and much weaker structurally.[33]
The sea water has a stable temperature and is separated into four distinct layers as follows. The top 100 m (330 ft) are surface water which has a temperature of −1.4 °C (29.5 °F) in summer and −1.8 °C (28.8 °F) in winter. The next layer is formed by the inflows from the Pacific Ocean and Bering Sea coming through the Bering Strait; it extends up to the North Pole. The warmest, deep Atlantic layer has the temperatures between 0 and 1 °C (32 and 34 °F), and water at the bottom is a bit colder at −0.4 to −0.8 °C (31.3 to 30.6 °F).[3] The average salinity varies between 28‰ and 32‰ (parts per thousand) from south to north.[2] Typical air temperatures (at Tuktoyaktuk) are −27 °C (−17 °F) in January and 11 °C (52 °F) in July.[34]
The water currents form the clockwise-directed Beaufort Gyre, that results in south-westerly and westerly currents near the shores.[35] The Mackenzie River partly affects this circulation inducing minor eastwards streams near its mouth. The river annually brings about 15 million tonnes of sediments which are rich in dolomite and calcium carbonate. Those deposits are spread over the sea and mixed with mud and gravel.
___________________________
Alaska Chukchi Sea oil lease offer draws fire
January 3, 2008
https://www.reuters.com/article/environment-alaska-oil-chukchi-1-dc-idUSN0216697120080103
___________________________
Shell abandons Alaska Arctic drilling
28 Sep 2015
Oil giant’s US president says hugely controversial drilling operations off Alaska will stop for ‘foreseeable future’ as drilling finds little oil and gas
___________________________
Dinkum Sands
Dinkum Sands is an uninhabited shoal that frequently breaches the surface of the Beaufort Sea north of Prudhoe Bay, Alaska, between Cross Island and the McClure Islands. Located near the three-mile limit
that defines the border between state and federal control of waters
offshore of the United States, Dinkum Sands became the subject of a U.S. Supreme Court case when the American and Alaskan governments argued over ownership of potentially valuable offshore oil drilling rights. In United States v. Alaska, the court ruled in part that "Dinkum Sands is not an island constituting part of Alaska's coastline under the Submerged Lands Act".
https://en.wikipedia.org/wiki/Dinkum_Sands
___________________________
Selected topics in arctic atmosphere and climate
02 August 2012
https://link.springer.com/article/10.1007/s10584-012-0493-6
___________________________
Radium levels suggest Arctic Ocean chemistry is changing
April 10, 2018
Rising temperatures have already caused changes in the Arctic environment, like diminishing sea ice and thawing permafrost. Now, it appears that sea-ice loss could be throwing Arctic Ocean chemistry out of whack.
In a new study in Science Advances, researchers suggest that, increasingly, materials like nutrients and trace metals are mixing into the Arctic Ocean from continental shelf sediments. This could disrupt the Arctic food web, affecting organisms from tiny phytoplankton up to polar bears, says lead author Lauren Kipp, a chemical oceanographer at Woods Hole Oceanographic Institution in Massachusetts. “Changes are already happening in this region,” Kipp says. “It’s important for us to understand and monitor how [they] are happening, so that we can predict how the Arctic will change in the future.”
In 2015, working aboard the U.S. Coast Guard icebreaker Healy, Kipp and her team sampled Arctic surface waters at 69 sites from the Chukchi Shelf to the North Pole; they also sampled vertical profiles of the water column at 20 sites. The scientists then measured concentrations of radium in each sample. Radium is produced naturally by the decay of thorium isotopes, which occurs in rocks and soils. Unlike thorium, however, radium dissolves in water. “It’s added to the ocean when seawater encounters the coastline or continental shelf sediment,” Kipp says. So “the radium acts as a tracer of shelf inputs to the ocean.”
The researchers found surprisingly elevated radium levels in parts of the Arctic, including near the North Pole where concentrations had doubled compared to measurements taken in a 2007 study, as well as near the Chukchi Shelf. “We expected [radium concentrations] to be the same,” Kipp says, because sources and sinks of nutrients and chemicals in the ocean are typically balanced and consistent over time — remaining stable for up to millennia for certain elements like sodium and chloride. For radium, in particular, the researchers didn’t expect to see an increase over just a decade. The radium levels Kipp and her team found were also 10 times higher than they are in the Atlantic Ocean.
It’s not clear why radium concentrations have doubled, Kipp says, but she and her co-authors suspect that shrinking sea-ice coverage in the Russian Arctic has something to do with it. As ice retreats from the East Siberian Arctic Shelf — the largest continental shelf on Earth — surface waters there are more exposed to wind, which, in turn, can lead to more mixing in the water column over that shelf, she says. Once shelf sediments are mixed into the water, they can travel from Russia, via the Transpolar Drift Current, to the central Arctic, where increased radium levels were detected. “These shelves are really shallow,” Kipp says. “On average, they’re about 50 meters deep, so it doesn’t take much to increase the communication between the sediment and the water column...”
https://www.earthmagazine.org/article/radium-levels-suggest-arctic-ocean-chemistry-changing
___________________________
Direct detection of atmospheric atomic bromine leading to mercury and ozone depletion
June 28, 2019
Significance
Abstract
https://www.pnas.org/doi/10.1073/pnas.1900613116
___________________________
Arctic atmospheric mercury: Sources and changes
2022
https://www.sciencedirect.com/science/article/pii/S0048969722033101
___________________________
Arctic mercury cycling
22 March 2022
https://www.nature.com/articles/s43017-022-00269-w
___________________________
The global problem of mercury in the Arctic
2022
https://science.gc.ca/site/science/en/blogs/science-behind-scenes/global-problem-mercury-arctic
___________________________
Mercury from industrialized nations is polluting the Arctic – here’s how it gets there
December 15, 2017
___________________________
Mercury from outside the Arctic is polluting the region
May 10, 2021
https://arctic-council.org/news/mercury-from-outside-the-arctic-is-polluting-the-region/
___________________________
Mercury in Ringed Seals (Pusa hispida) from the Canadian Arctic in Relation to Time and Climate Parameters
06 October 2020
https://setac.onlinelibrary.wiley.com/doi/10.1002/etc.4865
___________________________
Scientists are tracking the link between pollution, climate change, and rising mercury levels in fish
April 13, 2022
The amount of mercury in the atmosphere has quadrupled since the Industrial Revolution
Eating fish is the most common way people are exposed to mercury — more specifically, methylmercury, a highly toxic organic compound. While low levels of exposure are typically harmless, and fish is a healthy source of protein, its overconsumption can lead to neurological problems, especially for fetuses and young children.
The amount of mercury in the atmosphere has quadrupled since the Industrial Revolution, according to some estimates. The pollution has been largely caused by emissions from coal-fired power plants, but other industries also play a role.
Though mercury levels in water are declining — thanks to decreasing coal use in North America and Europe, and technology that reduces sulfur in smoke stacks — scientists are now discovering that climate change might increase methylmercury levels in fish. That’s because fish are becoming more active with rising ocean temperatures, requiring more food and therefore, ingesting more mercury, according to a 2019 Harvard University study.
Researchers in Delaware and New Jersey are trying to find out where and why mercury levels persist. The research, they say, is part of an effort to manage marine fisheries and inform human health guidelines...
___________________________
Permafrost melt raises threat of ‘giant mercury bomb’ in Arctic: Study
08/15/24
___________________________
Conservative behavior of uranium vs. salinity in Arctic sea ice and brine
2011
Highlights
Introduction
https://www.sciencedirect.com/science/article/abs/pii/S0304420311001332
___________________________
Uranium–thorium disequilibrium in north-east Atlantic waters
2004
https://www.academia.edu/13073804/Uranium_thorium_disequilibrium_in_north_east_Atlantic_waters
___________________________
List of countries by uranium reserves
https://en.wikipedia.org/wiki/List_of_countries_by_uranium_reserves
___________________________
Record Low Bering Sea Ice Causes ‘Natural Disaster’ for Alaskan Communities
May 07, 2018
As April drew to a close, scientists confirmed that sea ice in the Bering Sea, the body of water between Alaska and Russia, was at 10 percent of normal levels, The Washington Post reported Thursday.
https://www.ecowatch.com/bering-sea-ice-2566745144.html
___________________________
Biological and paleoceanographic controls on the postglacial sulfur isotope records in Arctic shelf sediments
https://www.sciencedirect.com/science/article/abs/pii/S0031018224002293
___________________________
Late Glacial to Holocene volcanism of Jom-Bolok Valley (East Sayan Mountains, Siberia) recorded by microtephra layers of the Lake Kaskadnoe-1 sediments
2019
https://www.sciencedirect.com/science/article/abs/pii/S136791201930029X
___________________________
Trove Of Toxic Mercury Lurks In Arctic Sea Ice
May 12, 2014
https://cen.acs.org/articles/92/web/2014/05/Trove-Toxic-Mercury-Lurks-Arctic.html
___________________________
Sea expedition helps unravel why mercury levels are so high in the Arctic
May 15, 2025
https://phys.org/news/2025-05-sea-unravel-mercury-high-arctic.html
___________________________
Melt generation beneath Arctic Ridges: Implications from U decay series disequilibria in the Mohns, Knipovich, and Gakkel Ridges
2013
https://www.sciencedirect.com/science/article/abs/pii/S0016703713006704
___________________________
Americium 241
Environmental Presence
Americium-241 is the most important radioisotope of americium from the point of view of the occurrence in environment. The other long-lived isotope 243Am is produced in nuclear reactors in smaller activity compared to 241Am. The activity of 242mAm (half-life 160 years) that originated in nuclear weapons tests was nearly six orders of magnitude lower in comparison with 241Pu activity from which 241Am in-grows. Americium-241 is produced in nuclear power plants during activation of 239Pu and 240Pu by neutrons, which is followed by beta decay of 241Pu (T1/2 = 14.35 years). This means that also in burned-up fuel 241Am is produced by decay of 241Pu a long time after the fuel is removed from a nuclear reactor. Maximum of in-grown activity of 241Am from 241Pu arises after 70 years. Americium-243 is produced from short-lived 243Pu arising from bombardment of 239Pu and 238U by neutrons, so it is not produced after shutdown of a nuclear reactor.
Americium-241 is detectable in very small activities over the whole Northern Hemisphere as the result of nuclear weapons tests in the atmosphere in the 1950s and beginning of the 1960s. Very sensitive methods, including radiochemical separation from large samples, are necessary for detection of 241Am in soil, which may be present in concentrations of 20–40 Bq m−2. Airborne releases and effluents to the hydrosphere from nuclear power plants also contain very small activities of transuranic elements, including americium-241, but even very sensitive detection methods can detect it directly in releases only (at tenths of kBq to a few kBq per year), not in the environment. Existing americium contamination is concentrated in the areas used for the atmospheric nuclear weapons tests conducted between 1945 and 1980, as well as at the sites of nuclear incidents, such as the Chernobyl disaster in 1986. For example, the analysis of the debris at the testing site of the first US hydrogen bomb in Enewetak Atoll revealed high concentrations of various actinoids including americium. The glassy residue left on the desert floor where atomic bombs were tested in Alamogordo, New Mexico, Kazakhstan, and the Maralinga desert in Australia contain traces of 241Am. Elevated levels of americium were also detected at the crash site of a US B-52 bomber, which carried four hydrogen bombs, in 1968 in Thule, Greenland and at the location of a similar incident in Palomares, Spain. Other potential sources of 241Am are two sunken nuclear submarines in the Barents Sea: ‘Komsomolets’ with a reactor and two nuclear torpedoes and ‘Kursk’ with a reactor and probably with nuclear weapons as well. Also 17 reactors dumped in the Kara Sea are potential sources of transuranic elements, including 241Am. Places in which nuclear weapon industries were located both in the United States and in Russia have increased content of 241Am in soil and, therefore, also in airborne aerosols from resuspension. Examples of such locations are Hanford and Rocky Flats in the United States, and Chelyabinsk and Kyshtym in Russia.
During monitoring of the environment around Chernobyl after the 1986 nuclear reactor failure, the most attention was paid to 239Pu. As the total activity of 239Pu and 241Pu released from the Chernobyl power plant are known, and the fate of both plutonium isotopes in the environment is the same, it can be assumed that the ratio of their respective activities at the time of deposition was the same as in total release. In-growth of 241Am from 241Pu can be calculated from the activity of 241Pu. In the 30-km diameter zone around Chernobyl for which an estimated deposition of 239,240Pu was higher than 3.7 kBq m−2, the in-growth of 241Am 30 years after the accident is about 40 kBq m−2.
https://www.sciencedirect.com/topics/earth-and-planetary-sciences/americium-241
___________________________
Tracing groundwater discharge in a High Arctic lake using radon-222
16 September 2011
https://link.springer.com/article/10.1007/s12665-011-1348-6
___________________________
Analyzing alpha emitting isotopes of Pu, Am and Cm from NPP water samples: an intercomparison of Nordic radiochemical laboratories
28 July 2021
https://link.springer.com/article/10.1007/s10967-021-07913-7
___________________________
Assessing the natural and anthropogenic radionuclide activities of the Pechora River estuary: Bottom sediments and water (Arctic Ocean Basin)
2021 Aug 4
https://pubmed.ncbi.nlm.nih.gov/34364142/
___________________________
Species identification and decay assessment of Late Pleistocene fragmentary vertebrate remains from Pin Hole Cave (Creswell Crags, UK) using collagen fingerprinting
13 January 2017
https://onlinelibrary.wiley.com/doi/10.1111/bor.12225
___________________________
GEOLOGIC FRAMEWORK AND TECTONIC EVOLUTION
National
Academies of Sciences, Engineering, and Medicine. 1991. Opportunities
and Priorities in Arctic Geoscience. Washington, DC: The National
Academies Press. https://doi.org/10.17226/1842.
https://nap.nationalacademies.org/read/1842/chapter/7
___________________________
Why Ships AVOID the Arctic Route Above Russia
Dec 5, 2025
https://www.youtube.com/watch?v=MHAdwCqjDmg
___________________________
Heat flow in the Arctic
https://www.usgs.gov/publications/heat-flow-arctic
___________________________
The effect of changing sea ice on wave climate trends along Alaska's central Beaufort Sea coast
2022
https://tc.copernicus.org/articles/16/1609/2022/
___________________________
Arctic warming interrupts the Transpolar Drift and affects long-range transport of sea ice and ice-rafted matter
02 April 2019
Abstract
Sea ice is an important transport vehicle for gaseous, dissolved and particulate matter in the Arctic Ocean. Due to the recently observed acceleration in sea ice drift, it has been assumed that more matter is advected by the Transpolar Drift from shallow shelf waters to the central Arctic Ocean and beyond. However, this study provides first evidence that intensified melt in the marginal zones of the Arctic Ocean interrupts the transarctic conveyor belt and has led to a reduction of the survival rates of sea ice exported from the shallow Siberian shelves (−15% per decade). As a consequence, less and less ice formed in shallow water areas (<30 m) has reached Fram Strait (−17% per decade), and more ice and ice-rafted material is released in the northern Laptev Sea and central Arctic Ocean. Decreasing survival rates of first-year ice are visible all along the Russian shelves, but significant only in the Kara Sea, East Siberian Sea and western Laptev Sea. Identified changes affect biogeochemical fluxes and ecological processes in the central Arctic: A reduced long-range transport of sea ice alters transport and redistribution of climate relevant gases, and increases accumulation of sediments and contaminates in the central Arctic Ocean, with consequences for primary production, and the biodiversity of the Arctic Ocean.
https://www.nature.com/articles/s41598-019-41456-y/
___________________________
The Transpolar Drift as a Source of Riverine and Shelf-Derived Trace Elements to the Central Arctic Ocean
08 April 2020
Abstract
A major surface circulation feature of the Arctic Ocean is the Transpolar Drift (TPD), a current that transports river-influenced shelf water from the Laptev and East Siberian Seas toward the center of the basin and Fram Strait. In 2015, the international GEOTRACES program included a high-resolution pan-Arctic survey of carbon, nutrients, and a suite of trace elements and isotopes (TEIs). The cruises bisected the TPD at two locations in the central basin, which were defined by maxima in meteoric water and dissolved organic carbon concentrations that spanned 600 km horizontally and ~25–50 m vertically. Dissolved TEIs such as Fe, Co, Ni, Cu, Hg, Nd, and Th, which are generally particle-reactive but can be complexed by organic matter, were observed at concentrations much higher than expected for the open ocean setting. Other trace element concentrations such as Al, V, Ga, and Pb were lower than expected due to scavenging over the productive East Siberian and Laptev shelf seas. Using a combination of radionuclide tracers and ice drift modeling, the transport rate for the core of the TPD was estimated at 0.9 ± 0.4 Sv (106 m3 s−1). This rate was used to derive the mass flux for TEIs that were enriched in the TPD, revealing the importance of lateral transport in supplying materials beneath the ice to the central Arctic Ocean and potentially to the North Atlantic Ocean via Fram Strait. Continued intensification of the Arctic hydrologic cycle and permafrost degradation will likely lead to an increase in the flux of TEIs into the Arctic Ocean.
https://agupubs.onlinelibrary.wiley.com/doi/full/10.1029/2019JC015920
___________________________
Marine seabed litter in Siberian Arctic: A first attempt to assess
2021
https://www.sciencedirect.com/science/article/abs/pii/S0025326X21008705
___________________________
Powerful methane fountains seen bubbling to surface of Siberian sea
October 08, 2019
https://newatlas.com/environment/powerful-methane-fountains-siberian-sea/
___________________________
Isotope tracing of Siberian river water in the Arctic Ocean
1994
https://www.sciencedirect.com/science/article/abs/pii/0265931X94900078
___________________________
Radon concentration in groundwater sources of the Baikal region (East Siberia, Russia)
2019
https://www.sciencedirect.com/science/article/abs/pii/S0883292719302513
___________________________
Distribution and sources of rare earth elements in sediments of the Chukchi and East Siberian Seas
2019
https://www.sciencedirect.com/science/article/pii/S1873965218301725
___________________________
Strontium,
neodymium, and lead isotope variations of authigenic and silicate
sediment components from the Late Cenozoic Arctic Ocean: Implications
for sediment provenance and the source of trace metals in seawater
October 1997
https://ui.adsabs.harvard.edu/abs/1997GeCoA..61.4181W/abstract
___________________________
Trace
metals in surface sediments from the Laptev and East Siberian Seas:
Levels, enrichment, contamination assessment, and sources
2021
https://www.sciencedirect.com/science/article/abs/pii/S0025326X21010316
___________________________
The effect of estuarine system on the meiofauna and nematodes in the East Siberian Sea
29 September 2021
https://www.nature.com/articles/s41598-021-98641-1
___________________________
Acidification of East Siberian Arctic Shelf waters through addition of freshwater and terrestrial carbon
18 April 2016
Abstract
Ocean acidification affects marine ecosystems and carbon cycling, and is considered a direct effect of anthropogenic carbon dioxide uptake from the atmosphere1,2,3. Accumulation of atmospheric CO2 in ocean surface waters is predicted to make the ocean twice as acidic by the end of this century4. The Arctic Ocean is particularly sensitive to ocean acidification because more CO2 can dissolve in cold water5,6. Here we present observations of the chemical and physical characteristics of East Siberian Arctic Shelf waters from 1999, 2000–2005, 2008 and 2011, and find extreme aragonite undersaturation that reflects acidity levels in excess of those projected in this region for 2100. Dissolved inorganic carbon isotopic data and Markov chain Monte Carlo simulations of water sources using salinity and δ18O data suggest that the persistent acidification is driven by the degradation of terrestrial organic matter and discharge of Arctic river water with elevated CO2 concentrations, rather than by uptake of atmospheric CO2. We suggest that East Siberian Arctic Shelf waters may become more acidic if thawing permafrost leads to enhanced terrestrial organic carbon inputs and if freshwater additions continue to increase, which may affect their efficiency as a source of CO2.
https://www.nature.com/articles/ngeo2695
___________________________
Distribution Patterns of Heavy Minerals in Siberian
Rivers, the Laptev Sea and the Eastern Arctic Ocean: An Approach to
Identify Sources, Transport and Pathways of Terrigenous Matter
1999
https://link.springer.com/chapter/10.1007/978-3-642-60134-7_24
___________________________
Trace metals in surface sediments from the Laptev and East Siberian Seas: Levels, enrichment, contamination assessment, and sources
September 2021
https://www.researchgate.net/publication/354950836_Trace_metals_in_surface_sediments_from_the_Laptev_and_East_Siberian_Seas_Levels_enrichment_contamination_assessment_and_sources
___________________________
Determination
of Depositional Beryllium-10 Fluxes in the Area of the Laptev Sea and
Beryllium-10 Concentrations in Water Samples of High Northern Latitudes
1999
https://link.springer.com/chapter/10.1007/978-3-642-60134-7_40
___________________________
Dissolved and Particulate Major and Trace Elements in Newly Formed Ice from the Laptev Sea (Transdrift III, October 1995)
https://link.springer.com/chapter/10.1007/978-3-642-60134-7_11
___________________________
Major, trace, and rare-earth elements in the zooplankton of the Laptev Sea in relation to community composition
10 June 2019
https://link.springer.com/article/10.1007/s11356-019-05538-8
___________________________
Geochemistry of Surficial and Ice-rafted Sediments from the Laptev Sea (Siberia)
July 1999
https://ui.adsabs.harvard.edu/abs/1999ECSS...49...45H/abstract
___________________________
Methane-Derived Authigenic Carbonates on the Seafloor of the Laptev Sea Shelf
28 July 2021
https://www.frontiersin.org/articles/10.3389/fmars.2021.690304/full
___________________________
The Laptev Sea as a source for recent Arctic Ocean salinity change
May 2001
https://www.researchgate.net/publication/228603776_The_Laptev_Sea_as_a_source_for_recent_Arctic_Ocean_salinity_change
___________________________
Transport
and transformation of riverine neodymium isotope and rare earth element
signatures in high latitude estuaries: A case study from the Laptev Sea
November 2017
https://www.researchgate.net/publication/319441315_Transport_and_transformation_of_riverine_neodymium_isotope_and_rare_earth_element_signatures_in_high_latitude_estuaries_A_case_study_from_the_Laptev_Sea
___________________________
Possible Causes of Radioactive Contamination in the Laptev Sea
1999
https://link.springer.com/chapter/10.1007/978-3-642-60134-7_8
___________________________
Major, trace, and rare-earth elements in the zooplankton of the Laptev Sea in relation to community composition
2019 Jun 10
https://pubmed.ncbi.nlm.nih.gov/31179508/
___________________________
Dissolved Oxygen, Silicon, Phosphorous and Suspended Matter Concentrations During the Spring Breakup of the Lena River
1999
https://link.springer.com/chapter/10.1007/978-3-642-60134-7_23
___________________________
Carbon mineralization in Laptev and East Siberian sea shelf and slope sediment
2017
https://bg.copernicus.org/articles/15/471/2018/bg-15-471-2018.pdf
___________________________
Sea 'Boiling' with Methane Discovered in Siberia: 'No One Has Ever Recorded Anything like This Before'
10/8/19
https://www.newsweek.com/methane-boiling-sea-discovered-siberia-1463766
___________________________
The Laptev Sea as a source for recent Arctic Ocean salinity change
May 2001
https://www.researchgate.net/publication/228603776_The_Laptev_Sea_as_a_source_for_recent_Arctic_Ocean_salinity_change
___________________________
A Massive Methane Reservoir Is Lurking Beneath the Sea
27 April 2021
Scientists
have found a methane reservoir below the permafrost seabed of the
Laptev Sea—a reservoir that could suddenly release large amounts of the
potent greenhouse gas.
https://eos.org/articles/a-massive-methane-reservoir-is-lurking-beneath-the-sea
___________________________
228Ra and 226Ra in the Kara and Laptev seas
2003
https://www.sciencedirect.com/science/article/abs/pii/S0278434302001693
___________________________
The Spatial Distribution of Plankton Picocyanobacteria on the Shelf of the Kara, Laptev, and East Siberian Seas
26 February 2020
https://link.springer.com/article/10.3103/S0096392519040011
___________________________
Contaminant fluxes in sediment-laden sea ice from the Kara Sea
2000
https://citeseerx.ist.psu.edu/viewdoc/download?doi=10.1.1.548.3160&rep=rep1&type=pdf
___________________________
Potential for rapid transport of contaminants from the Kara Sea
1997
https://www.sciencedirect.com/science/article/pii/S0048969797001083
___________________________
Radioactive
contamination from dumped nuclear waste in the Kara Sea--results from
the joint Russian-Norwegian expeditions in 1992-1994.
1997
https://europepmc.org/article/MED/9241886
___________________________
The 17 000 Nuclear Objects Dumped in the Kara Sea
Sept. 2, 2021
https://law-in-action.com/2021/09/14/the-17-000-nuclear-objects-dumped-in-the-kara-sea/
___________________________
Trace contaminant concentrations in the Kara Sea and its adjacent rivers, Russia
2001
https://pubmed.ncbi.nlm.nih.gov/11763212/
___________________________
The role of river runoff in the Kara Sea surface layer acidification and carbonate system changes
October 2019
https://iopscience.iop.org/article/10.1088/1748-9326/ab421e
___________________________
Possible Criticality of Marine Reactiors Dumped in the Kara Sea
May 1997
https://digital.library.unt.edu/ark:/67531/metadc696292/m2/1/high_res_d/610741.pdf
___________________________
The role of sea ice in the fate of contaminants in the Arctic Ocean: plutonium atom ratios in the Fram Strait
2003
https://pubmed.ncbi.nlm.nih.gov/14620809/
___________________________
Radioactive
contamination from dumped nuclear waste in the Kara Sea--results from
the joint Russian-Norwegian expeditions in 1992-1994
1997
https://pubmed.ncbi.nlm.nih.gov/9241886/
___________________________
Melting glaciers at Novaya Zemlya contain radiation from nuclear bomb tests
October 09, 2018
https://thebarentsobserver.com/en/ecology/2018/10/melting-glaciers-novaya-zemlya-contain-radiation-nuclear-bomb-tests
___________________________
Plutonium in fish, algae, and sediments in the Barents, Petshora and Kara Seas
1997
https://www.sciencedirect.com/science/article/abs/pii/S004896979700106X
___________________________
Survey of artificial radionuclides in the Kara Sea
2012
http://www.diva-portal.org/smash/record.jsf?pid=diva2%3A569683&dswid=4477
___________________________
Trace Contaminant Concentrations in the Kara Sea and its Adjacent Rivers, Russia
2001
https://www.sciencedirect.com/science/article/abs/pii/S0025326X00002368
___________________________
RADIOLOGICAL CONDITIONS OF THE WESTERN KARA SEA
1998
https://www-pub.iaea.org/MTCD/Publications/PDF/Pub1068_web.pdf
___________________________
Potential for rapid transport of contaminants from the Kara Sea
1997
https://www.sciencedirect.com/science/article/pii/S0048969797001083
___________________________
Russia Announces... Enormous Finds of Radioactive Waste... And Nuclear Reactors in Arctic Seas
28 August 2012
https://www.bibliotecapleyades.net/ciencia/ciencia_uranium76.htm
___________________________
Trace contaminant concentrations in the Kara Sea and its adjacent rivers, Russia
2001
https://pubmed.ncbi.nlm.nih.gov/11763212/
___________________________
Organochlorine
Pesticides and Polychlorinated Biphenyls in the Subcutaneous Adipose
Tissue of Beluga Whales (Delphinapterus leucas) of the White, Kara and
Bering Seas
12 April 2021
https://link.springer.com/article/10.1134/S0001437021010100
___________________________
Environment and biology of the Kara Sea: a general view for contamination studies
2001
https://pubmed.ncbi.nlm.nih.gov/11601532/
___________________________
Radiological
Conditions of the Western Kara Sea: Assessment of the Radiological
Impact of the Dumping of Radioactive Waste in the Arctic Seas
1999
https://www.osti.gov/biblio/15001861
___________________________
Pollution of the Kara Sea
01 January 2017
https://link.springer.com/referenceworkentry/10.1007/978-3-319-25582-8_160048
___________________________
Microplastics quantification in surface waters of the Barents, Kara and White Seas
2020
https://www.sciencedirect.com/science/article/abs/pii/S0025326X20308638
___________________________
Leaking nuclear icebreaker escorted out of ice covered Kara Sea
May 06, 2011
https://barentsobserver.com/en/articles/leaking-nuclear-icebreaker-escorted-out-ice-covered-kara-sea
___________________________
The biogeochemistry of some heavy metals and metalloids in the Ob River estuary-Kara Sea section
October 2010
https://ui.adsabs.harvard.edu/abs/2010Ocgy...50..729D/abstract
___________________________
The Biogeochemistry of Some Heavy Metals and Metalloids in the Ob River Estuary–Kara Sea Section
2010
https://web.whoi.edu/sas2019/wp-content/uploads/sites/130/2019/05/Demina2010_Article_TheBiogeochemistryOfSomeHeavyM.pdf
___________________________
River Outflow to the Kara Sea
2012
https://earthobservatory.nasa.gov/images/78829/river-outflow-to-the-kara-sea
___________________________
Water
mass transformation in the Barents Sea inferred from radiogenic
neodymium isotopes, rare earth elements and stable oxygen isotopes
2018
https://www.sciencedirect.com/science/article/abs/pii/S0009254118304972
___________________________
Industrial Pollution in Russia’s Barents Sea Areas
March 10, 2015
https://bellona.org/publication/industrial-pollution-russias-barents-sea-areas
___________________________
Methanogenic community composition and anaerobic carbon turnover in submarine permafrost sediments of the Siberian Laptev Sea
02 March 2009
Summary
The Siberian Laptev Sea shelf contains submarine permafrost, which was formed by flooding of terrestrial permafrost with ocean water during the Holocene sea level rise. This flooding resulted in a warming of the permafrost to temperatures close below 0°C. The impact of these environmental changes on methanogenic communities and carbon dynamics in the permafrost was studied in a submarine permafrost core of the Siberian Laptev Sea shelf. Total organic carbon (TOC) content varied between 0.03% and 8.7% with highest values between 53 and 62 m depth below sea floor. In the same depth, maximum methane concentrations (284 nmol CH4 g−1) and lowest carbon isotope values of methane (−72.2‰ VPDB) were measured, latter indicating microbial formation of methane under in situ conditions. The archaeal community structure was assessed by a nested polymerase chain reaction (PCR) amplification for DGGE, followed by sequencing of reamplified bands. Submarine permafrost samples showed a different archaeal community than the nearby terrestrial permafrost. Samples with high methane concentrations were dominated by sequences affiliated rather to the methylotrophic genera Methanosarcina and Methanococcoides as well as to uncultured archaea. The presented results give the first insights into the archaeal community in submarine permafrost and the first evidence for their activity at in situ conditions.
https://sfamjournals.onlinelibrary.wiley.com/doi/10.1111/j.1462-2920.2008.01836.x
___________________________
Holocene accumulation of organic carbon at the Laptev Sea continental margin (Arctic Ocean): sources, pathways, and sinks
July 2000
Abstract
Composition and accumulation rates of organic carbon in Holocene sediments provided data to calculate an organic carbon budget for the Laptev Sea continental margin. Mean Holocene accumulation rates in the inner Laptev Sea vary between 0.14 and 2.7 g C cm−2 ky−1; maximum values occur close to the Lena River delta. Seawards, the mean accumulation rates decrease from 0.43 to 0.02 g C cm−2 ky−1. The organic matter is predominantly of terrigenous origin. About 0.9 × 10⁶ t year−1 of organic carbon are buried in the Laptev Sea, and 0.25 × 10⁶ t year−1 on the continental slope. Between about 8.5 and 9 ka, major changes in supply of terrigenous and marine organic carbon occur, related to changes in coastal erosion, Siberian river discharge, and/or Atlantic water inflow along the Eurasian continental margin.
https://link.springer.com/article/10.1007/s003670000028
___________________________
Composition and distribution of the pelagic and sympagic algal assemblages in the Laptev Sea during autumnal freeze-up
01 May 2000
https://academic.oup.com/plankt/article/22/5/843/1475623?login=false
___________________________
Russian Researchers Find Widespread Methane Seeps Across Laptev Sea
Oct 28, 2020
https://maritime-executive.com/article/russian-researchers-find-widespread-methane-seeps-across-laptev-sea
___________________________
Arctic sea ice nursery in the Laptev Sea has not frozen. Buttigieg: "There's no do-over on climate."

Melting sea ice drifts in the Bering Sea off the coast of Russia in 2016
https://www.dailykos.com/stories/2020/10/23/1985441/-Arctic-sea-ice-nursery-in-the-Laptev-sea-has-not-frozen-breaking-records-for-the-latest-formation
___________________________
SECOND STATE OF THE CARBON CYCLE REPORT
CHAPTER 11: ARCTIC AND BOREAL CARBON
https://carbon2018.globalchange.gov/chapter/11/
___________________________
Nitrogen dynamic in Eurasian coastal Arctic ecosystem: Insight from nitrogen isotope
24 April 2017
Abstract
Primary productivity is limited by the availability of nitrogen (N) in most of the coastal Arctic, as a large portion of N is released by the spring freshet and completely consumed during the following summer. Thus, understanding the fate of riverine nitrogen is critical to identify the link between dissolved nitrogen dynamic and coastal primary productivity to foresee upcoming changes in the Arctic seas, such as increase riverine discharge and permafrost thaw. Here we provide a field-based study of nitrogen dynamic over the Laptev Sea shelf based on isotope geochemistry. We demonstrate that while most of the nitrate found under the surface freshwater layer is of remineralized origin, some of the nitrate originates from atmospheric input and was probably transported at depth by the mixing of brine-enriched denser water during sea ice formation. Moreover, our results suggest that riverine dissolved organic nitrogen (DON) represents up to 6 times the total riverine release of nitrate and that about 62 to 76% of the DON is removed within the shelf waters. This is a crucial information regarding the near-future impact of climate change on primary productivity in the Eurasian coastal Arctic.
Key Points
- Sixty two to 76% of the riverine dissolved organic nitrogen is removed over the Laptev Sea shelf
- The variation in DON isotopic signature suggests the presence of removal processes inducing isotopic fractionation (e.g., assimilation)
- We highlighted the presence of atmospheric nitrate at depth, probably transported during winter mixing and/or brine formation
Plain Language Summary
Climate change will enhance the release of organic nitrogen to the Arctic via increased river runoff and permafrost thawing. Here we show that more than half of this nitrogen can be used directly, or after recycling, by marine organisms and thus should be taken into consideration when investigating the global primary productivity of the Arctic coastal ecosystem.
https://agupubs.onlinelibrary.wiley.com/doi/full/10.1002/2016GB005593
___________________________
Nutrient pathways and their susceptibility to past and future change in the Eurasian Arctic Ocean
16 December 2021
https://link.springer.com/article/10.1007/s13280-021-01673-0
___________________________
Pan-Arctic concentrations of mercury and stable isotope ratios of carbon (δ13C) and nitrogen (δ15N) in marine zooplankton
2016
https://www.sciencedirect.com/science/article/abs/pii/S0048969716301668
___________________________
Trace metals in surface sediments from the Laptev and East Siberian Seas: Levels, enrichment, contamination assessment, and sources
2021
https://www.sciencedirect.com/science/article/abs/pii/S0025326X21010316
___________________________
Nitrogen Fixation and Diazotroph Community in the Subarctic Sea of Japan and Sea of Okhotsk
10 April 2021
https://agupubs.onlinelibrary.wiley.com/doi/abs/10.1029/2020JC017071
___________________________
Living benthic foraminifera of the Okhotsk Sea: Faunal composition, standing stocks and microhabitats
2008
https://www.researchgate.net/publication/235788820_Living_benthic_foraminifera_of_the_Okhotsk_Sea_Faunal_composition_standing_stocks_and_microhabitats
___________________________
Transport of dissolved black carbon from marginal sea sediments to the western North Pacific
2021
https://www.sciencedirect.com/science/article/abs/pii/S0079661121000409
___________________________
Trace metals in deep-sea sediments collected from Kuril Basin (Sea of Okhotsk) and Kuril-Kamchatka Trench area
2021 Jan 28
https://pubmed.ncbi.nlm.nih.gov/33517083/
___________________________
Comparative characteristics of the trace elemental composition of chum salmon Oncorhynchus keta Walbaum, 1792 from the Sea of Japan and the Sea of Okhotsk
2021-11-30
https://marine-biology.ru/mbj/article/view/320
___________________________
Bioindicators of marine pollution in impact areas of the Sea of Okhotsk
2015
https://meetings.pices.int/publications/presentations/PICES-2015/2015-S4/S4-1520-Lukyanova.pdf
___________________________
Sea Urchin Embryogenesis as Bioindicators of Marine Pollution in Impact Areas of the Sea of Japan/East Sea and the Sea of Okhotsk
2017 May 20
https://pubmed.ncbi.nlm.nih.gov/28528417/
___________________________
Comparative effects of pollution stress on the West Bering Sea and Sea of Okhotsk Large Marine Ecosystems
___________________________
Microbian Indication of Pollution of the Coastal Zone of the Sea of Okhotsk and Avacha Bay
March 2004
https://link.springer.com/article/10.1023/B:RUMB.0000025988.87193.c2
___________________________
Bacterial Diversity in Sea Ice from the Southern Ocean and the Sea of Okhotsk
2014
http://pubs.sciepub.com/jaem/2/6/1/
___________________________
The Sea of Okhotsk and the Bering Sea as the region of natural aquaculture: Organochlorine pesticides in Pacific salmon
2016
https://www.sciencedirect.com/science/article/abs/pii/S0025326X16306890
___________________________
Flounders as indicators of environmental contamination by persistent organic pollutants and health risk
2021 Feb 12
Abstract
The purpose of this study was to elucidate the potential of using flounders as bioindicators of accumulation and transformation of POPs and to assess the possible environmental risk to the health of the population of the Russian coastal regions. The mean levels of HCH, DDT, and PCBs in the flounders were as follows: in the eastern Sea of Okhotsk, 49 ± 51, 62 ± 89, and 106 ± 83 ng/g lipid weight; in the southern Sea of Okhotsk, 36 ± 37, 15 ± 16, and 97 ± 41 ng/g lipid wt; in the Sea of Japan/East Sea, 62 ± 36, 39 ± 28, and 1616 ± 1177 ng/g lipid wt, respectively. In the Tatar Strait, OCPs were represented mainly by β-HCH with a concentration of 221 ± 182 ng/g lipid wt; the PCB level was 455 ± 317 ng/g lipid wt. Values of ILCR = 2.1·10-5 due to the consumption of flounder from the Sea of Japan/East Sea at a rate of 29 kg/yr indicate a probability of developing cancer during a lifetime.
https://pubmed.ncbi.nlm.nih.gov/33589318/
___________________________
A review of the Sea of Okhotsk ecosystem response to the climate with special emphasis on fish populations
24 June 2012
https://academic.oup.com/icesjms/article/69/7/1123/750006?login=false
___________________________
Records of sea-ice extent and air temperature at the Sea of Okhotsk from an ice core of Mount Ichinsky, Kamchatka
14 September 2017
Abstarct
The Sea of Okhotsk is the southernmost area in the Northern Hemisphere where seasonal sea ice is produced every year. The formation of sea ice drives thermohaline circulation in the Sea of Okhotsk, and this circulation supports the high productivity in the region. However, recent reports have indicated that sea-ice production in the Sea of Okhotsk is decreasing, raising concern that the decreased sea ice will affect not only circulation but also biological productivity in the sea. To reconstruct climatic changes in the Sea of Okhotsk region, we analyzed an ice core obtained from Ichinskaya Sopka (Mount Ichinsky), Kamchatka. We assumed that the remarkable negative peaks of δD in the ice core were caused by expansion of sea ice in the Sea of Okhotsk. Melt feature percentage (MFP), which indicates summer snowmelt, showed high values in the 1950–60s and the mid-1990s–2000s. The high MFP in the 1950–60s was assumed to be caused by an increase in cyclone activity reaching Kamchatka during a negative period of the Pacific Decadal Oscillation index, and that in the 1990–2000s may reflect the increase in solar irradiation during a positive period of the summer Arctic Oscillation index.
___________________________
DRAINAGE BASINS OF THE SEA OF OKHOTSK AND SEA OF JAPAN
https://unece.org/fileadmin/DAM/env/water/blanks/assessment/okhotsk_japan.pdf
___________________________
Vertical distributions of 226Ra, 228Ra, and 137Cs activities in the southwestern part of the Sea of Okhotsk
___________________________
On the subsoil radon and neutron flux variations in the conditions of the Moscow syneclise on the eve of the earthquake in the Sea of Okhotsk on May 24, 2013
15 November 2017
https://link.springer.com/article/10.1134/S1069351317060052
___________________________
Environmental change in the Sea of Okhotsk during the last 1.1 million years
03 November 2004
https://agupubs.onlinelibrary.wiley.com/doi/full/10.1029/2004PA001023
___________________________
Dissolved and particulate organic carbon in the Sea of Okhotsk: Transport from continental shelf to ocean interior
21 August 2004
https://agupubs.onlinelibrary.wiley.com/doi/full/10.1029/2003JC001909
___________________________
Role of the Cold Okhotsk Sea on the Climate of the North Pacific Subtropical High and Baiu Precipitation
15 Dec 2020
https://journals.ametsoc.org/view/journals/clim/34/2/JCLI-D-20-0432.1.xml
___________________________
Estimating the Total Concentration of Chlorophyll a in the Sea of Okhotsk Using Satellite Data
14 February 2022
https://link.springer.com/article/10.1134/S0001433821090656
___________________________
Sea-ice Changes in the Sea of Okhotsk: Relationship with Storm Tracks and the North Atlantic Oscillation
May 2010
https://ui.adsabs.harvard.edu/abs/2010EGUGA..12.4769M/abstract
___________________________
Microelements in nontronites from bottom sediments of the Sea of Okhotsk
25 December 2011
https://link.springer.com/article/10.1134/S1027451011110127
___________________________
New trace metal data in the Seas of Japan and Okhotsk
24 May 2022
https://www.geotraces.org/new-data-seas-of-japan-okhotsk/
___________________________
Paleoceanography of the last 500 kyrs in the central Okhotsk Sea based on geochemistry
2011
https://www.sciencedirect.com/science/article/abs/pii/S0967064511000786
___________________________
Yoshiyuki Nozaki’s research while affiliated with The University of Tokyo and other places
https://www.researchgate.net/scientific-contributions/Yoshiyuki-Nozaki-71741107
___________________________
Long-distance transport of particulate iron from the Amur River to the western subarctic Pacific reinforced by the combination of Fe and Nd isotopes
December 2013
https://ui.adsabs.harvard.edu/abs/2013AGUFMOS53C1710Y/abstract
___________________________
Observation of sea-ice thickness in the sea of Okhotsk by using dual-frequency and fully polarimetric airborne SAR (pi-SAR) data
30 November 2005
https://ieeexplore.ieee.org/document/1522607
___________________________
Rosneft drills ‘longest well’ at Chaivo field in the Sea of Okhotsk
November 20, 2017
https://www.offshore-technology.com/news/rosneft-drills-longest-well-chaivo-field-sea-okhotsk/
___________________________
What Scientists Say About Decline of Pollock Stocks in Sea of Okhotsk
October 25, 2021
___________________________
Long-Term Trend and Interannual to Decadal Variability in the Sea of Okhotsk
16 June 2020
https://link.springer.com/chapter/10.1007/978-981-15-4886-4_3
___________________________
Stratigraphy and major paleoenvironmental changes in the Sea of Okhotsk during the last million years inferred from radiolarian data
28 May 2009
Abstract
The radiolarian distribution is studied in Core IMAGES MD01-2415 (46-m-long) from the central Sea of Okhotsk. The obtained data made it possible to refine the regional biostratigraphy and document the major paleoenvironmental changes in the basin in the last million years. In total, 17 radiolarian datum planes are defined with 12 of them being new. Their number exceeds that previously established for different fossil groups in the Subarctic Pacific for this period. Radiolarian datum planes are usually confined to the main boundaries and Quaternary climatic events. The analysis of the radiolaria distribution reveals several major paleoenvironmental shifts in the sea that occurred 950, 700, and 420–280 ka ago and are correlative with regional and global phases of the Middle Pleistocene climatic revolution.
https://link.springer.com/article/10.1134/S0001437009010111
___________________________
Dense water formation on the northwestern shelf of the Okhotsk Sea:
1. Direct observations of brine rejection
2004
http://sam.ucsd.edu/ltalley/papers/2000s/shcherbina_okhotsk1_2003JC002196.pdf
___________________________
Causes and impacts of sea ice variability in the sea of Okhotsk using CESM-LE
05 January 2021
https://link.springer.com/article/10.1007/s00382-020-05572-0
___________________________
Properties of sea ice and overlying snow in the Southern Sea of Okhotsk
June 2007
https://link.springer.com/article/10.1007/s10872-007-0037-2
___________________________
Thermokarst and precipitation drive changes in the area of lakes and ponds in the National Parks of northwestern Alaska, 1984–2018
08 Jul 2019
ABSTRACT
Lakes and ponds are important ecosystem components in arctic lowlands, and they are prone to rapid changes in surface area by thermokarst expansion and by sudden lake drainage. The 30 m resolution Landsat record (1984–2018) was used to derive a record of changes in the area of lakes and ponds in the five National Parks of northern Alaska. Surface-water area declined significantly in portions of the study area with ice-rich permafros t and water bodies of thermokarst origin. These declines were associated with rapid lake drainage events resulting from the thermoerosion of outlets. Thermoerosion was probably favored by the record warm mean annual temperatures in the study area, combined with precipitation that fluctuated near long-term normals. The rate of lake loss by rapid drainage was greatest in 2005–2007 and 2018. In landscapes with permafrost of lower ice content and water bodies in depressions of non-thermokarst origin, surface-water area generally fluctuated in response to year-to-year changes in precipitation, without a long-term trend, and lake drainage events were rare. Loss of surface water in ice-rich lowlands is likely to continue as the climate warms, with associated impacts on aquatic wildlife.
https://www.tandfonline.com/doi/full/10.1080/15230430.2019.1629222
___________________________
Take a look at Esieh Lake, the stuff of climate change nightmares
September 26, 2018
Esieh Lake is in a part of Alaska that’s in the Arctic Circle. Each day the lake emits methane at a rate equivalent to about 6,000 cows. If more like it are found, it could be an ominous warning of things to come.
https://bigthink.com/hard-science/esieh-lake-methane/
___________________________
Alaska Has New Lakes. Unfortunately, They're Releasing a lot of Methane
September 28, 2022
https://www.universetoday.com/articles/alaska-has-new-lakes-unfortunately-theyre-releasing-a-lot-of-methane
___________________________
NASA Warns Methane Is Being Belched From Newly Formed Lakes
Sep 27, 2022
https://www.newsweek.com/new-lakes-forming-alaska-permafrost-melt-methane-1746592
___________________________
Influence of Permafrost Thaw on an Extreme Geologic Methane Seep
2020
https://onlinelibrary.wiley.com/doi/am-pdf/10.1002/ppp.2114
___________________________
What's Causing Water to Bubble in the Arctic?
2/14/22
Scientists look for the source of large bubbles in an Arctic lake.
https://www.pbs.org/wgbh/nova/video/methane-lake-arctic/
___________________________
Across The Arctic, Lakes Are Leaking Dangerous Greenhouse Gases
Sep 25, 2018
https://www.ndtv.com/world-news/across-the-arctic-lakes-are-leaking-dangerous-greenhouse-gases-1921638
___________________________
6 US Lakes Sitting on Active Fault Lines
2025
https://allaboutamerica.com/united-states/6-us-lakes-sitting-on-active-fault-lines.html
___________________________
The world’s largest lakes are shrinking dramatically, and scientists say they have figured out why
May 18, 2023
https://www.cnn.com/2023/05/18/world/disappearing-lakes-reservoirs-water-climate-intl/index.html
More than half of the world’s largest lakes and reservoirs have lost significant amounts of water over the last three decades, according to a new study, which pins the blame largely on climate change and excessive water use.
Roughly one-quarter of the world’s population lives in the basin of a drying lake, according to the study by a team of international scientists, published Thursday in the journal Science.
While lakes cover only around 3% of the planet, they hold nearly 90% of its liquid surface freshwater and are essential sources of drinking water, irrigation and power, and they provide vital habitats for animals and plants.
Lake water levels fluctuate in response to natural climate variations in rain and snowfall, but they are increasingly affected by human actions.
Across the world, the most significant lakes are seeing sharp declines. The Colorado River’s Lake Mead in Southwest US has receded dramatically amid a megadrought and decades of overuse. The Caspian Sea, between Asia and Europe – the world’s largest inland body of water – has long been declining due to climate change and water use.
The shrinking of many lakes has been well documented, but the extent of change – and the reasons behind it – have been less thoroughly examined, said Fangfang Yao, the study’s lead author and a visiting scholar at the Cooperative Institute for Research in Environmental Sciences at the University of Colorado Boulder.
The researchers used satellite measurements of nearly 2,000 of the world’s largest lakes and reservoirs, which together represent 95% of Earth’s total lake water storage.
Examining more than 250,000 satellite images spanning from 1992 to 2020, along with climate models, they were able to reconstruct the history of the lakes going back decades.
The results were “staggering,” the report authors said.
They found that 53% of the lakes and reservoirs had lost significant amounts of water, with a net decline of around 22 billion metric tons a year – an amount the report authors compared to the volume of 17 Lake Meads.
More than half of the net loss of water volume in natural lakes can be attributed to human activities and climate change, the report found.
The report found losses in lake water storage everywhere, including in the humid tropics and the cold Arctic. This suggests “drying trends worldwide are more extensive than previously thought,” Yao said.
Different lakes were affected by different drivers.
Unsustainable water consumption is the predominant reason behind the shriveling of the Aral Sea in Uzbekistan and California’s Salton Sea, while changes in rainfall and runoff have driven the decline of the Great Salt Lake, the report found.
In the Arctic, lakes have been shrinking due to a combination of changes in temperature, precipitation, evaporation and runoff.
“Many of the human and climate change footprints on lake water losses were previously unknown,” Yao said, “such as the desiccations of Lake Good-e-Zareh in Afghanistan and Lake Mar Chiquita in Argentina.”
Climate change can have an array of impacts on lakes. The most obvious, Yao said, is to increase evaporation.
As lakes shrink, this can also contribute to an “aridification” of the surrounding watershed, the study found, which in turn increases evaporation and accelerates their decline.
For lakes in colder parts of the world, winter evaporation is an increasing problem as warmer temperatures melt the ice that usually covers them, leaving the water exposed to the atmosphere.
These changes can have cascading effects, including a decrease in water quality, an increase in toxic algal blooms and a loss of aquatic life.
“An important aspect that is not often recognized is the degradation in water quality of the lakes from a warmer climate, which puts stress on water supply for communities that rely on them,” Yao said.
For reservoirs, the report found that the biggest factor in their decline is sedimentation, where sediment flows into the water, clogging it up and reducing space. It’s a “creeping disaster,” Yao said, happening over the course of years and decades.
Lake Powell, for instance – the second-largest human-made reservoir in the US – has lost nearly 7% of its storage capacity due to sediment build-up.
Sedimentation can be affected by climate change, he added. Wildfires, for example, which are becoming more intense as the world warms, burn through forests and destabilize the soil, helping to increase the flow of sediment into lakes and reservoirs.
“The result of sedimentation will be that reservoirs will be able to store less water, thereby becoming less reliable for freshwater and hydroelectric energy supply, particularly for us here in the US, given that our nation’s reservoirs are pretty old,” Yao said.
Not all lakes are declining; around a third of lake declines were offset by increases elsewhere, the report found.
Some lakes have been growing, with 24% seeing significant increases in water storage. These tended to be lakes in less populated regions, the report found, including areas in the Northern Great Plains of North America and the inner Tibetan Plateau.
The fingerprints of climate change are on some of these gains, as melting glaciers fill lakes, posing potential risks to people living downstream from them.
In terms of reservoirs, while nearly two thirds experienced significant water loss, overall there was a net increase due to more than 180 newly filled reservoirs, the report found.
Catherine O’Reilly, professor of geology at Illinois State University, who was not involved with the study, said this new research provides a useful long term data set that helps untangle the relative importance of the factors driving the decline of lakes.
“This study really highlights the impact of climate in ways that bring it close to home – how much water do we have access to, and what are the options to increase water storage?” she told CNN.
“It’s a little scary to see how many freshwater systems are unable to store as much water as they used to,” she added.
As many parts of the world become hotter and drier, lakes must be managed properly. Otherwise climate change and human activities “can lead to drying sooner than we think,” Yao said.
___________________________
Oregon's Mysterious 'Disappearing Lake' Explained
May 6, 2015
https://www.livescience.com/50749-lost-lake-lava-tube.html
___________________________
Gigantic Antarctic Lake Suddenly Disappears in Monumental Vanishing Act
28 June 2021
As the world gets warmer, staggering transformations are taking place in some of Earth's coldest locations – events that might go completely unnoticed by humans, were it not for our eyes in the sky.
In a new study, satellite observations reveal one such stunning phenomenon: The sudden disappearance of a gigantic lake in Antarctica, which abruptly vanished from view during winter 2019.
This was no small body of water, researchers report, with estimates the lake on Amery Ice Shelf in East Antarctica held some 600–750 million cubic meters (21–26 billion cubic feet) of water: more than all the water in Sydney Harbor, or roughly twice the volume of San Diego Bay.
Of course, that much water doesn't simply disappear into thin air. In this case, scientists say the huge reservoir most likely became too much for the ice layer underneath struggling to support it.
https://www.sciencealert.com/gigantic-antarctic-lake-suddenly-disappears-in-monumental-vanishing-act
___________________________
Strong Tides, Vanishing Lakes May Prove Beneficial to Antarctic Ice Shelf
___________________________
Arctic Lakes Are Vanishing a Century Earlier Than Predicted
September 2, 2022
Arctic lakes are drying out nearly a century earlier than projected, depriving the region of a critical source of fresh water, according to new research.
Models had predicted that as warmer weather thaws the Arctic, melting ice would feed into lakes, causing them to expand. Eventually, as ice melted away, those lakes would drain and dry out, sometime later this century, according to earlier projections. But satellite imagery reveals that lakes across the Arctic are shrinking rapidly today.
Researchers tracked a distinct downward trend in Arctic lake cover from 2000 to 2021, observing declines across 82 percent of the study area, which included large swaths of Canada, Russia, Greenland, Scandinavia, and Alaska. As warmer air and more abundant autumn rainfall melt permafrost around and beneath Arctic lakes, water is draining away, scientists say. The effect of rainfall was unaccounted for in prior models, which showed the lakes draining much later. The study was published in the journal Nature Climate Change.
The sooner-than-expected loss of surface water could have a profound effect, scientists say. Lakes comprise 20 to 40 percent of Arctic lowlands, serve as a critical habitat for migratory birds and other wildlife, and supply freshwater to remote Arctic communities.
The climate implications of rapidly melting permafrost are also troubling, researchers say. “Permafrost soils store nearly two times as much carbon as the atmosphere,” Elizabeth Webb, a postdoctoral researcher at the University of Florida and lead author of the study, said in a statement. “There’s a lot of ongoing research suggesting that as permafrost thaws, this carbon is vulnerable to being released to the atmosphere in the form of methane and carbon dioxide.”
https://e360.yale.edu/digest/arctic-lakes-drying-climate-change
___________________________
Disappearing Arctic Lakes
3 Jun 2005
Abstract
https://www.science.org/doi/10.1126/science.1108142
___________________________
Lost Arctic Lakes
The Arctic parks in Alaska are losing lake habitat important to birds and other species, even though precipitation has remained largely the same over time. Like many changes in the Arctic, the disappearance of lakes has been accelerated by warming temperatures.
Much of the Arctic is underlain by permafrost, continuously
frozen soil. As the ground warms, ice in the ground melts and the
surface subsides. While subsidence along a lakeshore can increase the
size of lakes, and thus the amount of water available for habitat, it
can also create new pathways for water to run out of a lake. In areas
where there is more ice in the permafrost, and in years with heavy
snowfall, high water levels in the spring can erode a new outlet
channel, causing all the water to drain (sometimes suddenly) and result
in the disappearance of lakes and loss of habitat.
This paper looks at trends (from 1984-2018) in sites across Alaska's
Arctic parks. The author found that 2005-2007 experienced a major
episode of lake drainages, following very warm years (2003-2004). This
was exceeded, however, by a recent lake drainage event that started in
the summer of 2018 after another series of record-warm years since 2014.
To put it in perspective, from 2000-2017, the average rate of water
loss was about 700 hectares (1,730 acres) per decade; 760 hectares
(1,878 acres) of lake surface disappeared in 2018 alone.
One reason we are concerned about this is that larger lakes in the Arctic are important habitat for Yellow-billed and Pacific Loons.
The Yellow-billed Loon is a rare species in North America, so any
additional habitat loss could impact their numbers. In addition, the
loss of lakes will shift those ecosystems into meadows and shrubland,
creating further ecological changes.
As permafrost thaws, lakes in the Arctic are draining. This video shows where and when lakes have drained over time, since 2000.
https://www.nps.gov/articles/lostarcticlakes.htm
___________________________
Why lakes in Alaska’s Arctic national parks are disappearing — sometimes in a matter of days
October 17, 2019
Permafrost lakes in Arctic Alaska’s national parks lost about 19.5 square kilometers of surface area from 2000 to 2017, and the losses have accelerated as the regions heated up, according to a newly published study that used satellite data to track changes.
The study used satellite data collected from 1984 to 2018 to measure the surface area of lakes in the five farthest-north park units: Bering Land Bridge National Preserve, Cape Krusenstern National Monument, Gates of the Arctic National Park and Preserve, Kobuk Valley National Park and the Noatak National Preserve.
The rate of loss was greatest in the 2005-07 period and in 2018, years that followed years of especially dramatic increases in temperature, the study found. Conditions since 2014 have been the warmest on record, and setting up an extreme loss of lake water in 2018, the study said.
In that single year, according to the results, about 760 hectares (7.6 square kilometers) of lake surface disappeared from the Arctic parks — more than the average per-decade loss from 2000 to 2017.
That warming has only increased, said David Swanson, a Park Service ecologist who authored the study. He expects lake loss to have accelerated after this year’s record-hot summer.
Up to now, Swanson has been collecting the Landsat’s lake data every five years, but the recent heat-up might change that schedule, he said. “I think since it’s so dramatic, I’m going to have to up my game a little,” he said. “A bunch of lakes drained in 2019. It may not be as bad as 2018, but it’s still a lot.”
Permafrost thaw affects lakes in different ways, he said, but for those that drain away, there is a general pattern for most: gradual expansion as ice within the soil melts, followed by a sudden release of accumulated meltwater.
“It can happen over a period of just days,” he said.
The most dramatic loss has been in the park unit with the most ice-rich permafrost: Bering Land National Preserve. There, Swanson’s research found, lakes covered about 9.5 percent of the landscape in the 1980s and 1990s, but that percentage had declined to less than 8.5 percent by 2018 – about a 10.5 percent loss in lake surface area.
In contrast, there was some lake expansion in areas where the permafrost holds relatively little ice, the research found.
Annual precipitation as tracked over the study period varied and had no discernible pattern.
Contrary to what some might expect, more snow and rain do not result in bigger lakes, Swanson said. The added water from above can actually accelerate thaw around the lakes’ edges or on lakebeds, hastening the thaw, he said.
In the winter before the record-hot summer of 2019, there was a lot of snow in northwestern Alaska, he noted. With the combination of high water and exceptionally warm weather, “we’re going to get new outlets forming all over the place,” he said.
The lakes are generally shallow and do not hold much fish or connect to fish-bearing streams, so they are usually not very important to subsistence food-gathering, Swanson said.
They are important, however, to birds. That’s especially the case for loons that are losing their habitat as those lakes drain away, he said.
“These lakes had loons nesting on them before, and loons need quite a bit of water,” he said. “Certainly the lakes that are draining have reduced loon nests.”
Yellow-billed loons, which are considered vulnerable because of their small population size, are dependent on those Arctic Alaska lakes. Also using those lakes are Pacific and red-throated loons.
Effects on loons are also being studied by Swanson’s Park Service colleagues, as are other climate-change effects in Arctic national parks. That work is being conducted by the Park Service’s Arctic Inventory and Monitoring Network.
Lakes across the world’s permafrost landscapes, like those in the Arctic Alaska parks, are draining and shrinking, several studies have shown.
Canadian lakes from 50 to 70 degrees latitude lost more than 6,700 square kilometers from 2000 to 2009, according to a University of Maryland study published in 2011.
A 2005 study of more than 10,000 lakes in northern Siberia, also using satellite imagery, found that about 11 percent of them disappeared between 1973 and 1997-98. Most of the lakes that remained shrank, the total surface area that was covered by lake water declined by about 6 percent in the 25-year period, the study found.
Past studies in Alaska have yielded similar results.
On the northern Seward Peninsula — where Bering Land Bridge National Monument is located — satellite imagery from 1950 to 2007 showed that the total water surface area decreased by 14.9 percent, according to a 2011 study by University of Alaska Fairbanks scientists.
___________________________
How collapsing permafrost is transforming Arctic lakes, ponds and streams
January 24, 2020
Lakes, ponds and streams cover a large fraction of the low-lying tundra that circles the Arctic. For example, roughly 65,000 lakes and ponds lie within the Mackenzie Delta and an area to its east.
Lakes across this terrain often exist because of the impermeable nature of the permafrost around and below these lakes. Some of this permafrost has existed here since the last ice age.
Yet as the climate warms, this permafrost is at risk of thawing for the first time in tens of thousands of years. Permafrost thaw has already caused some of these lakes to drain and dry up, and others to expand. Dramatic changes over the last 70 years have been well documented through air photos and satellite images.
These lakes are linked by a vast network of rivers and streams, and are important habitat for large populations of migratory birds, fish and mammals. They are also vital to the lives of northerners, who use them for hunting, fishing, trapping, transportation, fresh water and recreation.
With increasing evidence of ecosystem destruction around the world related to the changing climate, there is also increasing concern that unique Arctic freshwater ecosystems are under threat.
Disappearing lakes
Lakes controlled by the presence of permafrost can drain rapidly if the permafrost gives way, a process called catastrophic lake drainage. Sometimes an entire lake can drain in as little as a day, like the one that we studied after it vanished from the landscape north of Inuvik, Northwest Territories, in 16 hours in August 1989.
The disappearance of this lake occurred as water seeped through cracks that had formed in ice wedges during the previous winter. The relatively warm lake water melted the ice within the permafrost, creating a new outlet channel.
Lake drainage presents a serious safety risk to hunters or fishers who may be downstream. It also destroys freshwater habitat, quickly converting it to land, and expands, or even forms, new stream channels.
Like many impacts of climate change on the Arctic, however, unexpected changes also occur. After our initial studies of draining lakes, we expected to find the number of lakes draining annually across this region would increase as the climate warmed.
Instead, we found lake drainage in this area had decreased by one-third between 1950 and 2000. This decrease is likely due to fewer extremely cold winter days that are needed for ice wedge cracking to occur over the winter.
Yet as warming continues, the upper layer of the soil that thaws each year is expected to get deeper and will likely lead to more lake drainage events. An increase in lake drainage has already been reported in Siberia, and this is likely the long-term future of many Arctic lowland lakes.
Expanding lakes
Other lowland lakes are expanding as ice in the lake shoreline melts. New lakes may also appear in the tundra depressions that form as ice-rich permafrost thaws, creating new aquatic habitat. Changes like this have been seen in Siberia, but they haven’t been observed in the Inuvik region yet.
This thawing of ice-rich permafrost, called thermokarst, results in changes in water chemistry and increases in water clarity. These changes will likely affect aquatic food webs in ways that are still poorly understood.
The Arctic is warming at two to three times the rate of the global average. But determining where the permafrost will thaw — in what way and how quickly — is a complicated puzzle affected by many factors.
For example, there are an increasing number of shrubs growing on the tundra. This affects the accumulation of blowing snow, and may speed up or slow down the rate of snow melt and shorten or lengthen the number of snow-free days. All of this affects permafrost thaw and freshwater systems.
Millennia of change ahead
Scientific organizations, governments and international groups around the world have all recently warned of the alarming impacts climate change is having — and will have — on the Arctic. Thawing permafrost is already destabilizing buildings, roads and airstrips, eroding coastlines and releasing more carbon into the atmosphere.
It is critically important to realize that permafrost thaw will not stop once the global climate has stabilized, whether at the Paris Agreement limits of 1.5 or 2 degrees Celsius, or at much higher levels. Even if anthropogenic carbon emissions are reduced over the coming decades, the concentration of carbon dioxide in the atmosphere will remain above pre-industrial levels for centuries — and likely millennia. Temperatures will also remain high.
As long as the global average temperature stays above the pre-industrial average, permafrost will continue to thaw, ground ice will melt, the land will subside, lakes and streams and freshwater ecosystems will change dramatically, with devastating effects on the peoples of the Arctic who have used these freshwater systems for generations.
Over the next year, governments will make decisions that will limit
the increase in global temperature to below 1.5 C or allow global
warming to further increase to 2 C or more. Our decisions will impact
the Arctic and the globe for generations.![]()
___________________________
Degrading underground ice wedges are reshaping Arctic landscape
March 14, 2016
Abstract
Rapid melting of ice and Arctic permafrost is altering tundra regions in Alaska, Canada and Russia, according to a new study. Ice-wedge degradation has been observed before in individual locations, but this is the first study to determine that rapid melting has become widespread throughout the Arctic.
https://www.sciencedaily.com/releases/2016/03/160314140126.htm
___________________________
Pan-Arctic ice-wedge degradation in warming permafrost and its influence on tundra hydrology
14 March 2016
Abstract
Ice wedges are common features of the subsurface in permafrost regions. They develop by repeated frost cracking and ice vein growth over hundreds to thousands of years. Ice-wedge formation causes the archetypal polygonal patterns seen in tundra across the Arctic landscape. Here we use field and remote sensing observations to document polygon succession due to ice-wedge degradation and trough development in ten Arctic localities over sub-decadal timescales. Initial thaw drains polygon centres and forms disconnected troughs that hold isolated ponds. Continued ice-wedge melting leads to increased trough connectivity and an overall draining of the landscape. We find that melting at the tops of ice wedges over recent decades and subsequent decimetre-scale ground subsidence is a widespread Arctic phenomenon. Although permafrost temperatures have been increasing gradually, we find that ice-wedge degradation is occurring on sub-decadal timescales. Our hydrological model simulations show that advanced ice-wedge degradation can significantly alter the water balance of lowland tundra by reducing inundation and increasing runoff, in particular due to changes in snow distribution as troughs form. We predict that ice-wedge degradation and the hydrological changes associated with the resulting differential ground subsidence will expand and amplify in rapidly warming permafrost regions.
https://www.nature.com/articles/ngeo2674
___________________________
Tilt of Spruce Trees near Ice Wedges, Mackenzie Delta, Northwest Territories, Canada
2004
https://www.jstor.org/stable/1552316
___________________________
Frost‐cracking conditions, Bylot Island, eastern Canadian Arctic archipelago
1 April 2005
https://www.semanticscholar.org/paper/Frost%E2%80%90cracking-conditions%2C-Bylot-Island%2C-eastern-Fortier-Allard/448f4a10536f0d96cfb5752a2b41bcc2a788b8cd
___________________________
Distant earthquakes can cause underwater landslides
June 28, 2017

New research finds large earthquakes can trigger underwater landslides thousands of miles away, weeks or months after the quake occurs.
Researchers analyzing data from ocean bottom seismometers off the Washington-Oregon coast tied a series of underwater landslides on the Cascadia Subduction Zone, 80 to 161 kilometers (50 to 100 miles) off the Pacific Northwest coast, to a 2012 magnitude-8.6 earthquake in the Indian Ocean – more than 13 500 kilometers (8 390 miles) away. These underwater landslides occurred intermittently for nearly four months after the April earthquake.
https://watchers.news/2017/06/28/distant-earthquakes-underwater-landslides/
___________________________
Deformation of the Northwestern Okhotsk Plate:
How is it happening?
2009
Abstract. The Eurasia (EU) – North America (NA) plate
boundary zone across Northeast Asia still presents many
open questions within the plate tectonic paradigm. Con-
straining the geometry and number of plates or microplates
present in the plate boundary zone is especially difficult be-
cause of the location of the EU-NA euler pole close to or
even upon the EU-NA boundary. One of the major chal-
lenges remains the geometry of the Okhotsk plate (OK).
whose northwestern portion terminates on the EU-OK-NA
triple junction and is thus caught and compressed between
converging EU and NA. We suggest that this leads to a co-
herent and understandable large scale deformation pattern of
mostly northwest-southeast trending strike-slip faults which
split Northwest OK into several extruding slivers. When the
fault geometry is analysed together with space geodetic and
focal mechanism data it suggests a central block which is ex-
truding faster bordered east and west by progressively slower
extruding blocks until the OK plate boundary faults are en-
countered. Taking into account elastic loading from both the
intra-OK faults and the OK-Pacific (PA) boundary reconciles
geodetic motions with geologic slip rates on at least the OK-
NA boundary which corresponds to the Ulakhan fault
https://smsps.copernicus.org/articles/4/147/2009/smsps-4-147-2009.pdf
___________________________
Fate of Sinking Tectonic Plates Has Long Puzzled Scientists – Now They’ve Found an Answer
December 11, 2021
https://scitechdaily.com/fate-of-sinking-tectonic-plates-has-long-puzzled-scientists-now-theyve-found-an-answer/
___________________________
Nearly half of China’s major cities are sinking — some ‘rapidly’
18 April 2024
https://www.nature.com/articles/d41586-024-01149-7
___________________________
Sinking cities
https://en.wikipedia.org/wiki/Sinking_cities
Sinking cities are urban environments that are in danger of disappearing due to their rapidly changing landscapes. The largest contributors to these cities becoming unlivable are the combined effects of climate change (manifested through sea level rise, intensifying storms, and storm surge), land subsidence, and accelerated urbanization.[2] Many of the world's largest and most rapidly growing cities are located along rivers and coasts, exposing them to natural disasters. As countries continue to invest people, assets, and infrastructure into these cities, the loss potential in these areas also increases.[3] Sinking cities must overcome substantial barriers to properly prepare for today's dynamic environmental climate.
Causes
Throughout the twenty-first century, as these cities continued to grow, fresh water became an ever more precious resource. Due to the dense populations along river deltas, industrial development, and relaxed or no environmental protections, river waters often became polluted. This has become an ever more common phenomena in coastal mega-cities, particularly in Asia. Many cities are unable to afford costly water treatment systems and are forced to rely heavily on groundwater.[4] When groundwater is extracted from aquifers in the subsurface more rapidly than it is able to recharge, voids are created beneath the earth. As the ground is loaded, most often through increased development, the soil compresses and land begins to subside. Depending on the geology of the region, subsidence may occur rapidly, as in many coastal plains, or more slowly depending on bedrock depth.[15]
High buildings can create land subsidence by pressing the soil beneath with their weight. The problem is already felt in New York City, San Francisco Bay Area, Lagos.[16][17]
Examples
Venice is often referenced as an example of a city suffering from subsidence, however, it is a relatively minor case with mostly historical origins. More serious are the Asian metropolises with concentrations of millions of people living at or even below mean sea level.[18] Some cities, such as Tokyo, have developed sophisticated techniques for measuring, monitoring, and combating land subsidence. But many other large cities (Hanoi, Haiphong, Yangon, Manila, etc.), particularly in developing nations, have no record of their subsidence, which is far from under control.[18] Many cities do not possess the resources necessary to conduct complex, and often expensive, geological, geotechnical, and hydrogeological studies required to accurately measure and model future land subsidence.
| City | Mean cumulative subsidence in period 1900-2013 (mm) |
Mean current subsidence rate (mm/year) |
Maximum subsidence rate (mm/year) |
Estimated additional mean cumulative subsidence until 2025 (mm) |
|---|---|---|---|---|
| Jakarta |
2,000 | 75 - 100 | 179 | 1,800 |
| Ho Chi Minh City |
300 | up to 80 | 80 | 200 |
| Bangkok |
1,250 | 20 - 30 | 120 | 190 |
| New Orleans |
1,130 | 60 | 26 | > 200 |
| Tokyo |
4,250 | ≈ 0 | 239 | 0 |
Mexico City is an example of a sinking city that is neither coastal nor low-lying. The city was originally constructed by the Aztecs above a large aquifer in the 1300s. Subsidence was originally caused by the loading of large Aztec and Spanish structures. The city grew rapidly during the nineteenth century, and with it, so did the demand for water. By 1854 more than 140 wells had been drilled into the aquifer beneath Mexico City.[19] Although the early cultures drew water from the same lakes and aquifers, they were merely 300,000 people as compared to the city's current population of 21 million. Today, the historic and densely populated city is rapidly sinking at varying rates between 15 – 46 cm/year. The city is also currently plagued with water shortage issues emphasizing a common positive feedback loop that exists within sinking cities.
___________________________
Cities Around The World That Are Sinking
June 3, 2023
Houston, Texas
Venice, Italy
Bangkok, Thailand
Ho Chi Minh City, Vietnam
Tokyo, Japan
Rotterdam, The Netherlands
Shanghai, China
Kolkata, India
London, England
Miami, Florida
https://www.grunge.com/1300213/cities-around-world-sinking/
___________________________
Global peak water limit of future groundwater withdrawals
22 April 2024
Abstract
Over the past 50 years, humans have extracted the Earth’s groundwater stocks at a steep rate, largely to fuel global agro-economic development. Given society’s growing reliance on groundwater, we explore ‘peak water limits’ to investigate whether, when and where humanity might reach peak groundwater extraction. Using an integrated global model of the coupled human–Earth system, we simulate groundwater withdrawals across 235 water basins under 900 future scenarios of global change over the twenty-first century. Here we find that global non-renewable groundwater withdrawals exhibit a distinct peak-and-decline signature, comparable to historical observations of other depletable resources (for example, minerals), in nearly all (98%) scenarios, peaking on average at 625 km3 yr−1 around mid-century, followed by a decline through 2100. The peak and decline occur in about one-third (82) of basins, including 21 that may have already peaked, exposing about half (44%) of the global population to groundwater stress. Most of these basins are in countries with the highest current extraction rates, including the United States, Mexico, Pakistan, India, China, Saudi Arabia and Iran. These groundwater-dependent basins will probably face increasing costs of groundwater and food production, suggesting important implications for global agricultural trade and a diminished role for groundwater in meeting global water demands during the twenty-first century.
https://www.nature.com/articles/s41893-024-01306-w
___________________________
Groundwater in the Arctic is delivering more carbon into the ocean than was previously known
January 30, 2025
https://phys.org/news/2025-01-groundwater-arctic-carbon-ocean-previously.html
___________________________
Sharp depletion in soil moisture drives land water to flow into oceans, contributing to sea level rise
May 14, 2025
The increasing frequency of once-in-a-decade agricultural and ecological drought has underscored the urgency of studying hydrological changes. A research team from the Department of Land Surveying and Geo-informatics of The Hong Kong Polytechnic University (PolyU) has collaborated with international experts to analyse the estimated changes in land water storage over the past 40 years by utilising space geodetic observation technology and global hydrological change data. This innovative method has revealed a rapid depletion in global soil moisture, resulting in a significant amount of water flowing into the oceans, leading to a rise in sea levels. The research provides new insights into the driving factors behind the alarming reduction in terrestrial water storage and rise in sea levels. The findings have been published in the international journal Science.
Since polar motion reflects mass redistribution within the Earth system, integrating models and observations across the atmosphere, hydrosphere and lithosphere is crucial. However, previous challenges in measuring terrestrial water storage, particularly groundwater and root zone soil moisture, limited understanding of hydrological depletion at continental scales. Prof. Jianli CHEN, Professor of the PolyU Department of Land Surveying and Geo-informatics and core member of the Research Institute for Land and Space and the international team employed satellite altimetry and gravity missions, including the Gravity Recovery and Satellite Experiment (GRACE), and GRACE Follow-On, to enable continental-scale observations of terrestrial water storage variations. By integrating this with global mean sea levels and polar motion data, the team has explored terrestrial water storage depletion patterns. Notably, this study introduced novel methods for estimating global soil moisture, which improves the accuracy of continental and global scale modeling to enable a more effective understanding of soil moisture variations under climate change.
The melting of Greenland's ice sheet is recognised as the largest single contributor to the rise in global sea levels, adding approximately 0.8mm annually. This study reveals that between 2000 and 2002, the global terrestrial water storage significantly declined, with a total of 1,614 billion tons of water lost to the oceans, which is twice as much as resulting from the current melting of Greenland ice, and equivalent to a 4.5mm rise in sea levels. Since then, the rapid loss of terrestrial water storage has been followed by a more gradual but continuous depletion, with no signs of recovery.
In addition, compared to the period from 1979 to 1999, a notable decline in global average soil moisture was observed from 2003 to 2021. Between 2003 and 2011, the Earth's pole shifted 58cm toward 93° East Longitude, demonstrating that the continued decline in soil moisture is leading to a reduction in terrestrial water storage.
The team also pointed out that precipitation deficits and stable evapotranspiration caused by global warming, changing rainfall patterns and increasing ocean temperatures are likely the key factors for the abrupt decline in terrestrial water storage. The ERA5-Land soil moisture data of the European Centre for Medium-Range Weather Forecasts' corroborates these findings, showing substantial terrestrial water storage losses in Africa, Asia, Europe, and South America. In Asia and Europe, the affected areas expanded from northeastern Asia and eastern Europe to broader regions across East and Central Asia, as well as Central Europe, following the sharp water storage depletion observed between 2000 and 2002.
With increasing agricultural irrigation in regions such as northeast China and the western United States, and global greening, soil moisture may further diminish in semi-arid areas with intensive agriculture and high levels of greening. The team suggests the need for improved land surface models which consider these factors for a more comprehensive understanding of long- term changes in terrestrial water storage.
___________________________
A fractional-order framework for investigating groundwater depletion under environmental and human pressures
16 May 2025
https://link.springer.com/article/10.1007/s12190-025-02514-z
___________________________
Scientists find hidden 'hotspot' that helped create the Great Lakes before North America even existed
The Great Lakes formed where they did 20,000 years ago thanks to a hotspot that sat under the supercontinent Pangaea 300 million years ago, before North America even existed.
New research finds that the Cape Verde hotspot, which still exists under the island nation in the Central Atlantic Ocean, heated and stretched the crust under the spot that would eventually become the Great Lakes. This process, which happened over tens of millions of years, led to a low spot in the topography of the region, which glaciers later scraped out during the ice age. After the glaciers retreated, their melt filled the lakes, which now hold 21% of the world's fresh water.
"It was the hotspot which made the first imprint," said Aibing Li, a seismologist at the University of Houston and a co-author of the new paper, published Dec. 25 in the journal Geophysical Research Letters.
___________________________
Arctic hotspots study reveals areas of climate stress in Northern Alaska and Siberia
January 16, 2025
https://phys.org/news/2025-01-arctic-hotspots-reveals-areas-climate.html
___________________________
Drift Ice in the Sea of Okhotsk
March 20, 2020
Sea ice in the Northern Hemisphere is not limited to the cap of ice that tops the Arctic Ocean; seas around and south of the Arctic Circle also can get a seasonal covering. These satellite images, acquired in March 2020, show ice in the Sea of Okhotsk—one of the lowest latitudes (down to 44° North) in the Northern Hemisphere where a sizable amount of seasonal sea ice forms each year.
Ice formation here is aided by cold westerly winds that blow out from East Siberia for much of the winter. Freshwater from the Amur and other rivers also helps ice form in parts of the sea. When freshwater mixes with seawater, the water mass becomes fresher (less saline) than seawater alone, which allows it to freeze at a warmer temperature.
The two images above, acquired by the Operational Land Imager (OLI) on Landsat 8, show thin sea ice in the Sea of Okhotsk on March 12, 2020. The area shown is just off the southeastern coast of Sakhalin, Russia’s largest island. Much of this ice likely started forming north of the island and was then carried south by the Sakhalin Current, which flows south along the island’s east coast. Northwest and west winds likely pushed the ice to the southeast and east, as evidenced by the streaks.
https://earthobservatory.nasa.gov/images/146451/drift-ice-in-the-sea-of-okhotsk
___________________________
Tidal Vortices in the Sea of Okhotsk
December 1, 2021
https://earthobservatory.nasa.gov/images/149148/tidal-vortices-in-the-sea-of-okhotsk
___________________________
Quantitative evaluation of iron transport processes in the Sea of Okhotsk
2014
https://www.sciencedirect.com/science/article/abs/pii/S0079661114000597
___________________________
Chapter: 6 Causes and Effects in the Bering Sea Ecosystem
National
Academies of Sciences, Engineering, and Medicine. 1996. The Bering Sea
Ecosystem. Washington, DC: The National Academies Press.
https://doi.org/10.17226/5039.
https://nap.nationalacademies.org/read/5039/chapter/8
___________________________
UAF-led study will examine long-term mercury levels in Bering Sea
August 25, 2020
https://news.uaf.edu/uaf-led-study-will-examine-long-term-mercury-levels-in-bering-sea/
___________________________
Mercury distribution in ancient and modern sediment of northeastern Bering Sea
1972
https://pubs.er.usgs.gov/publication/ofr72268
___________________________
Bering Sea storm now strongest on record in North Pacific
2014
___________________________
Spatial characteristics and removal of dissolved black carbon in the western Arctic Ocean and Bering Sea
2021
https://www.sciencedirect.com/science/article/abs/pii/S0016703721002398
___________________________
Ventilation time and anthropogenic CO2 in the Bering Sea and the Arctic Ocean based on carbon tetrachloride measurements
31 March 2018
https://link.springer.com/article/10.1007/s10872-018-0471-3
___________________________
Shipborne observations of atmospheric black carbon aerosol particles over the Arctic Ocean, Bering Sea, and North Pacific Ocean during September 2014
04 January 2016
https://agupubs.onlinelibrary.wiley.com/doi/full/10.1002/2015JD023648
___________________________
High sensitivity of Bering Sea winter sea ice to winter insolation and carbon dioxide over the last 5500 years
2 Sep 2020
https://www.science.org/doi/10.1126/sciadv.aaz9588
___________________________
Black Carbon in Smoke over Alaska
August 21, 2005
https://earthobservatory.nasa.gov/images/5790/black-carbon-in-smoke-over-alaska
___________________________
Polycyclic aromatic hydrocarbons in benthos of the northern Bering Sea Shelf and Chukchi Sea Shelf
2020
https://www.sciencedirect.com/science/article/abs/pii/S1001074220301686
___________________________
Recent carbon and nitrogen uptake rates of phytoplankton in Bering Strait and the Chukchi Sea
2007
https://www.sciencedirect.com/science/article/abs/pii/S0278434307001409
___________________________
Origin of the deep Bering Sea nitrate deficit: Constraints from the
nitrogen and oxygen isotopic composition of water column nitrate
and benthic nitrate fluxes
2005
https://agupubs.onlinelibrary.wiley.com/doi/pdf/10.1029/2005GB002508
___________________________
Ecological Risk Assessment of Trace Metal in Pacific Sector of Arctic Ocean and Bering Strait Surface Sediments
2022
https://www.ncbi.nlm.nih.gov/pmc/articles/PMC9031188/
___________________________
Content and distribution of trace metals in surface sediments from the northern Bering Sea, Chukchi Sea and adjacent Arctic areas
2011
https://www.sciencedirect.com/science/article/abs/pii/S0025326X1100066X
___________________________
Dissolved zinc in the subarctic North Pacific and Bering Sea: Its distribution, speciation, and importance to primary producers
June 2012
___________________________
Radon-222 and radium-226 in southeastern Bering Sea shelf waters and sediment
1987
https://www.sciencedirect.com/science/article/abs/pii/0278434387900902
___________________________
Processes controlling radon-222 and radium-226 on the southeastern Bering Sea shelf
1985
https://scholarworks.alaska.edu/handle/11122/5139
___________________________
Distributions of radiocesium and radium isotopes in the western Bering Sea in 2018
2020
https://www.sciencedirect.com/science/article/abs/pii/S0304420320300979
___________________________
Transport paths of radiocesium and radium isotopes in the intermediate layer of the southwestern Sea of Okhotsk
___________________________
Ra in Bering Sea sediment and its application as a geochronometer
1979
https://www.jstage.jst.go.jp/article/geochemj1966/13/6/13_6_231/_pdf
___________________________
Intermediate water formation in the Bering Sea during glacial periods: Evidence from neodymium isotope ratios
May 01, 2010
___________________________
Ocean Life
https://www.whoi.edu/oceanus/topics/ocean-life/
___________________________
Intermediate Water formation in the Bering Sea during glacial periods: Evidence from neodymium isotope ratios
___________________________
Fukushima radiation arrives in Bering Sea
March 29, 2019
https://mustreadalaska.com/fukushima-radiation-arrives-in-bering-sea/
___________________________
Radiocesium in the western subarctic area of the North Pacific Ocean, Bering Sea, and Arctic Ocean in 2013 and 2014
2017 Feb 27
https://pubmed.ncbi.nlm.nih.gov/28283355/
___________________________
Response of the Bering Sea to 11-year solar irradiance cycles during the Bølling-Allerød
02 April 2014
https://agupubs.onlinelibrary.wiley.com/doi/10.1002/2014GL059509
___________________________
Productivity, chlorophyll a, Photosynthetically Active Radiation (PAR) and other phytoplankton data from the Arctic Ocean, Bering Sea, Chukchi Sea, Beaufort Sea, East Siberian Sea, Kara Sea, Barents Sea, and Arctic Archipelago measured between 17 April, 1954 and 30 May, 2006 compiled as part of the Arctic System Science Primary Production (ARCSS-PP) observational synthesis project (NCEI Accession 0063065)
https://www.ncei.noaa.gov/access/metadata/landing-page/bin/iso?id=gov.noaa.nodc:0063065;view=iso
___________________________
Deep-water formation in the Bering Sea? Insights from Nd isotopes for core U1341 (Bowers Ridge, IODP 323)
July 2011
___________________________
Geochemistry of mercury in surface sediments of the Kuril Basin of the Sea of Okhotsk, Kuril-Kamchatka Trench and adjacent abyssal plain and northwest part of the Bering Sea
2017
https://www.sciencedirect.com/science/article/abs/pii/S0967064517302230
___________________________
Flounders as indicators of environmental contamination by persistent organic pollutants and health risk
February 2021
___________________________
Sea-Ice thickness retrieval in the Sea of Okhotsk using dual-polarization SAR data
14 September 2017
___________________________
Distributions of radiocesium and radium isotopes in the western Bering Sea in 2018
2020
https://www.sciencedirect.com/science/article/abs/pii/S0304420320300979
___________________________
Transport paths of radiocesium and radium isotopes in the intermediate layer of the southwestern Sea of Okhotsk
2022
https://www.sciencedirect.com/science/article/pii/S0265931X22001229
___________________________
The detection of Fukushima-derived radiocesium in the Bering Sea and Arctic Ocean six years after the nuclear accident
2019
https://www.sciencedirect.com/science/article/abs/pii/S0269749119338679
___________________________
Characteristics of Heat Transfer over the Ice Covered Sea of Okhotsk during Cold-air Outbreaks
2003
https://www.bio.mie-u.ac.jp/~tachi/JMSJVol.81(2003)No5.pp1057-1067.pdf
___________________________
Health risk high toxin levels found in whale meat
18th January 2003
http://www.eurocbc.org/page658.html
___________________________
Pollutants from far away found in Bering Sea animals hunted by Indigenous people
___________________________
Russia floats plan to unilaterally increase its pollock harvest in the Bering Sea by 36%
24 June 2022
___________________________
Recent climate variation in the Bering and Chukchi Seas and its linkages to large-scale circulation in the Pacific
05 January 2014
https://link.springer.com/article/10.1007/s00382-013-2042-z
___________________________
The Bering Sea's a changing
2006
https://arctic.cbl.umces.edu/web-content/GrebmeierNomeNugget06.pdf
___________________________
Adaptation Actions for a Changing Arctic: Perspectives from the Bering-Chukchi-Beaufort Region
28 December 2017
https://www.osti.gov/biblio/1435018
___________________________
Chlorofluorocarbons in the Sea of Okhotsk: Ventilation of the intermediate water
2004
https://agupubs.onlinelibrary.wiley.com/doi/epdf/10.1029/2003JC001919
___________________________
Reconstruction of paleoproductivity in the Sea of Okhotsk over the last 30 kyr
02 March 2004
https://agupubs.onlinelibrary.wiley.com/doi/10.1029/2002PA000808
___________________________
Enhancement of coccolithophorid blooms in the Bering Sea by recent environmental changes
2012
https://agupubs.onlinelibrary.wiley.com/doi/epdf/10.1029/2011GB004177
___________________________
Covariation between molybdenum and uranium isotopes in reducing marine sediments
2022
https://www.sciencedirect.com/science/article/pii/S0009254122002157
___________________________
Investigation of the Uranium Solubility and Absorption
January 2005
___________________________
Uranium in the oceans: Where it goes and why
1991
https://www.sciencedirect.com/science/article/abs/pii/001670379190024Y
___________________________
Postdepositional enrichment of uranium in sediment from the Bering Sea
1984
https://www.sciencedirect.com/science/article/abs/pii/0025322784900422
___________________________
Strontium isotope analyses (87Sr/86Sr) of otoliths from anadromous Bering cisco (Coregonus laurettae) to determine stock composition
___________________________
Strontium isotope analyses (87Sr/86Sr) of otoliths from anadromous Bering cisco (Coregonus laurettae) to determine stock composition
October 2015
https://academic.oup.com/icesjms/article/72/7/2110/2457879?login=false
___________________________
Scientists to set sail in search of Bering Sea's stormy past
July 27, 2022
https://phys.org/news/2022-07-scientists-bering-sea-stormy.html
___________________________
NPS Researchers Explore the Impact of Sea Ice Change in Bering Sea
July 20, 2022
https://nps.edu/-/nps-researchers-explore-the-impact-of-sea-ice-change-in-bering-sea
___________________________
Shell-bearing Gastropoda from the methane seeps and hydrothermal vents of the Bering Sea: A preliminary description
2022
https://www.sciencedirect.com/science/article/abs/pii/S0967064522001497
___________________________
Seasonal variations of sea ice and ocean circulation in the Bering Sea: A model-data fusion study
13 February 2009
https://agupubs.onlinelibrary.wiley.com/doi/full/10.1029/2008JC004727
___________________________
Physical forcing of ecosystem dynamics on the Bering Sea Shelf
2005
https://www.pmel.noaa.gov/pubs/outstand/stab2529/stab2529.shtml
___________________________
Mercury Stable Isotopes in Seabird Eggs Reflect a Gradient from Terrestrial Geogenic to Oceanic Mercury Reservoirs
April 21, 2012
https://pubs.acs.org/doi/10.1021/es2047156
___________________________
Mercury - The Hidden Danger of Arctic Warming?
27 July, 2012
https://skepticalscience.com/print.php?n=1467
___________________________
Steller sea lions and mercury
October 30, 2020
https://www.gi.alaska.edu/alaska-science-forum/steller-sea-lions-and-mercury
___________________________
Risk to consumers from mercury in Pacific cod (Gadus macrocephalus) from the Aleutians: fish age and size effects
2007 Jun 27
https://pubmed.ncbi.nlm.nih.gov/17599825/
___________________________
High mercury bioaccumulation in Pacific salmons from the Sea of Okhotsk and the Bering Sea
18 January 2018
https://link.springer.com/article/10.1007/s10311-018-0704-0
___________________________
Arctic source for elevated atmospheric mercury (Hg0) in the western Bering Sea in the summer of 2013
2017
https://www.sciencedirect.com/science/article/abs/pii/S1001074217304151
___________________________
Distribution of methane in waters of the Okhotsk and western Bering Seas, and the area of the Kuril Islands
January 1997
https://link.springer.com/article/10.1023/A:1003114031011
___________________________
As Climate Changes, Methane Trapped Under Arctic Ocean Could Bubble to the Surface
May 4, 2011
https://newscenter.lbl.gov/2011/05/04/methane-arctic/
___________________________
Shell-bearing Gastropoda from the methane seeps and hydrothermal vents of the Bering Sea: A preliminary description
2022
https://www.sciencedirect.com/science/article/abs/pii/S0967064522001497
___________________________
Release of methane from Bering Sea sediments during the last glacial period
2008
https://digital.library.unt.edu/ark:/67531/metadc929343/m2/1/high_res_d/969330.pdf
___________________________
Source analysis of dissolved methane in Chukchi Sea and Bering Strait during summer–autumn of 2012 and 2013
2022
https://www.sciencedirect.com/science/article/abs/pii/S0304420322000366
___________________________
Ice in Bering Sea has hit lowest level in thousands of years, study says
Sept. 2, 2020
https://thehill.com/changing-america/sustainability/environment/514893-ice-in-bering-sea-has-hit-lowest-level-in/
___________________________
Stable oxygen isotopes in shallow marine ostracodes from the northern Bering and Chukchi Seas
2021
https://www.sciencedirect.com/science/article/pii/S0377839821000426
___________________________
Using Peat Oxygen Isotopes to Elucidate Patterns of Sea Ice Extent over the Last 5,500 Years in the Bering Sea, Alaska
November 30, 2020
https://www.usgs.gov/news/using-peat-oxygen-isotopes-elucidate-patterns-sea-ice-extent-over-last-5500-years-bering-sea
___________________________
Distribution of dissolved oxygen and causes of maximum concentration in the Bering Sea in July 2010
27 May 2014
https://link.springer.com/article/10.1007/s13131-014-0485-7
___________________________
Nutrient regeneration and oxygen demand in Bering Sea continental shelf sediments
1992
https://www.sciencedirect.com/science/article/abs/pii/027843439290085X
___________________________
Spatiotemporal variability of the nitrogen deficit in bottom waters on the eastern Bering Sea shelf
2021
https://www.sciencedirect.com/science/article/abs/pii/S0278434321000807
___________________________
Biogeochemical cycling of nutrient in the western Bering Sea as revealed by nitrogen isotopic composition of nitrate and suspended particles
2021
https://www.sciencedirect.com/science/article/pii/S096706372100090X
___________________________
Changes in the oxygen isotope composition of the Bering Sea contribution to the Arctic Ocean are an independent measure of increasing freshwater fluxes through the Bering Strait
2022
https://www.ncbi.nlm.nih.gov/pmc/articles/PMC9409538/
___________________________
Organochlorine pesticides and polychlorinated biphenyls in the Bering flounder (Hippoglossoides robustus) from the Sea of Okhotsk
2018
https://www.sciencedirect.com/science/article/abs/pii/S0025326X18307197
___________________________
The Sea of Okhotsk: a billion dollar ecosystem
http://arctic.blogs.panda.org/default/the-sea-of-okhotsk-a-billion-dollar-ecosystem/
___________________________
Sea of Okhotsk Fisheries Enforcement Act of 1995
https://www.law.cornell.edu/topn/sea_of_okhotsk_fisheries_enforcement_act_of_1995
___________________________
Plutonium isotopes in the North Western Pacific sediments coupled with radiocarbon in corals recording precise timing of the Anthropocene
01 July 2022
https://www.nature.com/articles/s41598-022-14179-w
___________________________
Geochemical features of the Okhotsk Sea Cenozoic volcanism
06 October 2006
https://link.springer.com/article/10.1007/s00367-006-0036-0
___________________________
Water temperature, salinity, oxygen, fluorescence, turbidity taken by CTD from the research vessel Norseman II in Bering Strait and Southern Chukchi Sea from 2019-09-06 to 2019-09-15 (NCEI Accession 0210804)
https://www.ncei.noaa.gov/access/metadata/landing-page/bin/iso?id=gov.noaa.nodc:0210804
___________________________
[Strontium-90, strontium and calcium in various hydrobionts of the Sea of Okhotsk].
01 Jan 1970
https://europepmc.org/article/MED/5424063
___________________________
Bubbled lava from the floor of the Sea of Okhotsk
May 2014
A sample of bubbled lava raised from a submarine volcano in the Sea of
Okhotsk was analyzed by means of electron microscopy and the ICP-MS
technique. The outside of the sample is flecked with rounded micro- and
macrocavities, and the inner part is characterized by a liquation
structure. Along with this, the unstructured mass of the rock contains
globular particles of nearly the same diameters as the cavities. The
lava is close to andesites and volcanic ashes of Kamchatka Peninsula in
the macro- and microelemental composition but different in the somewhat
increased content of barium, strontium, lithium, niobium, tungsten,
uranium, and thorium. It is suggested that the cavities were formed
during the eruption of the submarine volcano owing to contact of the
boiling gas-saturated lava with seawater accompanied by the ejection of
ash, which was spread by marine currents over long distances.
https://ui.adsabs.harvard.edu/abs/2014DokES.456..579B/abstract
___________________________
Determination of Pu isotopes in sediment cores in the Sea of Okhotsk and the NW Pacific by sector field ICP-MS
December 2005
https://link.springer.com/article/10.1007/s10967-006-0011-2
___________________________
Evidence of change in the sea of okhotsk: Implications for the north pacific
21 Nov 2010
https://www.tandfonline.com/doi/abs/10.3137/ao.410104
___________________________
Gaseous elemental mercury (Hg(0)) in the surface air over the Sea of Japan, the Sea of Okhotsk and the Kuril-Kamchatka sector of the Pacific Ocean in August-September 2017
2019 Feb 27
https://pubmed.ncbi.nlm.nih.gov/30849628/
___________________________
Tritium and plutonium in waters from the Bering and Chukchi seas.
01 Dec 1999
https://europepmc.org/article/MED/10568546
___________________________
Fukushima contaminants found as far north as Alaska’s Bering Strait
March 29, 2019
https://www.arctictoday.com/fukushima-contaminants-found-as-far-north-as-alaskas-bering-strait/
___________________________
Evolution of marine sedimentation in the Bering Sea since the Pliocene
December 01, 2012
https://pubs.geoscienceworld.org/gsa/geosphere/article/8/6/1231/132585/Evolution-of-marine-sedimentation-in-the-Bering
___________________________
The Arctic Ocean Was Once Filled With Fresh Water, New Research Suggests
February 3, 2021
https://gizmodo.com/the-arctic-ocean-was-once-filled-with-fresh-water-new-1846188557
___________________________
An Arctic Mercury Meltdown
2012
https://www.harvardmagazine.com/2012/11/an-arctic-mercury-meltdown
___________________________
Porpoise detected with bird flu in Sweden first time
31 August, 2022
https://www.daily-sun.com/post/641434/Porpoise-detected-with-bird-flu-in-Sweden-first-time
___________________________
Four thousand years of atmospheric lead pollution in northern Europe: a summary from Swedish lake sediments
May 2001
https://link.springer.com/article/10.1023/A:1011186100081
___________________________
March 2, 2021
In 2009, Al Gore loosely cited researchers and said there was a “75% chance” the ice could be gone during at least some summer months within five to seven years.
He made similar statements multiple other times in the late 2000s.
https://www.politifact.com/factchecks/2021/mar/02/facebook-posts/fact-checking-claims-al-gore-said-all-arctic-ice-w/
___________________________
Clouding the forecast: Why so many climate models are wrong about rate of Arctic warming
May 20, 2025
The Arctic is one of the coldest places on Earth, but in recent decades, the region has been rapidly warming, at a rate three to four times faster than the global average. However, current climate models have been unable to account for this increased pace.
Now, two researchers from Kyushu University—graduate student Momoka Nakanishi, from the Interdisciplinary Graduate School of Engineering Sciences, and her advisor, Associate Professor Takuro Michibata, from the Research Institute for Applied Mechanics—have reported in a study, published in Ocean-Land-Atmosphere Research, that clouds may be to blame.
The most common clouds found in the Arctic are mixed-phase clouds, which contain both ice crystals and supercooled liquid water droplets. In the Arctic summer, when the sun shines around the clock, these clouds act like a parasol, reflecting sunlight back into space and providing a cooling effect.
But in the long, dark Arctic winter, when there's no sunlight to reflect, these clouds act more like a blanket, trapping heat radiated from Earth's surface and sending it back down to the Arctic's surface.
"However, how well these mixed-phase clouds trap heat depends on their ratio of ice to liquid," explains Nakanishi. "The more liquid water the clouds contain, the better they are at trapping heat. But many climate models have a large bias in representing this ratio, causing incorrect predictions."
In this study, Nakanishi and Michibata analyzed 30 climate models and compared them to satellite observations of clouds in the Arctic during winter over the last decade. They found that 21 of the 30 models significantly overestimated the fraction of ice to liquid in wintertime Arctic clouds.
"These ice-dominant models are not properly accounting for the present-day warming potential of the clouds during the winter," says Nakanishi. "That's why they cannot account for the rapid warming we are currently seeing."
However, every cloud has a silver lining. While climate models are underestimating the rate of global warming in the present day, they are overestimating the rate of global warming in the future.
The errors in future projections are due to a process called "cloud emissivity feedback." In a nutshell, as the Arctic warms, clouds shift from containing mostly ice to more liquid, which increases their ability to trap heat, further warming the Arctic and creating a positive feedback loop.
But importantly, this feedback loop has a time limit. Once clouds become so rich in liquid that they behave like blackbodies—fully absorbing and re-emitting heat—further warming has less effect.
However, because many climate models underestimate how much liquid is already present in today's clouds, they assume a larger shift still lies ahead. As a result, they overestimate how much extra heat-trapping will occur in the future, and predict the feedback effect will last longer than reality suggests.
Moving forward, the study's findings could be used to refine climate models so that they provide a more accurate representation of the ice-to-liquid ratio within clouds and better predictions of current and future rates of Arctic warming.
Since the Arctic's climate also plays a key role in shaping weather patterns further south, these findings could also lead to more accurate forecasts of extreme weather in mid-latitude regions.
"The biggest uncertainty in our forecasts is due to clouds," concludes Michibata. "Fixing these models is essential not just for the Arctic, but for understanding its impact on weather and climate change across the globe."
https://phys.org/news/2025-05-clouding-climate-wrong-arctic.html
___________________________
50 failed eco-pocalyptic predictions (Debated)
Nov 14, 2021
https://www.linkedin.com/pulse/50-failed-eco-pocalyptic-predictions-hashim-sheikh
___________________________
Many climate predictions do come true
One way to determine a model’s accuracy is to look at old models and see how well they withstood the test of time. A 2019 study in the journal Geophysical Research Letters showed that of 17 climate models published from 1970 to 2007, 10 closely matched the global average temperatures that occurred. That number increased to 14 after "accounting for differences between modeled and actual changes in atmospheric carbon dioxide and other factors that drive climate," according to a 2020 NASA article about the study. ..
___________________________
120 years of climate scares (Debated)
August 4, 2014
https://www.americanthinker.com/blog/2014/08/120_years_of_climate_scares.html#ixzz61lNpThFF
___________________________
International Climate Change Reports Are Dangerously Misleading, Says Eminent Scientist
21 August 2018
___________________________
Scientists Conclude Dire Climate Change Models Were Wrong, Now What?
February 6, 2022
AOC “New Green Deal” Stunningly Absurd: Far More Ridiculous Than Expected
Recall my February 7, 2019 post AOC “New Green Deal” Stunningly Absurd: Far More Ridiculous Than Expected
Rep. Alexandria Ocasio-Cortez (AOC) released her bill for a “Green New Deal”. It’s stunningly absurd.
AOC’s Green New Deal Pricetag of $51 to $93 Trillion
On February 25, 2019 I noted I compared AOC’s Green New Deal Pricetag of $51 to $93 Trillion vs. Cost of Doing Nothing
William Nordhaus, a co-recipient of the 2018 Nobel Prize in economics, compared AOC’s Green New Deal with the cost of doing nothing and various alternatives.
Nordhaus’s model—at least as of its 2007 calibration—estimated that such a policy goal would make humanity $14 trillion poorer compared to doing nothing at all about climate change.
2007 is admittedly way out of date, yet the models then were on the dire side.
AOC Says World Will End in 12 Years
On January 22, 2019 I noted Ocasio-Cortez Says World Will End in 12 Years: Here’s What to Do About It
AOC now says her comment was out of context, but play the video and you will see that her comments clearly weren’t.
Perhaps it was hyperbole, but extreme fearmongering of this kind will do nothing but raise eyebrows.
https://mishtalk.com/economics/scientists-conclude-dire-climate-change-models-were-wrong-now-what/
___________________________
A Brief History of Fantastically Wrong Climate Change Predictions
___________________________
4 Catastrophic Climate Predictions That Never Came True
September 5, 2019
https://fee.org/articles/4-catastrophic-climate-predictions-that-never-came-true/
___________________________
The 2024 state of the climate report: Perilous times on planet Earth (Debated)
08 October 2024
https://academic.oup.com/bioscience/article/74/12/812/7808595?login=false
___________________________
18 Spectacularly Wrong Predictions Made Around the Time of First Earth Day in 1970, Expect More This Year (Debated)
April 21, 2018
___________________________
‘Climategate’ (Controversial)
Hacked e-mails show climate scientists in a bad light but don't change scientific consensus on global warming.
___________________________
Viral Tweet Misrepresents NOAA Report on Rising Global Temperature (Controversial)
Posted on | Corrected on January 27, 2023
___________________________
Global Climate Report Annual 2021 (NOAA Report)
2021
https://www.ncei.noaa.gov/access/monitoring/monthly-report/global/202113
___________________________
Wrong Again: 50 Years of Failed Eco-pocalyptic Predictions
___________________________
Do scientists usually get it wrong when it comes to climate change?
January 13, 2025
___________________________
Former Obama Scientist Dr. Steve Koonin rebuts attack from 12 climate activist academics: Cites Einstein: ‘If I were wrong, it wouldn’t take a dozen scientists to disprove me – one would be sufficient’
June 3, 2021
___________________________
Trump administration dismisses nearly 400 scientists working on congressionally mandated national climate report
April 29, 2025
https://www.cbsnews.com/news/national-climate-assessment-report-scientists-fired/
___________________________
Criticism of the IPCC Fourth Assessment Report
https://en.wikipedia.org/wiki/Criticism_of_the_IPCC_Fourth_Assessment_Report
___________________________
What they Captured in a River Shocked the Whole World
Aug 1, 2022
16:25 - Techa River
https://www.youtube.com/watch?v=YBWyw7VVXsk
___________________________
Black Gold: The War For Soviet Oil | War Factories | Timeline
Aug 28, 2021
The
story of the discovery and exploitation of the Baku Oilfields in the
Russian Caucasus, which forced Stalin and Hitler to face-off in the
battle of Stalingrad.
https://www.youtube.com/watch?v=Ey_90U9i8ms
___________________________
These Bizarre Soviet Documents Reveal The Most Horrifying Secrets
Jul 29, 2022
No
one knows, probably not even the Russian government, exactly how many
people perished as a result of the many purges, labor camps, and other
punishments that occurred during the life of the Soviet Union, which
existed from 1917 - 1991. Reliable estimates have put the number over
ten million, and perhaps as high as twenty million or more. Most, but
certainly not all of those deaths occurred during the reign of Josef
Stalin, a genius in the exercise of raw power, but otherwise, a paranoid
megalomaniac with few equals in history. In today's video, we are going
to tell you about some of the other terrible events that occurred
during the life of the Soviet Union, or USSR.
In the mid-1980s,
Mikhail Gorbachev, a communist reformer, became Premier of the Soviet
Union. When he came to power, he understood two things almost
immediately: that the Soviet economy needed to be restructured and
people allowed more economic freedom, and that many people were
dissatisfied with life in the USSR, but did not dare speak of it for
fear of government repression. Knowing that this fear and
dissatisfaction was liable, sooner rather than later, to spill over into
public discontent, protest, and perhaps more, Gorbachev instituted the
policy of “glasnost”, or “openness”, which allowed people more freedom
to speak their minds.
This also held true, to a certain extent,
for members of the government and its many organs. The immediate spur to
“glasnost” was the awful events that took place at the Chernobyl
nuclear plant in Ukraine – then a part of the USSR. Attempting to keep
the radiation leak secret from their own people and the world, the
Soviets finally had to admit they had a very large problem at Chernobyl,
and this was partly caused by people's fear to speak up about problems
there and in the aftermath of the nuclear disaster.
From Soviet
diplomats being kept hostage to Stalin's psychiatric hospitals, to the
Chernobyl mess up! We've it all covered in our video!
https://www.youtube.com/watch?v=5a1VuaYubDc
___________________________
The Dark History Of The Soviet War Machine | War Factories | Timeline
Aug 21, 2021
https://www.youtube.com/watch?v=fcpUdhj-9A8
___________________________
Russia's most FEARED criminal (*MATURE AUDIENCES ONLY*)
Mar 12, 2022
https://www.youtube.com/watch?v=8NaHaRS0_DA
___________________________
The Breakup of the Soviet Union Explained
May 1, 2020
https://www.youtube.com/watch?v=t2GmtBCVHzY
___________________________
One Hundred Years of Communist Experiments
2021
https://www.jstor.org/stable/10.7829/j.ctv1c3pd9d
___________________________
Operation Ivy Bells
Operation Ivy Bells was a 1971 joint United States Navy, Central Intelligence Agency (CIA), and National Security Agency (NSA) mission whose objective was to place wire taps on Soviet underwater communication lines during the Cold War.[1]
The operation was discovered by the Soviet Union in 1980, when NSA analyst Ronald Pelton defected and revealed the existence of the program.
https://en.wikipedia.org/wiki/Operation_Ivy_Bells
___________________________
Project Coldfeet
Project Coldfeet was a 1962 Central Intelligence Agency (CIA) operation to extract intelligence from an abandoned Soviet Arctic drifting ice station. Due to the nature of its abandonment as the result of unstable ice, the retrieval of the operatives used the Fulton surface-to-air recovery system.
https://en.wikipedia.org/wiki/Project_Coldfeet
___________________________
A Good Pick-me-Up: Robert Fulton's Skyhook and Operation Coldfeet
___________________________
How the US raided a Soviet arctic base in the Cold War
Oct 30, 2020
https://www.wearethemighty.com/mighty-history/cia-project-coldfeet-soviet-base/
___________________________
How the CIA went on the hunt for Soviet drifting ice stations in the Arctic
June 08 2021
https://www.rbth.com/history/333870-how-cia-went-on-hunt
___________________________
Drifting ice station
A drifting ice station is a temporary or semi-permanent facility built on an ice floe. During the Cold War the Soviet Union and the United States maintained a number of stations in the Arctic Ocean on floes such as Fletcher's Ice Island for research and espionage, the latter of which were often little more than quickly constructed shacks. Extracting personnel from these stations proved difficult and in the case of the United States, employed early versions of the Fulton surface-to-air recovery system.
https://en.wikipedia.org/wiki/Drifting_ice_station
___________________________
The Real Battle Royale - Nazino Island Tragedy (1933)
Nov 2, 2021
On
May 18th 1933, on the direct orders of Stalin himself, 5000 men and
women arrived at Nazino, a small isolated island on the River Orb, deep
in the remote and barren wilderness of Western Siberia. Within a matter
of weeks, 4000 of them would either just die from exposure, disappear,
drown or be eaten. This was the real life Battle Royale.
https://www.youtube.com/watch?v=imwsyae00p8
___________________________
Siberia's Incredible 1,300 Year Old Mystery Fortress
May 5, 2022
https://www.youtube.com/watch?v=SAczNdysnsc
___________________________
Soviet Secret Cities: Entire Cities Hidden from The World
Aug 5, 2022
https://www.youtube.com/watch?v=AyYBcMv6614
___________________________
Activation of old carbon by erosion of coastal and subsea permafrost in Arctic Siberia
29 August 2012
https://www.nature.com/articles/nature11392
___________________________
Metal concentrations in Kandalaksha Bay, White Sea (Russia) following the spring snowmelt
2006
https://www.academia.edu/17460188/Metal_concentrations_in_Kandalaksha_Bay_White_Sea_Russia_following_the_spring_snowmelt
___________________________
Russia: A small town clings to its Soviet past | DW Documentary
Mar 29, 2022
https://www.youtube.com/watch?v=48DaLYiO-yk
___________________________
Sons of Russia: The people fighting Putin's war in Ukraine | Full Episode | SBS Dateline
May 10, 2022
https://www.youtube.com/watch?v=7dYXYI8PdCE
___________________________
Generation Putin | DW Documentary
Aug 23, 2020
https://www.youtube.com/watch?v=lAjruwb-yms
___________________________
Why the Soviet Computer Failed
Jul 7, 2022
https://www.youtube.com/watch?v=dnHdqPBrtH8
___________________________
These Places Shouldn't Exist on Earth But They Damn Well DO
Sep 14, 2020
7:20 - Lake Karachay
https://www.youtube.com/watch?v=wmN70BdOycc
___________________________
These Places Shouldn’t Exist On Earth But They Damn Well DO! - Part 2
Jul 19, 2021
18:50 - Desert Boat Graveyard (Myunak, Uzbekistan)
https://www.youtube.com/watch?v=7v7HRlvdgrQ
___________________________
Strange Places On Earth That Seem Scientifically Impossible
Aug 20, 2022
14:40 - Patomskiy Crater, Siberia
https://www.youtube.com/watch?v=4PAuT9nqO3c
___________________________
Russia Funneled Cash to Anti-Fossil Fuel Climate Extremists: 2018 Report
March 09, 2022
https://townhall.com/tipsheet/spencerbrown/2022/03/09/russias-propaganda-war-on-fossil-fuels-n2604243
___________________________
Russia's Hephaestus mud volcano erupts chucking muck hundreds of meters (VIDEO)
25 Feb 2018
https://www.sott.net/article/378402-Russias-Hephaestus-mud-volcano-erupts-chucking-muck-hundreds-of-meters-VIDEO
___________________________
Submarine landslides along the Siberian termination of the Lomonosov Ridge, Arctic Ocean
2021
https://www.sciencedirect.com/science/article/pii/S0169555X21000878
___________________________
Why Does Russia Own This Old Piece of Germany?
Jun 16, 2022
https://www.youtube.com/watch?v=b2f9Zf-MDtU
___________________________
Marine Benthic Algae of the Russian Coasts of the Bering Sea (from Ozernoi Gulf to Dezhnev Bay, including Karaginskii Island)
2002
https://ucjeps.berkeley.edu/constancea/83/selivanova/Selivanova.html
___________________________
Siberian Wildfires Doubly Dangerous to Distracted Russia
May 21, 2022
https://www.yourearth.net/siberian-wildfires-doubly-dangerous-to-distracted-russia/
___________________________
The Mystery Of The Giant Object Underneath The Baltic Sea | The Mystery Beneath | Progress
Jun 12, 2022
https://www.youtube.com/watch?v=E8eLaxgeTgY
___________________________
Separating individual contributions of major Siberian rivers in the Transpolar Drift of the Arctic Ocean
15 April 2021
https://www.nature.com/articles/s41598-021-86948-y
___________________________
Leonid Rogozov, The Soviet Doctor Who Performed Emergency Surgery On Himself
February 23, 2016
https://allthatsinteresting.com/leonid-rogozov
___________________________
Improved
Pleistocene sediment stratigraphy and paleoenvironmental implications
for the western Arctic Ocean off the East Siberian and Chukchi margins
05 July 2018
https://link.springer.com/article/10.1007/s41063-018-0057-8
___________________________
15 Unexplored Corners of the Earth
May 15, 2015
3. Kamchatka, Russia
9. Sakha Republic, Russia
https://www.mentalfloss.com/article/63902/15-unexplored-corners-earth
___________________________
Predural Depression Structures in the Arctic Urals Magnetic Field
02 February 2019
https://link.springer.com/chapter/10.1007/978-3-319-97670-9_45
___________________________
Arctic sea ice melt season is now underway, but not as strong as in recent years, except in the Siberian region
09/06/2021
https://www.severe-weather.eu/global-weather/arctic-sea-ice-melt-season-2021-june-fa/
___________________________
2025 Winter maximum sea ice extent in Arctic smallest on record
___________________________
Hokkaido sea urchin and salmon decimated amid rare red tide
2021

Shells of dead sea urchins washed ashore in the Hokkaido town of Erimo.
___________________________
Algae that killed off marine life in Hokkaido from Russia
October 24, 2021
https://www.asahi.com/ajw/articles/14467200
___________________________
Harmful algal blooms and associated fisheries damage in East Asia: Current status and trends in China, Japan, Korea and Russia
2020
https://www.sciencedirect.com/science/article/abs/pii/S1568988320300676
___________________________
Scientist's Terrifying New Discovery Under Siberia That Changes Everything!
Jun 29, 2022
https://www.youtube.com/watch?v=a7DEgV8lVSA
___________________________
Neodymium concentrations and isotopes help disentangling Siberian river influences on the Arctic Ocean
5 May 2021
https://www.geotraces.org/neodymium-siberian-river-influences/
___________________________
Seismic tremor reveals active trans-crustal magmatic system beneath Kamchatka volcanoes
2 Feb 2022
https://www.science.org/doi/10.1126/sciadv.abj1571
___________________________
Response of methanogenic archaea to Late Pleistocene and Holocene climate changes in the Siberian Arctic
2013
https://orgprints.org/id/eprint/22247/
___________________________
Russian nuclear power plant afloat in Arctic causes anxiety across Bering Strait
August 9, 2019
https://www.ktoo.org/2019/08/09/russian-nuclear-power-plant-afloat-in-arctic-causes-anxiety-across-bering-strait/
___________________________
Siberia’s Permafrost Is Exploding. Is Alaska’s Next?
April 02, 2015
https://slate.com/technology/2015/04/exploding-methane-holes-in-siberia-linked-to-climate-change-is-alaska-next.html
___________________________
In the Russian Arctic, One of the Most Polluted Places on Earth
11.29.2021
Pollution from Norilsk Nickel has plagued a remote town for decades. Now the smelting company says it can go green.
Top:
Norilsk Nickel produces more sulfur dioxide than any other human
enterprise, on par with emissions from active volcanoes. The company has
started construction on a $4.1 billion project that it says will reduce
sulfur dioxide air pollution 90 percent by 2025. Visual: Norilsk
Nickel...
https://undark.org/2021/11/29/ecocide-norilsk/
___________________________
Radiation levels at Russian test site spiked up to 16 times above normal after explosion
August 13, 2019
https://www.foxnews.com/world/russia-radiation-nuclear-cruise-missile-accident-evacuation
___________________________
12 PEOPLE DEAD: Rocket Fuel? Poison? // Arylakh Tragedy – Soviet Mysteries
Sep 30, 2021
In
the Russian Far East lies the country’s largest region – Yakutia.
There, in 1977 twelve members of two simple farmer families started
dying one after another. To this day we know virtually nothing about the
actual causes of the incident, and each version of events is more
absurd than the other...
https://www.youtube.com/watch?v=Vik0vPpethU
___________________________
Radiation
levels near this Siberian village were 1,000 times above normal last
fall. But no one worried much (Khudaiberdynsk, Russia)
Feb. 16, 2018
For
decades the Techa River was used by the Mayak nuclear plant to dump
radioactive wastes. It has resulted in serious contamination of the
water and its banks.
https://www.latimes.com/world/europe/la-fg-russia-mayak-20180216-story.html
___________________________
Russia’s Arctic Development: Problems and Priorities
12 January 2018
https://geohistory.today/russia-arctic-development-power/
___________________________
Soil Erosion on the Yamal Peninsula (Russian Arctic) due to Gas Field Exploitation
September 1996
https://www.researchgate.net/publication/267392131_Soil_Erosion_on_the_Yamal_Peninsula_Russian_Arctic_due_to_Gas_Field_Exploitation
___________________________
Russia investigates new pollution at Arctic mining firm
June 30, 2020
Russian
officials are investigating mining company Nornickel for pumping waste
water from one of its processing plants into nearby Arctic countryside.
https://www.mining-technology.com/uncategorised/russia-investigates-new-pollution-at-arctic-mining-firm/
___________________________
Assessing
the level of chromosome aberrations in peripheral blood lymphocytes in
long-term resident children under conditions of high exposure to radon
and its decay products
2015
Abstract
In this study, the frequency and spectrum of chromosomal aberrations were analysed in samples of peripheral blood from 372 (mean age = 12.24±2.60 years old) long-term resident children in a boarding school (Tashtagol city, Kemerovo Region, Russian Federation) under conditions of high exposure to radon and its decay products. As a control group, we used blood samples from people living in Zarubino village (Kemerovo Region, Russian Federation). We discovered that the average frequencies of single and double fragments, chromosomal exchanges, total number of aberrations, chromatid type, chromosome type and all types of aberrations were significantly increased in the exposed group. This is evidence of considerable genotoxicity to children living under conditions of high exposure to radon compared to children living under ecological conditions without increased radon radiation.
https://academic.oup.com/mutage/article/30/5/677/1046201?login=false
___________________________
Isotope geochemical features of occurrence of low-radon waters «inskie springs» (South-Western Siberia)
2021
https://research.nsu.ru/en/publications/%D0%B8%D0%B7%D0%BE%D1%82%D0%BE%D0%BF%D0%BD%D0%BE-%D0%B3%D0%B5%D0%BE%D1%85%D0%B8%D0%BC%D0%B8%D1%87%D0%B5%D1%81%D0%BA%D0%B8%D0%B5-%D0%BE%D1%81%D0%BE%D0%B1%D0%B5%D0%BD%D0%BD%D0%BE%D1%81%D1%82%D0%B8-%D0%BF%D1%80%D0%BE%D1%8F%D0%B2%D0%BB%D0%B5%D0%BD%D0%B8%D1%8F-%D1%81%D0%BB%D0%B0%D0%B1%D0%BE%D1%80%D0%BE%D0%B4%D0%BE%D0%BD%D0%BE%D0%B2%D1%8B%D1%85-%D0%B2%D0%BE%D0%B4-
___________________________
Trace gas measurements along the Trans-Siberian railroad: The TROICA 5 expedition
25 July 2002
https://agupubs.onlinelibrary.wiley.com/doi/full/10.1029/2001JD000953
___________________________
[Estimation of doses of irradiation with radon-222 and its degradation products in adults of Tomsk]
2005
https://pubmed.ncbi.nlm.nih.gov/16276988/
___________________________
Permafrost Thaw and the Nitrogen Cycle
Climate
warming is causing permafrost to thaw. In and near Denali National Park
and Preserve, the temperature of permafrost (ground that is frozen for
two or more consecutive years) is just below freezing, so a small amount
of warming can have a large impact.
Where tundra ecosystems have
intact permafrost, vast quantities of N and other nutrients, including
carbon, are sequestered (stored) in the frozen organic matter beneath
the surface. But the nutrients in frozen soils are largely unavailable
to plants and soil microorganisms. In these tundra systems, the N cycle
is considered “closed” because there is very little “leakage” of N from
soils, either dissolved in liquid runoff or as emissions of N-containing
gases.
Has a warming climate influenced N cycling in the tundra
at Denali similarly to what has been documented in arctic regions? That
is, where permafrost has thawed, is there a change from a closed to an
“open” N cycle? And, if the N cycle is more open near Denali, which
forms of N are being leaked from the tundra ecosystem?
https://www.nps.gov/articles/denali-permafrost-thaw.htm
___________________________
Hydrogeochemistry and stable isotopes in radon-rich thermal waters of Belokurikha (Altai, Russia)
27 Jun 2022
https://research.nsu.ru/en/publications/hydrogeochemistry-and-stable-isotopes-in-radon-rich-thermal-water
___________________________
Lymphocytes with multiple chromosomal damages in a large cohort of West Siberia residents: Results of long-term monitoring
2015 Dec 18
https://pubmed.ncbi.nlm.nih.gov/26731314/
___________________________
Russian Kindergarten Inspection Uncovers High Levels of Radioactive Gas
9/3/19
https://www.newsweek.com/russia-radon-radioactive-siberia-1457397
___________________________
Radon-rich waters in Russia
08 August 2003
https://link.springer.com/article/10.1007/s00254-003-0857-3
___________________________
A five-year review of Russia’s efforts to address its radiation hazards
December 3, 2020
One
of Russia’s most pivotal programs for addressing radiation hazards
turned 5 years old last month, marking a time for scientists, industry
experts and members of the public to assess the progress that’s been
made in containing some of the country’s most acute areas of
contamination...
https://bellona.org/news/nuclear-issues/2020-12-a-five-year-review-of-russias-efforts-to-address-its-radiation-hazards
___________________________
Welcome to penal colony YaG 14/10. Now the home of one of Russia's richest men
24 Oct 2005
Billionaire gets six years in Siberia Border region
https://www.theguardian.com/world/2005/oct/25/russia.tomparfitt
___________________________
Hydrogeochemistry and stable isotopes in radon-rich thermal waters of Belokurikha (Altai, Russia)
June 2022
https://www.researchgate.net/publication/361577344_Hydrogeochemistry_and_stable_isotopes_in_radon-rich_thermal_waters_of_Belokurikha_Altai_Russia
___________________________
A Precarious Situation in the Uranium Mines of Siberia
2002
https://cpb-us-e1.wpmucdn.com/sites.dartmouth.edu/dist/0/2024/files/2008/04/uranium.pdf
___________________________
Scientists fear more lung cancer as radon is released from thawing permafrost
May 04, 2021
Scientists
from the Russian Academy of Sciences hypothesize that as the melting of
the permafrost becomes more prevalent, so will the incidence of lung
cancer.
https://thebarentsobserver.com/en/climate-crisis/2021/05/scientists-fear-more-lung-cancer-radon-released-thawing-permafrost
___________________________
[Radiation doses in children of the Tomsk region during inhalation of radon-222]
2004
https://pubmed.ncbi.nlm.nih.gov/15318619/
___________________________
Monitoring of radionuclides in the natural waters of Novosibirsk, Russia
2021
https://www.sciencedirect.com/science/article/abs/pii/S2352801X21001314
___________________________
Estimation of nocturnal222Rn soil fluxes over Russia from TROICA measurements
2013
https://acp.copernicus.org/articles/13/11695/2013/acp-13-11695-2013.pdf
___________________________
Hydrogeology and hydrogeochemistry of the Zaeltsovsko‐Mochishchensky zone of radon waters in the southern West Siberia
1 Jan 2018
https://research.nsu.ru/en/publications/hydrogeology-and-hydrogeochemistry-of-the-zaeltsovskomochishchens
___________________________
THE
STUDY OF DISSOLVED HELIUM AND RADON CONCENTRATIONS IN GROUNDWATERS OF
SOUTHERN PRIBAIKALIE IN CONNECTION WITH SEISMIC PROCESSES
(Mar 2020)
https://doaj.org/article/4817429cf36843a7a48f10e348f2b952
___________________________
Primordial Helium Isotope is Leaking Out of Earth’s Metallic Core: Study
Mar 29, 2022
https://www.sci.news/othersciences/geophysics/earths-core-helium-3-10661.html
___________________________
How Permafrost Thaw Puts the Russian Arctic at Risk
2021
https://theglobalobservatory.org/2021/11/how-permafrost-thaw-puts-the-russian-arctic-at-risk/
___________________________
Hydrogeochemistry and stable isotopes in radon-rich thermal waters of Belokurikha (Altai, Russia)
2022
https://pubmed.ncbi.nlm.nih.gov/35761131/
___________________________
The Transpolar Drift conveys methane from the Siberian Shelf to the central Arctic Ocean
14 March 2018
https://www.nature.com/articles/s41598-018-22801-z
___________________________
Hydrogeochemistry and stable isotopes in radon-rich thermal waters of Belokurikha (Altai, Russia)
27 June 2022
https://link.springer.com/article/10.1007/s11356-022-21640-w
___________________________
A multimethod dating study of ancient permafrost, Batagay megaslump, east Siberia
15 June 2021
https://www.cambridge.org/core/journals/quaternary-research/article/multimethod-dating-study-of-ancient-permafrost-batagay-megaslump-east-siberia/A9EF8CD9E70A048C45ECF590A49D892D
___________________________
Warmth Pouring Out of Siberia Sends Arctic Sea Ice Plummeting to Second Lowest Extent on Record
Sep 21, 2020
https://www.discovermagazine.com/environment/warmth-pouring-out-of-siberia-sends-arctic-sea-ice-plummeting-to-second
___________________________
Hydrogeology and hydrogeochemistry of the «Kamenskoe» field of radon-rich waters (Novosibirsk)
2021
https://research.nsu.ru/en/publications/%D0%B3%D0%B8%D0%B4%D1%80%D0%BE%D0%B3%D0%B5%D0%BE%D0%BB%D0%BE%D0%B3%D0%B8%D1%8F-%D0%B8-%D0%B3%D0%B8%D0%B4%D1%80%D0%BE%D0%B3%D0%B5%D0%BE%D1%85%D0%B8%D0%BC%D0%B8%D1%8F-%D0%BC%D0%B5%D1%81%D1%82%D0%BE%D1%80%D0%BE%D0%B6%D0%B4%D0%B5%D0%BD%D0%B8%D1%8F-%D1%80%D0%B0%D0%B4%D0%BE%D0%BD%D0%BE%D0%B2%D1%8B%D1%85-%D0%B2%D0%BE%D0%B4-%D0%BA%D0%B0%D0%BC%D0%B5%D0%BD%D1%81%D0%BA
___________________________
Hydrogeochemistry and stable isotopes in radon-rich thermal waters of Belokurikha (Altai, Russia)
27 Jun 2022
https://research.nsu.ru/en/publications/hydrogeochemistry-and-stable-isotopes-in-radon-rich-thermal-water/fingerprints/?sortBy=alphabetically
___________________________
Radiological Materials in Russia
Jun 30, 2004
https://www.nti.org/analysis/articles/radiological-materials-russia/
___________________________
Radon concentration in groundwater sources of the Baikal region (East Siberia, Russia)
2019
https://www.sciencedirect.com/science/article/abs/pii/S0883292719302513
___________________________
Estimation of nocturnal 222Rn soil fluxes over Russia from TROICA measurements
June 2013
https://www.researchgate.net/publication/258738964_Estimation_of_nocturnal_222Rn_soil_fluxes_over_Russia_from_TROICA_measurements
___________________________
Shocking new theory of the Dyatlov Pass Incident - the creepiest case in Russian history!
Nov 26 2018
https://www.rbth.com/history/329574-dyatlov-pass-russia-alien-conspiracy
Fifty-nine
years ago in the Urals, a team of 9 ascended ‘the mountain of the
dead.’ Only one came down. The chilling details and inexplicable
circumstances of their disappearance have become the stuff of nightmares
and Hollywood fiction. Now, one Russian blogger believes he’s closer to
the truth than we have ever been before.
___________________________
Dyatlov Pass incident
https://en.wikipedia.org/wiki/Dyatlov_Pass_incident
___________________________
An Unsolved Mystery Since 1959: The Dyatlov Pass Incident
https://www.youtube.com/watch?v=eHn9CjvnCvk
( http://www.discovery.com/tv-shows/russian-yeti/videos/an-unsolved-mystery-since-1959-the-dyatlov-pass-incident/ )
___________________________
ICY HORROR: Mystery of Russia’s ‘Dead Mountain’ where 9 hikers found ‘naked, missing eyes and tongues’ may have been SOLVED
29 Jan 2021
https://www.thesun.co.uk/tech/13889111/dyatlov-pass-incident-mystery-solved/
___________________________
Has an Old Soviet Mystery at Last Been Solved?
May 10, 2021
The strange fate of a group of skiers in the Ural Mountains has generated endless speculation.
https://www.newyorker.com/magazine/2021/05/17/has-an-old-soviet-mystery-at-last-been-solved
___________________________
Yet Another Dyatlov Pass: RUSSIA’S DEADLY ROUTE 30
Jun 1, 2022
https://www.youtube.com/watch?v=ihnMAhTOSbE
___________________________
WORSE THAN DYATLOV PASS: The Korovina group incident // One of them survived and told THE TRUTH
Mar 16, 2021
https://www.youtube.com/watch?v=PuZ9y7oyQRk
___________________________
KOLA PENINSULA TRAGEDY: Chivruay Pass Incident // Yet Another Dyatlov Pass
Jul 21, 2021
https://www.youtube.com/watch?v=cDsMIo0MQg4
___________________________
Ancient Cauldrons in Siberian Valley of Death Still Unsolved, The
Metallic Swaps of Siberia (What is under the Arctic?) - Rock Lake
Pyramid - Bimini Road - Solomon's Temple Investigation Marathon 263
https://archive.org/details/solomonstemple263
___________________________
The History and Mystery of Russia’s ‘Valley of Death’
https://getpocket.com/explore/item/the-history-and-mystery-of-russia-s-valley-of-death

The "Valley of Death" in Kamchatka.
A volcanic gorge in remote Kamchatka has given up some of its secrets—but not all of them.
https://getpocket.com/explore/item/the-history-and-mystery-of-russia-s-valley-of-death
The
Kamchatka Peninsula, in Russia’s Far East, is a volcanic winter
wonderland. Snow blankets a chain of eruptive mountains here that shower
the land with molten fireworks. It is as beautiful as it is biodiverse,
with a myriad of aquatic, aerial, and terrestrial species.
But there’s lethal trouble in this chilly paradise. In one of its smaller valleys, animals wander in but not out.
When
the snow melts, various critters, from hares to birds, appear in search
of food and water. Many die soon thereafter. Predatory scavengers such
as wolverines spot an easy dinner; they slink or swoop into the
valley—only to die themselves. From lynxes to foxes, eagles to bears,
this 1.2-mile-long trough has claimed innumerable victims.
But
the killer here is a phantom. The dead, whose corpses are naturally
refrigerated and preserved, show no traces of external injuries or
diseases that would be responsible for their expirations.
Vladimir
Leonov, a volcanologist at Russia’s Institute of Volcanology and
Seismology (IVS) who’s recognized by his colleagues as the site’s
discoverer, identified the cause of death when he first came across the
site, in 1975: It’s the result of a volcanic phenomenon—a common gas
that nearly everyone is familiar with.
But while the forensic
science has long been clear, unconfirmed stories about the place still
abound. Some claim, for instance, that animal corpses are regularly
removed from the valley—though no one can say by whom. Another mystery
dates back to the mid-1970s. Viktor Deryagin, a student of Leonov’s who
helped his instructor discover the valley, says that Soviet military
officials, alerted to the valley’s existence, arrived in a helicopter,
took some strange samples, and quickly departed. What did they gather
and conclude?
Welcome to the Valley of Death, a site that remains
as darkly enchanting—and as lethal—as it was when it was discovered 44
years ago.
Fewer than 350,000 people live on the Kamchatka
Peninsula. Large portions of the region lack roads. If they existed, you
could drive for an entire day and still be walled in by volcanoes. Many
of the volcanoes here, like Tolbachik and Sheveluch, are hyperactive,
and frequently limn the land in fresh coats of lava paint. Most of
Kamchatka is an icy volcanic wilderness—a UNESCO World Heritage Site
whose geological curiosities and extraordinary aesthetics compel
scientific visitors from around the world.
Janine Krippner, a
volcanologist at the Smithsonian Institution’s Global Volcanism Program,
recalls lying on a cooled Kamchatkan lava flow, hearing nothing but the
small bursts of volcanic gas sneaking out of the ground as birds flew
overhead. During her most recent visit, she stood near a freshly chilled
lava flow that was still 176° Fahrenheit—hot enough to toast her
necklace from several feet away.
“There’s just no place like it,” she says.
With
persistence and permission, many places on the peninsula can be
accessed. That includes the Kronotsky State Natural Biosphere Reserve,
which contains the relatively youthful (4,800 years old) Kikhpinych
volcano. At its feet is the lichen-covered Valley of Geysers, whose
bubbling pits shoot pillars of steam hundreds of feet into the azure
sky. Discovered in 1941 by geologist Tatyana Ustinova and a scientific
observer named Anisifor Krupenin, it remains a site of scientific
intrigue that is also open to tourists.
But the Valley of Death—a
comparatively quiet and diminutive crevasse, littered with the frozen
remains of animals and located near an upper sliver of the Geyzernaya
river within the reserve—is one place that is strictly off-limits.
Leonov
died in 2016, at age 66, but his son, Andrey Leonov—a researcher at the
S.I. Vavilov Institute for the History of Science and Technology—is
well versed in his father’s adventures. So is his father’s one-time
student Deryagin. Deryagin left academia long ago, worked in
construction, and is now retired. After Andrey tracked him down on
Russian social media, Deryagin recounted previously untold details about
his scientific adventure with Leonov four decades ago. Together, both
men tell an extraordinary tale of the site’s discovery.
Vladimir
Leonov and Deryagin first visited and documented the valley on July 27,
1975. (There is, however, some dispute on the matter. Officials at the
reserve acknowledge Leonov’s role in the discovery, but suggest that it
was independently found by a man named Vladimir Kalyaev, the chief
ranger at the time. Andrey Leonov insists that his father—a modest man
more interested in scientific discovery than quibbles about
credit—reached the valley, with Deryagin, four days before Kalyaev
arrived.)
Prior to that date, a number of people—from employees
of the reserve to scientists to tourists—had passed along a trail just
1,000 feet from the ravine. Some had seen collections of dead critters
in the valley from time to time, but made no special note of it.
The
animal deaths in 1975, though, were hard to ignore: Heavy snowfall had
created pits over curious holes in the ground, and a plethora of
animals—including five dead bears in one small area—appeared to have
died in or around them.
Deryagin says that in Soviet times,
geologists were instructed to immediately inform authorities about the
mass death of people or animals, using a special radio channel. On July
27, Leonov did just that: He walked to the nearby Valley of Geysers,
found a radio box, and called in his report.
The next day,
Deryagin says, a military helicopter turned up, carrying a major, two
young women (likely laboratory assistants), and a man (perhaps a
biologist) who took copious notes . They performed a hasty autopsy on
the dead bears, took samples of their flesh and teeth, then flew away.
Leonov
and Deryagin performed their own scientific analyses, gathering as much
data on the strange location as they could. Writing in the Kamchatskaya
Pravda newspaper in the spring of 1976, Leonov described the discovery,
coining the term “Valley of Death”—an homage to several lethal valleys
around the world, including a volcanic gorge in Arizona and parts of
certain volcanic folds in Indonesia. In this segment of Kamchatka,
Leonov wrote, borrowing a passage from another writer, “nature seems to
have pronounced its curse.” All life is snuffed out in a place that
“breathes extermination and devastation.”
Other researchers
quickly corroborated his findings. A 1983 paper—whose primary author,
Gennady Karpov, is now the deputy director for science at the IVS—says
that over a five-year period, rangers from the reserve found the corpses
of 13 bears, three wolverines, nine foxes, 86 mice, 19 ravens, more
than 40 small birds, a hare, and an eagle.
Like Leonov and
Deryagin, a well-known bear researcher named Vitaly Nikolayenko visited
the valley in 1975. Before one of the peninsula’s brown bears mauled him
to death, in 2003, he published a book that chronicled his scientific
work, including the research he’d performed in the valley. Notably, he
wrote, many bears here seemed to have been in good health before they
died. But the footsteps of one large male indicated that it had been
very disoriented before it fell over and suddenly expired.
During
one of his visits, Nikolayenko describes experiencing painful cramps in
his lungs and acute dizziness, which resolved only after he’d clambered
atop a windswept crest. Other visitors have reported similarly woozy
sensations here, and accounts by reserve officials note headaches and
weakness. (Reports of human deaths here remain unconfirmed, though some
suggest that people have perished in the valley).
Nikolayenko
also recorded the deaths of 20 foxes, dozens of ravens, and 100 white
partridges. The hares and adult birds, he wrote, seemed to have died in
springtime and early summer, when the valley’s grasslands were freshly
thawed.
Volcanologists and zoologists concluded that the animals
that died in the valley usually died quickly, and only on the ground.
Their hearts often lacked blood, but their lungs were engorged with it.
They’d
suffocated, in other words. And any humans who lingered too long in the
Valley of Death—a landscape filled with invisible volcanic gases,
either toxic or asphyxiating—probably would too.
(Leonov had
surmised that volcanic gases were the killers back in 1976. In the
Kamchatskaya Pravda article, he astutely compared the deaths to those
seen in volcanic realms elsewhere in the world, including Italy’s
“burning fields,” where fumaroles—jets of hot volcanic gas—can create
deadly mixtures. Those death pits that caught Leonov and Deryagin’s eyes
in 1975? The heavy snowfall had probably walled in and concentrated the
life-stealing gases escaping from those fumaroles, leading to denser
die-offs).
A range of gases are potentially present in the valley
at any time, including sulfur dioxide and hydrogen sulfide—pungent
effusions that can damage respiratory systems. Some doses can be lethal,
but a human would need to be exposed to a high quantity of them for a
long time, says Helen Robinson, a researcher of geothermal systems at
the University of Glasgow.
It’s far more likely that the speedy
animal deaths in Kamchatka are due to carbon dioxide, a common volcanic
gas that is both invisible and odorless. If there is enough of it,
Robinson says, death can occur in a matter of minutes. (A grim example
of this occurred in 1986 at Lake Nyos in Cameroon, where an uprush of
carbon dioxide from the volcanic lake killed 1,746 people and 3,500
livestock overnight).
Yuri Taran, a volcanologist at the National
Autonomous University of Mexico who has studied the Kamchatka region,
says that specific outflows of the valley’s gases have not been
officially reported. But given that the distinctly eggy smell of
hydrogen sulfide is largely absent, carbon dioxide seems the likely
culprit.
To Alexey Kiryukhin, a volcanologist at the IVS, the
science is actually pretty simple. Carbon dioxide is denser than air;
when it emerges from the ground, it pools in the valley’s dips. Small
animals, attracted by the available vegetation in the warmer months,
breathe it in and asphyxiate. So do the scavengers they attract.
But
what happens to all those dead animals? According to a few tourism
sites, scientists and volunteers regularly take away the corpses in
order to spare rare animals higher up on the food chain from a grisly
fate.
___________________________
12 PEOPLE DEAD: Rocket Fuel? Poison? // Arylakh Tragedy – Soviet Mysteries
Sep 30, 2021
In
the Russian Far East lies the country’s largest region – Yakutia.
There, in 1977 twelve members of two simple farmer families started
dying one after another. To this day we know virtually nothing about the
actual causes of the incident, and each version of events is more
absurd than the other...
https://www.youtube.com/watch?v=Vik0vPpethU
___________________________
Russian Professor Suggests Rocket Mishap Caused Infamous Dyatlov Pass Incident
May 21, 2025
A Russian professor has offered a fresh take on the longstanding theory that the infamous Dyatlov Pass incident was caused by a rocket launch gone wrong. The 1959 case, wherein nine hikers perished under bizarre circumstances in the Ural Mountains, has been the subject of considerable speculation for decades. Among the countless competing theories for what occurred that night is that the group's tragic fate was brought about by a rocket mishap that was subsequently covered up by Soviet officials. The scenario was reportedly put forward again last week by a Russian professor who was nearly a member of the doomed party himself.
A friend of group leader Igor Dyatlov, Petr Bartolomey was a proverbial late scratch on the 1959 trip and later became a Doctor of Technical Sciences at Russia's Ural Federal University. As one might imagine, his near-miss and personal connection to the case resulted in the professor taking a keen interest in determining what caused the terrible event. At a press conference last week, Bartolomey presented his case for the rocket theory often suggested by other researchers. The professor specifically argued that "the preservation of the group's footprints over a vast distance indicated "nitrogen-acid exposure" in the environment.
"This is the only correct scientific explanation for what happened," Bartolomey boldly declared. As for where this material may have come from, he pointed to a rocket that experienced an "emergency flight interruption" after being launched on the night of the incident from a Soviet military base approximately 1,000 miles away from what is now known as Dyatlov Pass. Bartolomey posited that the immediate presence of high-ranking government officials at the campsite following the discovery of the hikers' bodies was indicative of their knowledge of the true nature of the tragedy and the need to quickly cover it up.
___________________________
Devil's venom
Devil's venom was a nickname coined by Soviet rocket scientists for a hypergolic liquid rocket fuel composed of a dangerous combination of red fuming nitric acid (RFNA) and unsymmetrical dimethylhydrazine (UDMH).[1] Both propellants are extremely dangerous individually: nitric acid is highly corrosive and releases toxic nitrogen dioxide during reactions, or even simply while exposed to air in its highly concentrated "red fuming" form, typically used as rocket propellant. UDMH is both toxic and corrosive.[2]
Despite these dangers, the pairing has been useful in rocketry because, as a combination of fuel and oxidizer, it is hypergolic (i.e. it does not require an external ignition source), which allows rockets using this type of fuel to be simpler. Further, both components have high boiling points compared to other rocket fuels (such as liquid hydrogen) and oxidizers (such as liquid oxygen), allowing rockets to be stored ready for launch for long periods without the fuel or oxidizer boiling off and needing to be replenished.
https://en.wikipedia.org/wiki/Devil%27s_venom
___________________________
Nedelin catastrophe
https://en.wikipedia.org/wiki/Nedelin_catastrophe#23_October
The Nedelin catastrophe or Nedelin disaster, known in Russia as the Catastrophe at Baikonur Cosmodrome (Russian: Катастрофа на Байконуре, romanized: Katastrofa na Baikonure), was a launch pad accident that occurred on 24 October 1960 at the Baikonur Cosmodrome in Soviet Kazakhstan. As a prototype of the R-16 intercontinental ballistic missile was being prepared for a test flight, an explosion occurred when the second stage
engine ignited accidentally, killing an unknown number of military and
technical personnel working on the preparations. Despite the magnitude
of the disaster, information was suppressed for many years and the Soviet government did not acknowledge the event until 1989. With more than 54 recognized casualties, it is the deadliest disaster in space exploration history. The catastrophe is named for the Chief Marshal of Artillery Mitrofan Ivanovich Nedelin, who was the head of the R-16 development program and perished in the explosion.
Launch preparations
On 23 October 1960, the prototype R-16 intercontinental ballistic missile had been installed on launching pad 41 (Russian: стартовая позиция 41)
awaiting final tests before launch. The missile was over 30 metres
(98 ft) long, 3.0 metres (9.8 ft) in diameter and had a launch weight of
141 tons. The rocket was fueled with the hypergolic pair of UDMH as fuel and a saturated solution of N
2O
4 in nitric acid as the oxidizer—nicknamed "Devil's venom"—which
was used because of the high boiling temperatures and hence storability
of the fuel and oxidizer, despite being extremely corrosive and toxic.
These risks were accounted for in the safety requirements of the launch
procedures, but Nedelin's insistence on achieving a test launch ahead of
the 7 November 1960 anniversary of the Bolshevik Revolution resulted in extreme schedule pressure, in a context of substantial emerging engineering difficulties.[1][2] Ultimately pre-launch tests began to overlap with launch preparations.
Accident
A short circuit in the replaced main sequencer caused the second-stage engine to fire while being tested before launch. This detonated the first stage fuel tanks directly below, causing an explosion which destroyed the missile. Before seeking refuge, the camera operator remotely activated automatic cameras set around the launching pad that filmed the explosion in detail.
People near the rocket were instantly incinerated; those farther away were burned to death or poisoned by the toxic fuel component vapors. Andrei Sakharov described many details: as soon as the engine fired, most of the personnel there ran to the perimeter, but were trapped inside the security fence and then engulfed in the fireball of burning fuel. The explosion incinerated or asphyxiated Nedelin, a top aide, the USSR's top missile-guidance designer, and over 70 other officers and engineers. Still others died later of burns or poisoning.[3][2][4][1] Missile designer Mikhail Yangel survived only because he had left to smoke a cigarette behind a bunker a few hundred metres away, but nonetheless suffered burn injuries.[3][5]
Casualties
The exact death toll of the explosion is not known. The first Western reporting of the accident via the Italian Continentale News Agency in December 1960 said that 100 people were killed,[6] while The Guardian reported in 1965, citing information from spy Oleg Penkovsky who had passed information to the West, that as many as 300 had died.[7] The Soviet Union said only that a "significant number" had died when it first acknowledged the incident in a 1989 Ogoniok article,[8] but later in the year, the government put the number of dead at 54.[9] The most recent estimated death toll, released by Roscosmos on the 50th anniversary of the accident and originating with agency engineer Boris Chertok, was that 126 people had died, but the agency qualified the number by saying that the actual number could be anywhere from 60 to 150 dead.
___________________________
The Vaiņode Soviet Nuclear Base Disaster | Cave Diving Gone Wrong
2022
https://www.youtube.com/watch?v=iBQz1-9TXCs
___________________________
The radioactive trace on the Dyatlov Pass - two conflicting opinions
In fact, the issue with radioactivity is the most difficult one. Because there is no clear, 100% evidence of any possible option. The first thing to note is that radioactive contamination was actually found on only a few items of clothing.
Second. At that time, radioactive contamination in those places could only come from 3 sources: the accident at Mayak, tests on Novaya Zemlya, and exotic things like Rakitin’s version that someone was carrying a pure beta isotope. And it is almost impossible to prove that Rakitin is wrong. I went from the opposite - if the pollution is from one of the real sources (Mayak or Novaya Zemlya), then Rakitin’s version can not be considered.
Third. Levashov discovered only beta radiation. In fact, this is unlikely, since gamma is present almost always and everywhere (Well, except for Rakitin’s version). The bottom line is that there is a so-called sensitivity threshold of any device. Incl. and the detector used by Levashov. Taking into account the characteristics of the detector and the overall low activity of the samples (it is often said that the highest activity that Levashov discovered was comparable to the activity of a bunch of bananas. And this is true), Levashov was physically unable to determine the gamma radiation from the samples. It was below the sensitivity threshold of the device. In the case of Novaya Zemlya, the gamma/beta ratio is such that the device would "see" gamma. But in the case of Mayak, the gamma/beta ratio is much smaller. And the device does not see the gamma. Therefore, this is indirect evidence that the pollution comes from the Lighthouse...
https://dyatlovpass.com/radioctive-trace
___________________________
Lake Nyos disaster (Africa)
https://en.wikipedia.org/wiki/Lake_Nyos_disaster
On 21 August 1986, a limnic eruption at Lake Nyos in northwestern Cameroon killed 1,746 people and 3,500 livestock.[1]
The eruption triggered the sudden release of about 100,000–300,000 tons of carbon dioxide (CO2).[2][3] The gas cloud initially rose at nearly 100 kilometres per hour (62 mph; 28 m/s) and then, being heavier than air, descended onto nearby villages, suffocating people and livestock within 25 kilometres (16 mi) of the lake.[4][5]
A degassing system has since been installed at the lake, with the aim of reducing the concentration of CO2 in the waters and therefore the risk of further eruptions. Along with the Lake Monoun disaster two years earlier, it is one of only two recorded limnic eruptions in history.
Eruption and gas release
What triggered the catastrophic outgassing is not known.[7][8][9] Most geologists suspect a landslide, but some believe that a small volcanic eruption may have occurred on the bed of the lake.[10][11] A third possibility is that cool rainwater falling on one side of the lake triggered the overturn. Others still[who?] believe there was a small earthquake, but because witnesses did not report feeling any tremors on the morning of the disaster, this hypothesis is unlikely.[citation needed] The event resulted in the supersaturated deep water rapidly mixing with the upper layers of the lake, where the reduced pressure allowed the stored CO2 to effervesce out of solution.[12]
It is believed that about 1.2 cubic kilometres (4.2×10¹⁰ cu ft) of gas was released.[13] The normally blue waters of the lake turned a deep red after the outgassing, due to iron-rich water from the deep rising to the surface and being oxidised by the air. The level of the lake dropped by about a metre[14] and trees near the lake were knocked down.[15]
Scientists concluded from evidence that a 100 m (330 ft) column of water and foam formed at the surface of the lake, spawning a wave of at least 25 metres (82 ft) that swept the shore on one side.[16]
Since carbon dioxide is 1.5 times the density of air, the cloud hugged the ground and moved down the valleys, where there were various villages. The mass was about 50 metres (160 ft) thick, and travelled downward at 20–50 kilometres per hour (12–31 mph; 5.6–13.9 m/s). For roughly 23 kilometres (14 mi), the gas cloud was concentrated enough to suffocate many people in their sleep in the villages of Nyos, Kam, Cha, and Subum.[4] About 4,000 inhabitants fled the area, and many of these developed respiratory problems, lesions, and paralysis as a result of the gas cloud.[17]
It is a possibility that other volcanic gases were released along with the CO2, as some survivors reported a smell of gunpowder or rotten eggs, which indicates that sulfur dioxide and hydrogen sulfide were present at concentrations above their odour thresholds. However, CO2 was the only gas detected in samples of lake water, suggesting that this was the predominant gas released and as such the main cause of the incident.
Degassing
The scale of the disaster led to much study on how a recurrence could be prevented.[21] Several researchers proposed the installation of degassing columns from rafts in the middle of the lake.[22][23] The principle is to slowly vent the CO2 by lifting heavily saturated water from the bottom of the lake through a pipe, initially by using a pump, but only until the release of gas inside the pipe naturally lifts the column of effervescing water, making the process self-sustaining.[24]
Starting from 1995, feasibility studies were successfully conducted, and the first permanent degassing pipe was installed at the lake in 2001. Two additional pipes were installed in 2011.[24][25] In 2019 it was determined that the degassing had reached an essentially steady state and that a single one of the installed pipes would be able to self-sustain the degassing process into the future, indefinitely maintaining the CO2 at a safe level, without any need for external power.[26]
Similar danger suspected at Lake Kivu
Following the Lake Nyos disaster, scientists investigated other African lakes to see if a similar phenomenon could happen elsewhere. In 2005, Lake Kivu in the Democratic Republic of the Congo, 2,000 times larger than Lake Nyos, was also found to be supersaturated, and geologists found evidence that outgassing events around the lake happened about every thousand years.[27]
However, a study undertaken in 2018 and released in 2020 found flaws in the 2005 study, including a possible bias in the conversion of concentrations to partial pressures, to an overestimation of concentrations, or to a problem of calibration of sensors at high pressure. The 2020 study found that when these errors were accounted for, the risk of a gas eruption at Lake Kivu did not seem to be increasing over time.
___________________________
A suspected toxic spill in Russia's Far East has killed 95% of marine life on the seabed
October 7, 2020
A suspected toxic spill along a beach on Russia’s Kamchatka Peninsula has killed 95% of marine life on the surrounding seabed, local scientists have said, following a weeks-long campaign to investigate the mysterious incident.
Local surfers were the first to spot that something was wrong at Khalaktyr beach after about 20 people in a surf camp experienced severe retina burns and symptoms similar to food poisoning.
In early September, the water changed color to a greyish-yellow, with a thick milky foam on the surface, and a strong foul smell filled the air. A few days later, octopuses, seals and other sea creatures began to wash up on the beach...
It is still unclear what caused the contamination. Initial probes showed that levels of phenol, a substance often used as antiseptic or disinfectant, were 2.5 times higher than normal, and petroleum levels 3.6 times higher. Local media outlets have speculated about a possible oil tanker leak or military drills gone wrong, which the Defense Ministry denied.
“The investigators are checking all possible sources of pollution, including the territories of landfills adjacent to the Avachinsky Bay and the coastal strip of Khalaktyr where toxic chemicals are stored,” the Investigative Committee said in a statement.
The Russian branch of Greenpeace pointed to a nearby toxic waste dump as a possible source of the leak. Kamchatka officials revealed Tuesday that the perimeter at Kozelsky site, which stores over 100 tons of toxic substances, including pesticides, had been breached.
The Kamchatka governor insisted Wednesday that the area would be recultivated “no matter what.”
This is the latest in a string of ecological disasters Russia has seen in recent years, coming four months after 20,000 tons of fuel from a damaged tank poured into a nearby river in the Siberian city of Norilsk.
https://www.cnn.com/2020/10/07/asia/russia-kamchatka-toxic-marine-life-death-intl/index.html
___________________________
Arctic closure as a trigger for Atlantic overturning at the Eocene-Oligocene Transition
22 August 2019
https://www.nature.com/articles/s41467-019-11828-z
___________________________
High
resolution of dissolved and particulate barium distributions in the
Atlantic and Pacific Ocean reveal the importance of the margin sources
on the oceanic Ba budget
6 July 2022
https://www.geotraces.org/barium-atlantic-pacific-ocean-importance-margin-sources-ba-budget/
___________________________
Influence of brine formation on Arctic Ocean circulation over the past 15 million years
02 December 2007
https://www.nature.com/articles/ngeo.2007.5
___________________________
The Arctic: Critical Metals, Hydrogen and Wind Power for the Energy Transition
2019
https://www.ifri.org/sites/default/files/atoms/files/mered_arctic_metals_2019.pdf
___________________________
A Row Over Rare-Earth Deposits Could Bring Down Greenland's Government
April 6, 2021
https://www.npr.org/2021/04/06/984768012/a-row-over-rare-earth-deposits-could-bring-down-greenlands-government
___________________________
Greenland Minerals sitting on Rare Earths Sleeping Giant
2018
https://www.businessnews.com.au/article/Greenland-Minerals-sitting-on-rare-earths-sleeping-giant
___________________________
Public hearings on a controversial Greenland mine get underway
18 December 2020
https://www.arctictoday.com/public-hearings-on-a-controversial-greenland-mine-get-underway/
___________________________
Scientists find surprising evidence of rapid changes in the Arctic
January 3, 2018
https://www.sciencedaily.com/releases/2018/01/180103160202.htm
___________________________
Did a 1922 Article Warn of Oceans Warming?
July 1, 2013
https://www.snopes.com/fact-check/warm-welcome/
___________________________
Was all of Alaska covered by glaciers during the Pleistocene Ice Age?
No--most of interior Alaska, south of the Brooks Range and north of the
Alaska Range, was a non-glaciated grassland refuge habitat for a number
of plant and animal species during the maximum Pleistocene glaciation.
This ice-free corridor also provided one route for humans to move into
North America.
https://www.usgs.gov/faqs/was-all-alaska-covered-glaciers-during-pleistocene-ice-age
___________________________
Arctic hydrology during global warming at the Palaeocene/Eocene thermal maximum
2006
Abstract
The Palaeocene/Eocene thermal maximum represents a period of rapid, extreme global warming 55 million years ago, superimposed on an already warm world. This warming is associated with a severe shoaling of the ocean calcite compensation depth and a >2.5 per mil negative carbon isotope excursion in marine and soil carbonates. Together these observations indicate a massive release of 13C-depleted carbon and greenhouse-gas-induced warming. Recently, sediments were recovered from the central Arctic Ocean, providing the first opportunity to evaluate the environmental response at the North Pole at this time. Here we present stable hydrogen and carbon isotope measurements of terrestrial-plant- and aquatic-derived n-alkanes that record changes in hydrology, including surface water salinity and precipitation, and the global carbon cycle. Hydrogen isotope records are interpreted as documenting decreased rainout during moisture transport from lower latitudes and increased moisture delivery to the Arctic at the onset of the Palaeocene/Eocene thermal maximum, consistent with predictions of poleward storm track migrations during global warming. The terrestrial-plant carbon isotope excursion (about -4.5 to -6 per mil) is substantially larger than those of marine carbonates. Previously, this offset was explained by the physiological response of plants to increases in surface humidity. But this mechanism is not an effective explanation in this wet Arctic setting, leading us to hypothesize that the true magnitude of the excursion--and associated carbon input--was greater than originally surmised. Greater carbon release and strong hydrological cycle feedbacks may help explain the maintenance of this unprecedented warmth.
https://pubmed.ncbi.nlm.nih.gov/16906647/
___________________________
Vanishing ice: Alaska’s shrinking glaciers drive a new brand of tourism
June 2, 2019
https://www.adn.com/alaska-news/2019/06/02/vanishing-ice-alaskas-shrinking-glaciers-drive-a-new-brand-of-tourism/
___________________________
Matanuska Glacier
https://en.wikipedia.org/wiki/Matanuska_Glacier
___________________________
Matanuska Formation
https://en.wikipedia.org/wiki/Matanuska_Formation
___________________________
Seasonal variability in hydrologic-system response to intense rain events, Matanuska Glacier, Alaska, U.S.A.
14 September 2017
Abstract
Two rain events at Matanuska Glacier illustrate how subglacial drainage system development and snowpack conditions affect hydrologic response at the terminus. On 21 and 22 September 1995, over 56 mm of rain fell in the basin during a period usually characterized by much drier conditions. This event caused an 8-fold increase in discharge and a 47-fold increase in suspended-sediment concentration. Peak suspended-sediment concentration exceeded 20 kg m —3, suggesting rapid evacuation of stored sediment. While water discharge returned to its pre-storm level nine days after the rain ceased, suspended- sediment concentrations took about 20 days to return to pre-storm levels. These observations suggest that the storm influx late in the melt season probably forced subglacial water into a more distributed system. In addition, subglacially transported sediments were supplemented to an unknown degree by the influx of storm-eroded sediments off hillslopes and from tributary drainage basins.
A storm on 6 and 7 June 1997, dropped 28 mm of rain on the basin demonstrating the effects of meltwater retention in the snowpack and englacial and subglacial storage early in the melt season. Streamflow before the storm event was increasing gradually owing to warming temperatures; however, discharge during the storm and the following week increased only slightly. Suspended-sediment concentrations increased only a small amount, suggesting the drainage system was not yet well developed, and much of the run off occurred across the relatively clean surface of the glacier or through englacial channels.
___________________________
Arctic Current Flowed Under Deep Freeze of Last Ice Age, Study Says
May 29, 2013
During the last ice age, when thick ice covered the Arctic, many scientists assumed that the deep currents below that feed the North Atlantic Ocean and help drive global ocean currents slowed or even stopped. But in a new study in Nature, researchers show that the deep Arctic Ocean has been churning briskly for the last 35,000 years, through the chill of the last ice age and warmth of modern times, suggesting that at least one arm of the system of global ocean currents that move heat around the planet has behaved similarly under vastly different climates.
“The Arctic Ocean must have been flushed at approximately the same rate it is today regardless of how different things were at the surface,” said study co-author Jerry McManus, a geochemist at Columbia University’s Lamont-Doherty Earth Observatory.
Researchers reconstructed Arctic circulation through deep time by measuring radioactive trace elements buried in sediments on the Arctic seafloor. Uranium eroded from the continents and delivered to the ocean by rivers, decays into sister elements thorium and protactinium. Thorium and protactinium eventually attach to particles falling through the water and wind up in mud at the bottom. By comparing expected ratios of thorium and protactinium in those ocean sediments to observed amounts, the authors showed that protactinium was being swept out of the Arctic before it could settle to the ocean bottom. From the amount of missing protactinium, scientists can infer how quickly the overlying water must have been flushed at the time the sediments were accumulating.
“The water couldn’t have been stagnant, because we see the export of protactinium,” said the study’s lead author, Sharon Hoffmann, a geochemist at Lamont-Doherty.
The upper part of the modern Arctic Ocean is flushed by North Atlantic currents while the Arctic’s deep basins are flushed by salty currents formed during sea ice formation at the surface. “The study shows that both mechanisms must have been active from the height of glaciation until now,” said Robert Newton, an oceanographer at Lamont-Doherty who was not involved in the research. “There must have been significant melt-back of sea ice each summer even at the height of the last ice age to have sea ice formation on the shelves each year. This will be a surprise to many Arctic researchers who believe deep water formation shuts down during glaciations.”
The researchers analyzed sediment cores collected during the U.S.-Canada Arctic Ocean Section cruise in 1994, a major Arctic research expedition that involved several Lamont-Doherty scientists. In each location, the cores showed that protactinium has been lower than expected for at least the past 35,000 years. By sampling cores from a range of depths, including the bottom of the Arctic deep basins, the researchers show that even the deepest waters were being flushed out at about the same rate as in the modern Arctic.
The only deep exit from the Arctic is through Fram Strait, which divides Greenland and Norway’s Svalbard islands. The deep waters of the modern Arctic flow into the North Atlantic via the Nordic seas, contributing up to 40 percent of the water that becomes North Atlantic Deep Water—known as the “ocean’s lungs” for delivering oxygen and salt to the rest of world’s oceans.
One direction for future research is to find out where the missing Arctic protactinium of the past ended up. “It’s somewhere,” said McManus. “All the protactinium in the ocean is buried in ocean sediments. If it’s not buried in one place, it’s buried in another. Our evidence suggests it’s leaving the Arctic but we think it’s unlikely to get very far before being removed.”
Other authors are William Curry, president and director of Bermuda Institute of Ocean Sciences and emeritus scientist at Woods Hole Oceanographic Institution, and L. Susan Brown-Leger, a retired Woods Hole researcher.
https://www.earth.columbia.edu/articles/view/3094
___________________________
Global warming: Arctic lightning strikes up drastically in 2021
The North Pole saw 7,278 lightning strikes in 2021 & nearly double in the previous nine years combined
Lightning strikes have started occurring much more frequently in the Arctic as the region experiences unprecedented warming temperatures. Scientists at Vaisala, a Finnish environmental firm, found that in 2021, 91 per cent more lightning was detected at the highest latitudes of the planet, where the North Pole sits, than the previous year.
The North Pole saw 7,278 lightning strikes in 2021 — nearly double in the previous nine years combined.
Lightning in the Arctic has historically been a rare event, as they require a mixture of cold air, warm air and convective instability. Scientists found that the increased number of lightning strikes between 2010 and 2020 seemed to correlate with global temperature anomalies.
At most latitudes in the Arctic, lightning counts have remained consistent in the last 10 years, but are trending significantly higher north of 80 degrees north. In 2019, the furthest north lightning on record was detected Global Lightning Detection Network (by GLD360), just 52 km from the North Pole, said the 2021 Annual Lightning Report published by Vaisala.
The National Oceanic and Atmospheric Administration 2021 Arctic Report Card said October-December 2020 was the warmest Arctic autumn on record since 1900. The average surface air temperature over the Arctic during October 2020-September 2021 was the seventh warmest on record.
The Arctic continues to warm more than twice as fast as the rest of the globe.
A research paper published in the Geophysical Research Letters Lightning in the Arctic looked at global lightning location data from 2010-2020 to show that the number of strokes in the Arctic above 65 degrees north is increasing.
The increase in the fraction of strokes in the Arctic compared to total global strokes is well correlated with the global temperature anomaly.
Dozens of lightning strikes were detected within 300 nautical miles of the North Pole in August 2019. The lightning was detected by Vaisala’s GLD360 network.
Ryan Said, a scientist with Vaisala and the inventor of the GLD360 system, said between 2012 and 2017, there was no more than one single day each summer where lightning was seen within this range, and sometimes none was detected.
In those years, the most discharges recorded in that area in a single day was six.
Arctic lightning is rare and scientists use it as a key indicator of the climate crisis as it signals warming temperatures in the predominantly frozen region.
Chris Vagasky, Vaisala’s meteorologist and lightning applications manager, said:
Changes in the Arctic can mean changes in the weather at home. All weather is local, but what happens at your house depends on how the atmosphere is behaving elsewhere throughout the world.
He added that changes to conditions in the Arctic could cause more extreme cold outbreaks, more heatwaves or extreme changes in precipitation to Europe.
___________________________
Rate of Arctic warming faster than previously thought
07/11/2022
https://www.eenews.net/articles/rate-of-arctic-warming-faster-than-previously-thought/
___________________________
Arctic temperatures are increasing four times faster than global warming
2022
https://phys.org/news/2022-07-arctic-temperatures-faster-global.html
___________________________
Climate change in the Arctic
https://en.wikipedia.org/wiki/Climate_change_in_the_Arctic
___________________________
Climate change: Arctic warming linked to colder winters
2 September 2021
A new study shows that increases in extreme winter weather in parts of the US are linked to accelerated warming of the Arctic.
The scientists found that heating in the region ultimately disturbed the circular pattern of winds known as the polar vortex.
This allowed colder winter weather to flow down to the US, notably in the Texas cold wave in February.
The authors say that warming will see more cold winters in some locations.
https://www.bbc.com/news/science-environment-58425526
___________________________
The Arctic Report Card shows the continued decline of sea ice
Dec 22, 2021
https://www.weforum.org/agenda/2021/12/arctic-report-card-climate-change-ice-melting/
___________________________
The Arctic is having holes stabbed through it at an alarming rate
Feb 14, 2020
- Abrupt melting of the permafrost layer is leading to erosion, landslides and craters in the Arctic landscape.
- As the permafrost melts, greenhouse gases are released into the environment.
- Current climate change forecasts may underestimate the emissions from permafrost because they only take into account gradual thawing of the ice layer.
https://www.weforum.org/agenda/2020/02/permafrost-ice-melt-thaw-arctic-global-warming-carbon/
___________________________
Permafrost is warming at a global scale
2019
Abstract
Permafrost warming has the potential to amplify global climate change, because when frozen sediments thaw it unlocks soil organic carbon. Yet to date, no globally consistent assessment of permafrost temperature change has been compiled. Here we use a global data set of permafrost temperature time series from the Global Terrestrial Network for Permafrost to evaluate temperature change across permafrost regions for the period since the International Polar Year (2007-2009). During the reference decade between 2007 and 2016, ground temperature near the depth of zero annual amplitude in the continuous permafrost zone increased by 0.39 ± 0.15 °C. Over the same period, discontinuous permafrost warmed by 0.20 ± 0.10 °C. Permafrost in mountains warmed by 0.19 ± 0.05 °C and in Antarctica by 0.37 ± 0.10 °C. Globally, permafrost temperature increased by 0.29 ± 0.12 °C. The observed trend follows the Arctic amplification of air temperature increase in the Northern Hemisphere. In the discontinuous zone, however, ground warming occurred due to increased snow thickness while air temperature remained statistically unchanged.
https://pubmed.ncbi.nlm.nih.gov/30651568/
___________________________
Scientists Discovered Unsettling Creature Living Under Antarctic Ice
Jul 28, 2022
Abstract
Carbon cycle models suggest that past warming events in the Arctic may
have caused large-scale permafrost thaw and carbon remobilization, thus
affecting atmospheric CO2 levels. However, observational
records are sparse, preventing spatially extensive and time-continuous
reconstructions of permafrost carbon release during the late Pleistocene
and early Holocene. Using carbon isotopes and biomarkers, we
demonstrate that the three most recent warming events recorded in
Greenland ice cores—(i) Dansgaard-Oeschger event 3 (~28 ka B.P.), (ii)
Bølling-Allerød (14.7 to 12.9 ka B.P.), and (iii) early Holocene (~11.7
ka B.P.)—caused massive remobilization and carbon degradation from
permafrost across northeast Siberia. This amplified permafrost carbon
release by one order of magnitude, particularly during the last
deglaciation when global sea-level rise caused rapid flooding of the
land area thereafter constituting the vast East Siberian Arctic Shelf.
Demonstration of past warming-induced release of permafrost carbon
provides a benchmark for the sensitivity of these large carbon pools to
changing climate.
https://www.youtube.com/watch?v=TuEN3WPVTVI
___________________________
Ice Persists in the Northwest Passage, Despite Global Warming
https://scitechdaily.com/ice-persists-in-the-northwest-passage-despite-global-warming/
___________________________
Greenland, Antarctica Melting Six Times Faster Than in the 1990s
March 16, 2020
https://climate.nasa.gov/news/2958/greenland-antarctica-melting-six-times-faster-than-in-the-1990s/
___________________________
Massive meteor crater discovered beneath Greenland’s ice is much older than thought
March 9, 2022
https://www.cnn.com/2022/03/09/world/crater-greenland-age-scn/index.html
___________________________
Natural and Artificial Radionuclides as Tracers of Ocean Processes
2023
https://www.frontiersin.org/research-topics/22796/natural-and-artificial-radionuclides-as-tracers-of-ocean-processes
___________________________
The Arctic Radium Isotope Observing Network (ARION): Tracking Climate-Driven Changes in Arctic Ocean Chemistry
March 24, 2022
https://www.tos.org/oceanography/article/the-arctic-radium-isotope-observing-network-arion-tracking-climate-driven-changes-in-arctic-ocean-chemistry
___________________________
10 ‘Secret Cities’ That Were Kept Hidden From The Public
June 16, 2018
10 Oak Ridge
9 City 40
8 Los Alamos
7 404
6 Hanford/Richland
5 Wunsdorf
4 Camp Century
Another remnant of the Cold War, this US base was part of the secret military operation known as Project Iceworm. The site, located underneath Greenland, was originally a simple scientific research facility. As the need for the US to gain an advantage over the Soviets increased, so did the American need for effective missile launch sites.
This underground city housed everything required to maintain its population for the long haul—from a cinema to a chapel.
The goal of Project Iceworm was to use the extensive underground tunnels of Camp Century to have a mobile nuclear launch site where missiles could be fired at the Soviets from any of dozens of launch bays throughout this massive 4,000-kilometer (2,500 mi) tunnel network.
3 The Closed Cities
2 Burlington Bunker
1 Sarov
https://listverse.com/2018/06/16/10-secret-cities-that-were-kept-hidden-from-the-public/
___________________________
The US Army tried portable nuclear power at remote bases 60 years ago – it didn’t go well
July 20, 2021
In a tunnel 40 feet beneath the surface of the Greenland ice sheet, a Geiger counter screamed. It was 1964, the height of the Cold War. U.S. soldiers in the tunnel, 800 miles from the North Pole, were dismantling the Army’s first portable nuclear reactor.
Commanding Officer Joseph Franklin grabbed the radiation detector, ordered his men out and did a quick survey before retreating from the reactor.
He had spent about two minutes exposed to a radiation field he estimated at 2,000 rads per hour, enough to make a person ill. When he came home from Greenland, the Army sent Franklin to the Bethesda Naval Hospital. There, he set off a whole body radiation counter designed to assess victims of nuclear accidents. Franklin was radioactive.
The Army called the reactor portable, even at 330 tons, because it was built from pieces that each fit in a C-130 cargo plane. It was powering Camp Century, one of the military’s most unusual bases.
___________________________
The City Under the Snow: Inside the US Army’s Failed Nuclear Ice Lair in Cold War Greenland
12/11/2023
https://www.historynet.com/project-iceworm-army-attempted-to-build-nuclear-lair-greenland/
___________________________
1968 Thule Air Base B-52 crash
On 21 January 1968, an aircraft accident, sometimes known as the Thule affair or Thule accident (/ˈtuːli/; Danish: Thuleulykken), involving a United States Air Force (USAF) B-52 bomber occurred near Thule Air Base in the Danish territory of Greenland. The aircraft was carrying four B28FI thermonuclear bombs on a Cold War "Chrome Dome" alert mission over Baffin Bay when a cabin fire forced the crew to abandon the aircraft before they could carry out an emergency landing at Thule Air Base. Six crew members ejected safely, but one who did not have an ejection seat was killed while trying to bail out. The bomber crashed onto sea ice in North Star Bay,[a] Greenland, causing the conventional explosives aboard to detonate and the nuclear payload to rupture and disperse, resulting in radioactive contamination of the area.
The United States and Denmark launched an intensive clean-up and recovery operation, but the secondary stage of one of the nuclear weapons could not be accounted for after the operation was completed. USAF Strategic Air Command "Chrome Dome" operations were discontinued immediately after the accident, which highlighted the safety and political risks of the missions. Safety procedures were reviewed, and more stable explosives were developed for use in nuclear weapons.
In 1995, a political scandal arose in Denmark after a report revealed the government had given tacit permission for nuclear weapons to be located in Greenland, in contravention of Denmark's 1957 nuclear-free zone policy. Workers involved in the clean-up program campaigned for compensation for radiation-related illnesses they experienced in the years after the accident.
https://en.wikipedia.org/wiki/1968_Thule_Air_Base_B-52_crash
___________________________
Project Iceworm
Project Iceworm was a top secret United States Army program of the Cold War, which aimed to build a network of mobile nuclear missile launch sites under the Greenland ice sheet. The goal was to install a vast network of nuclear missile launch sites that could survive a first strike. This was according the Danish Institute for International Studies which obtained declassified documents in 1996.[1][2] The missiles, which could strike targets within the Soviet Union, were never fielded and necessary consent from the Danish Government to do so was never obtained.
To study the feasibility of working under the ice, a highly publicized "cover" project, known as Camp Century, was launched in 1959.[3] Unstable ice conditions within the ice sheet caused the project to be canceled in 1966.
https://en.wikipedia.org/wiki/Project_Iceworm
___________________________
The Robustness of Midlatitude Weather Pattern Changes due to Arctic Sea Ice Loss
August 2016
Abstract and Figures
___________________________
Rescue the Arctic Fox!
https://rescuethearcticfoxes.weebly.com/why-the-arctic-fox-is-endangered.html
-
Scientists have found surprising evidence of rapid climate change in the Arctic: In the middle of the Arctic Ocean near the North Pole, they discovered that the levels of radium-228 have almost doubled over the last decade.
The finding indicates that large-scale changes are happening along the coast -- because the source of the radium is the land and shallow continental shelves surrounding the ocean. These coastal changes, in turn, could also be delivering more nutrients, carbon, and other chemicals into the Arctic Ocean and lead to dramatic impacts on Arctic food webs and animal populations.
The research team, led by Woods Hole Oceanographic Institution (WHOI), suspects that melting sea ice has left more open water near the coast for winds to create waves. The wave action reaches down to the shallow shelves and stirs up sediments, releasing radium that is carried to the surface and away into the open ocean. The same mechanism would likely also mobilize and deliver more nutrients, carbon, and other chemicals into the Arctic Ocean, fueling the growth of plankton at the bottom of the food chain. That, in turn, could have significant impacts on fish and marine mammals and change the Arctic ecosystem.
The study was published Jan. 3, 2018, in the journal Science Advances. The research team included Lauren Kipp, Matthew Charette, and Paul Henderson (WHOI), Willard Moore (University of South Carolina), and Ignatius Rigor (University of Washington).
Scientists have long used radium-228 to track the flow of material from land and sediments into the ocean. It is a naturally occurring isotope produced by the radioactive decay of thorium in sediments. But unlike thorium, it dissolves into water, where scientists can track the sources, amounts, rates, and direction of its flow, said Kipp, who is lead author of the study and a graduate student in the MIT-WHOI Joint Program in Oceanography.
Kipp led efforts to measure radium at 69 locations from the western edge of the Arctic Ocean to the Pole on a two-month voyage aboard the icebreaker Healy in the summer of 2015. The cruise was part of the international GEOTRACES program, which aims to measure chemical tracers in the world's ocean to understand ocean circulation and provide a baseline to assess future chemical changes in the oceans. The U.S. GEOTRACES program and this study are both funded by the National Science Foundation.
___________________________
17 Endangered and Threatened Species in the Arctic and Tundra (With Videos)
https://northeastwildlife.org/endangered-threatened-species-in-the-arctic-tundra/
___________________________
Paleontology in Alaska
https://en.wikipedia.org/wiki/Paleontology_in_Alaska
___________________________
List of the prehistoric life of Alaska
https://en.wikipedia.org/wiki/List_of_the_prehistoric_life_of_Alaska
___________________________
How Dinosaurs Thrived in the Snow
December 3, 2020
Discoveries made in the past decades help show how many species coped with cold temperatures near both poles
https://www.smithsonianmag.com/science-nature/how-dinosaurs-thrived-snow-180976435/
___________________________
Dinosaurs that lived in the Arctic: Prehistoric Polar Dwellers
https://prehistoricsaurus.com/dinosaur-extinction/climate-change/dinosaurs-that-lived-in-the-arctic/
___________________________
When Dinosaurs Walked in Polar Darkness: Life at the Ancient Poles
May 25, 2025
https://dino-world.com/when-dinosaurs-walked-in-polar-darkness-life-at-the-ancient-poles-1-7994/
___________________________
Polar dinosaurs and the question of dinosaur extinction: a brief review
2004
https://www.sciencedirect.com/science/article/abs/pii/S0031018204004225
___________________________
The lost world of northern dinosaurs
August 30, 2024
https://www.gi.alaska.edu/alaska-science-forum/lost-world-northern-dinosaurs
___________________________
7 Dinosaurs That Lived in Alaska (And Where to See Fossils Today)
February 26, 2025
https://a-z-animals.com/blog/dinosaurs-that-lived-in-alaska-and-where-to-see-fossils-today/
___________________________
Nesting at extreme polar latitudes by non-avian dinosaurs
August 23, 2021
https://www.cell.com/current-biology/fulltext/S0960-9822(21)00739-9
___________________________
An Alaska expedition uncovers new details about dinosaurs of the Far North
September 20, 2023
https://www.hcn.org/articles/scientific-research-an-alaska-expedition-uncovers-new-details-about-dinosaurs-of-the-far-north/
___________________________
'We were freaking out': Scientists left 'flabbergasted' by detailed dinosaur footprints covering a cliff in Alaska
August 17, 2023
https://www.livescience.com/animals/dinosaurs/we-were-freaking-out-scientists-left-flabbergasted-by-detailed-dinosaur-footprints-covering-a-cliff-in-alaska
___________________________
Sibirotitan
Sibirotitan ("Siberian titan") is a genus of somphospondyl sauropod from the Ilek Formation of Russia. The type and only species is S. astrosacralis.
https://en.wikipedia.org/wiki/Sibirotitan
___________________________
Perfectly Preserved Ice Age Cave Bear Discovered in Russian Arctic
15 Sep 2020
___________________________
‘They came from the ends of the earth’: long-distance exchange of obsidian in the High Arctic during the Early Holocene
2019
___________________________
The eastward intrusion of the Lena River into the East Siberian Sea since the early Holocene
2024
https://www.sciencedirect.com/science/article/pii/S0025322724002202
___________________________
East Siberian Sea
https://www.britannica.com/place/East-Siberian-Sea
___________________________
The Spatial Distribution of Plankton Picocyanobacteria on the Shelf of the Kara, Laptev, and East Siberian Seas
26 February 2020
https://link.springer.com/article/10.3103/S0096392519040011
___________________________
Assessment of mercury levels in modern sediments of the East Siberian Sea
2021
https://www.sciencedirect.com/science/article/abs/pii/S0025326X21004604
___________________________
Mass Budget of Methylmercury in the East Siberian Sea: The Importance of Sediment Sources
July 2020
https://www.researchgate.net/publication/342920124_Mass_Budget_of_Methylmercury_in_the_East_Siberian_Sea_The_Importance_of_Sediment_Sources
___________________________
Ferromanganese nodules from the East Siberian Sea near Bennett Island
03 November 2017
https://link.springer.com/article/10.1134/S0001437017050022
___________________________
The current state of submarine island relicts on the East Siberian shelf
2007
https://www.deepdyve.com/lp/springer-journals/the-current-state-of-submarine-island-relicts-on-the-east-siberian-xka7ymrmAk
___________________________
East Siberian Arctic background and black carbon polluted aerosols at HMO Tiksi
2018 Nov 12
https://pubmed.ncbi.nlm.nih.gov/30577143/
___________________________
Acidification of East Siberian Arctic Shelf waters through addition of freshwater and terrestrial carbon
18 April 2016
https://www.nature.com/articles/ngeo2695
___________________________
A Massive Methane Reservoir Is Lurking Beneath the Sea
May 02, 2021
Methane
bubbles regularly reach the surface of the Laptev Sea in the East
Siberian Arctic Ocean (ESAO), each of them a small blow to our efforts
to mitigate climate change. The source of the methane used to be a
mystery, but a joint Swedish-Russian-U.S. investigation recently
discovered that an ancient gas reservoir is responsible for the bubbly
leaks...
https://www.ecowatch.com/laptev-sea-methane-2652853420.html
___________________________
The effect of estuarine system on the meiofauna and nematodes in the East Siberian Sea
2021 Sep 29
https://www.ncbi.nlm.nih.gov/pmc/articles/PMC8481313/
___________________________
'Unprecedented' Siberian Oil Spill Reaches Arctic Glacial Lake
June 9, 2020
A
massive fuel spill in northern Siberia has reached an Arctic glacial
lake after seeping through floating barriers installed to stop the leak,
regional officials said Tuesday.
President Vladimir Putin
declared a state of emergency last Wednesday, several days after 21,000
metric tons of diesel leaked from a collapsed fuel tank outside the city
of Norilsk. Massive concentrations of pollution were recorded in a
nearby river, a phenomenon that local environmental officials said was
due to the floating dams being ineffective or installed too late.
https://www.themoscowtimes.com/2020/06/09/unprecedented-siberian-oil-spill-reaches-arctic-glacial-lake-a70522
___________________________
Trace metals and organic carbon in sediments of the northeastern Chukchi Sea
April 2014
https://www.semanticscholar.org/paper/Trace-metals-and-organic-carbon-in-sediments-of-the-Trefry-Trocine/f7a9e65f9b46526a1d4ddc4377b2b7d095923ec4
___________________________
Atmospheric constraints on the methane emissions from the East Siberian Shelf
2016
https://acp.copernicus.org/articles/16/4147/2016/
___________________________
Dissolved gallium in the Beaufort Sea: a promising conservative water mass tracer
24 August 2015t
https://www.geotraces.org/dissolved-gallium-in-the-beaufort-sea/
___________________________
Widespread, multi-source glacial erosion on the Chukchi margin, Arctic Ocean
2013
https://www.sciencedirect.com/science/article/abs/pii/S0277379113002758
___________________________
Change in Sediment Provenance on the Inner Slope of the Chukchi Rise and Their Paleoenvironmental Implications
2021
https://www.mdpi.com/2076-3417/11/14/6491/htm
___________________________
Mercury
in the northeastern Chukchi Sea: Distribution patterns in seawater and
sediments and biomagnification in the benthic food web
2013
https://www.sciencedirect.com/science/article/abs/pii/S0967064513002865
___________________________
Mercury biomagnification in food webs of the northeastern Chukchi Sea, Alaskan Arctic
2017
https://www.sciencedirect.com/science/article/abs/pii/S0967064517301443
___________________________
Late Holocene Paleomagnetic Secular Variation in the Chukchi Sea, Arctic Ocean
2021
https://agupubs.onlinelibrary.wiley.com/doi/epdf/10.1029/2021GC010187
___________________________
Mercury in organs of Pacific walruses (Odobenus rosmarus divergens) from the Bering Sea
18 November 2017
https://link.springer.com/article/10.1007/s11356-017-0566-1
___________________________
Widespread, multi-source glacial erosion on the Chukchi margin, Arctic Ocean
2013
https://www.sciencedirect.com/science/article/abs/pii/S0277379113002758
___________________________
Late Holocene Paleomagnetic Secular Variation in the Chukchi Sea, Arctic Ocean
29 April 2022
https://agupubs.onlinelibrary.wiley.com/doi/full/10.1029/2021GC010187
___________________________
Contamination
status and accumulation characteristics of heavy metals and arsenic in
five seabird species from the central Bering Sea
2017 Mar 13
https://www.ncbi.nlm.nih.gov/pmc/articles/PMC5402206/
___________________________
Mercury
in the northeastern Chukchi Sea: Distribution patterns in seawater and
sediments and biomagnification in the benthic food web
2014
https://www.academia.edu/14920786/Mercury_in_the_northeastern_Chukchi_Sea_Distribution_patterns_in_seawater_and_sediments_and_biomagnification_in_the_benthic_food_web
___________________________
Organochlorine
Pesticides and Polychlorinated Biphenyls in the Subcutaneous Adipose
Tissue of Beluga Whales (Delphinapterus leucas) of the White, Kara and
Bering Seas
12 April 2021
https://link.springer.com/article/10.1134/S0001437021010100
___________________________
Distribution of organochlorine pesticides in seawater of the Bering and Chukchi Sea
2001
https://pubmed.ncbi.nlm.nih.gov/11808555/
___________________________
Concentration,
distribution and sources of perfluoroalkyl substances and
organochlorine pesticides in surface sediments of the northern Bering
Sea, Chukchi Sea and adjacent Arctic Ocean
2019
https://pubmed.ncbi.nlm.nih.gov/31561312/
___________________________
Atmospheric organochlorine pollutants and air-sea exchange of hexachlorocyclohexane in the Bering and Chukchi Seas
1991
https://pubs.er.usgs.gov/publication/5222708
___________________________
Spatial Distribution of Hexachlorocyclohexane Isomers in the Bering and Chukchi Sea Shelf Ecosystem
1997
https://pubs.acs.org/doi/abs/10.1021/es9609258
___________________________
Chukchi Sea
https://en.wikipedia.org/wiki/Chukchi_Sea
___________________________
10 Important Facts Related To The Chukchi Sea
April 19 2018

https://www.worldatlas.com/articles/10-important-facts-related-to-the-chukchi-sea.html
___________________________
Churning in the Chukchi Sea
https://climate.nasa.gov/climate_resources/169/churning-in-the-chukchi-sea/
___________________________
Chukchi Sea
https://www.sciencedirect.com/topics/earth-and-planetary-sciences/chukchi-sea
___________________________
Research Floats Surface in the Chukchi Sea Providing Valuable Data on Under Sea-Ice Conditions
August 18, 2021
https://www.ecofoci.noaa.gov/news-story/research-floats-surface-chukchi-sea-providing-valuable-data-under-sea-ice-conditions
___________________________
Chukchi Sea ice that didn’t melt this summer is now 2+m thick between Wrangel Island and the shore
2021
https://wattsupwiththat.com/2021/11/19/chukchi-sea-ice-that-didnt-melt-this-summer-is-now-2m-thick-between-wrangel-island-and-the-shore/
___________________________
Russia is poised to open the first-ever commercial pollock fishery in Chukchi Sea
June 25, 2020
https://www.arctictoday.com/russia-is-poised-to-open-the-first-ever-commercial-pollock-fishery-in-chukchi-sea/
___________________________
Seasonal Water Mass Evolution and Non-Redfield Dynamics Enhance CO2 Uptake in the Chukchi Sea
10 July 2022
https://agupubs.onlinelibrary.wiley.com/doi/abs/10.1029/2021JC018326
___________________________
CIRCULATION AND OUTFLOWS OF THE CHUKCHI SEA
http://psc.apl.washington.edu/HLD/Chukchi/Chukchi.html
___________________________
Algal Bloom, Succession, and Drawdown of Silicate in the Chukchi Sea in Summer 2010
08 July 2021
https://link.springer.com/article/10.1007/s10021-021-00657-1
___________________________
Flow of pacific water in the western Chukchi Sea: Results from the 2009 RUSALCA expedition
2015
https://www.sciencedirect.com/science/article/pii/S0967063715001466
___________________________
There’s more sea ice in the Chukchi Sea than last fall, but it’s still historically low
November 3, 2020
https://www.ktoo.org/2020/11/03/theres-more-ice-in-the-chukchi-than-last-fall-but-waters-near-alaska-are-still-lagging/
___________________________
Origin and Fate of Harmful Algal Blooms in the Warming Chukchi Sea
2018
https://www.arcus.org/nna/projects/1823002
___________________________
Spatio-temporal variation of microplastic pollution in the sediment from the Chukchi Sea over five years
2021 Sep 24
https://pubmed.ncbi.nlm.nih.gov/34844325/
___________________________
Mechanisms of Persistent High Primary Production During the Growing Season in the Chukchi Sea
18 September 2020
https://link.springer.com/article/10.1007/s10021-020-00559-8
___________________________
Microplastics abundance and characteristics in surface waters from the Northwest Pacific, the Bering Sea, and the Chukchi Sea
2019 Apr 23
https://pubmed.ncbi.nlm.nih.gov/31789166/
___________________________
Pelagic Methane Oxidation in the Northern Chukchi Sea
https://aslopubs.onlinelibrary.wiley.com/doi/am-pdf/10.1002/lno.11254
___________________________
Seasonal
and latitudinal variations in sea ice algae deposition in the Northern
Bering and Chukchi Seas determined by algal biomarkers
April 22, 2020
https://journals.plos.org/plosone/article?id=10.1371/journal.pone.0231178
___________________________
Deglacial sea level history of the East Siberian Sea and Chukchi Sea margins
05 Sep 2017
https://cp.copernicus.org/articles/13/1097/2017/
___________________________
Rapid sea-level rise and Holocene climate in the Chukchi Sea
October 01, 2006
https://pubs.geoscienceworld.org/gsa/geology/article-abstract/34/10/861/129387/Rapid-sea-level-rise-and-Holocene-climate-in-the
___________________________
DRILLING THE CHUKCHI SEA?
2012
https://lawprofessors.typepad.com/files/chukchi-sea-case-study-overview-1.pdf
___________________________
Dissolved
and Particulate Phosphorus Distributions and Elemental Stoichiometry
Throughout the Chukchi SeaElemental Stoichiometry Throughout the Chukchi
Sea
2015
https://scholarcommons.sc.edu/cgi/viewcontent.cgi?article=4684&context=etd
___________________________
Stable isotope differences of polar bears in the Southern Beaufort Sea and Chukchi Sea
30 March 2022
https://wildlife.onlinelibrary.wiley.com/doi/10.1002/jwmg.22225?af=R
___________________________
Seal
body condition and atmospheric circulation patterns influence polar
bear body condition, recruitment, and feeding ecology in the Chukchi Sea
28 February 2021
https://onlinelibrary.wiley.com/doi/abs/10.1111/gcb.15572
___________________________
Has an Old Soviet Mystery at Last Been Solved?
May 10, 2021
The strange fate of a group of skiers in the Ural Mountains has generated endless speculation.
https://www.newyorker.com/magazine/2021/05/17/has-an-old-soviet-mystery-at-last-been-solved
___________________________
Uranium and thorium contents in soils and bottom sediments of lake Bolshoye Yarovoye, western Siberia
2019 Sep 20
https://pubmed.ncbi.nlm.nih.gov/31546081/
___________________________
Determination
of Depositional Beryllium-10 Fluxes in the Area of the Laptev Sea and
Beryllium-10 Concentrations in Water Samples of High Northern Latitudes
1999
https://link.springer.com/chapter/10.1007/978-3-642-60134-7_40
___________________________
228Ra as a tracer for shelf water in the arctic ocean
1995
https://www.sciencedirect.com/science/article/pii/0967064595000534
___________________________
Thawing Permafrost: The speed of coastal erosion in Eastern Siberia has nearly doubled
2013
https://innovationtoronto.com/2013/10/thawing-permafrost-speed-coastal-erosion-eastern-siberia-nearly-doubled/
___________________________
Radium 228 and Radium 226 in surface water of the Kara Sea and Laptev Sea
2003
https://core.ac.uk/display/58318661
___________________________
228Ra and 226Ra in the Kara and Laptev seas
2002
https://core.ac.uk/display/33669266
___________________________
Russians warn of radiation threat to Arctic
2 October 1999
RADIOACTIVITY that leaked from two underground nuclear explosions in northern
Siberia during the 1970s has still not been properly cleaned up and could
contaminate the Arctic, according to Russian scientists.
Between 1965 and 1988, the Soviet Union exploded 116 nuclear bombs to help
mining, quarrying and oil production—17 of them near the Arctic Circle.
Two blasts in what is now the Republic of Sakha accidentally released
radioactivity into the atmosphere. The first, the 1.7 kiloton “Crystal”,
exploded near Udachnyy in October 1974 and the second, the 19-kiloton
“Craton-3”, near Aykhal in August 1978.
Andrei Gedeonov of the V. G. Khlopin Radium Institute in St Petersburg says
that surface levels of plutonium and caesium at both sites are “extremely high”.
In surveys conducted in the early 1990s, he found that the average concentration
of plutonium in lichen up to 1.5 kilometres from Craton-3 was 2.1 becquerels per
gram—780 times higher than at uncontaminated sites nearby.
Further down the water catchments in which the two sites lie, raised levels
of plutonium in sediments suggest that the contamination could spread into
rivers, Gedeonov told a conference last week in Edinburgh on radioactive
pollution in the Arctic.
At the same meeting, Vladimir Vasiliev of the Yakut International Centre for
Development of the Northern Territories, Yakutsk, claimed that the pollution
around Craton-3 and Crystal was comparable to that now found within 30
kilometres of the Chernobyl reactor in the Ukraine.
https://www.newscientist.com/article/mg16422062-500-russians-warn-of-radiation-threat-to-arctic/
___________________________
Sea-ice production and transport of pollutants in the Laptev Sea, 1979–1993
1997
https://www.sciencedirect.com/science/article/abs/pii/S0048969797001071
___________________________
Persistent organic pollutants in the Pechora Sea walruses
22 January 2019
https://link.springer.com/article/10.1007/s00300-019-02457-9
___________________________
Potential for rapid transport of contaminants from the Kara Sea
1997
https://www.sciencedirect.com/science/article/pii/S0048969797001083
___________________________
Fauna associated with shallow-water methane seeps in the Laptev Sea
2020
https://pubmed.ncbi.nlm.nih.gov/32411521/
___________________________
Hydrochemical Structural Patterns of the Lena River–Laptev Sea Mixing Zone in the Autumn Period
02 March 2021
https://link.springer.com/article/10.1134/S0001437020060053
___________________________
The Laptev Sea as a source for recent Arctic Ocean salinity change
May 2001
https://www.researchgate.net/publication/228603776_The_Laptev_Sea_as_a_source_for_recent_Arctic_Ocean_salinity_change
___________________________
Particulate
organic matter in surface sediments of the Laptev Sea (Arctic Ocean):
application of maceral analysis as organic-carbon-source indicator
2000
https://www.sciencedirect.com/science/article/abs/pii/S0025322799000663
___________________________
Outflow of trace metals into the Laptev Sea by the Lena River
1996
https://www.sciencedirect.com/science/article/abs/pii/0304420395000933
___________________________
Activity
concentration of caesium-137 in seawater and plankton of the Pomeranian
Bay (the Southern Baltic Sea) before and after flood in 1997.
01 Dec 2003
https://europepmc.org/article/MED/14643782
___________________________
Trophic pathways and carbon flux patterns in the Laptev Sea
2006
https://www.sciencedirect.com/science/article/abs/pii/S0079661106001236
___________________________
Activation of old carbon by erosion of coastal and subsea permafrost in Arctic Siberia
29 August 2012
https://www.nature.com/articles/nature11392
___________________________
Short- and long-term thermo-erosion of ice-rich permafrost coasts in the Laptev Sea region
2013
https://epic.awi.de/id/eprint/33391/1/Guenther_etal_BG_2013.pdf
___________________________
Space-time
dynamics of carbon stocks and environmental parameters related to
carbon dioxide emissions in the Buor-Khaya Bay of the Laptev Sea
2013
https://www.jamstec.go.jp/jdb/ronbun/Ks00035464.pdf
___________________________
Holocene hydrographical changes of the eastern Laptev Sea (Siberian Arctic) recorded in δ18O profiles of bivalve shells
2003
https://www.sciencedirect.com/science/article/abs/pii/S0033589403001406
___________________________
Carbon mineralization in Laptev and East Siberian sea shelf and slope sediment
January 2018
https://www.researchgate.net/publication/322708405_Carbon_mineralization_in_Laptev_and_East_Siberian_sea_shelf_and_slope_sediment
___________________________
Quantifying Degradative Loss of Terrigenous Organic Carbon in Surface Sediments Across the Laptev and East Siberian Sea
2019 Jan 28
https://pubmed.ncbi.nlm.nih.gov/31007382/
___________________________
Field-obtained carbon and nitrogen uptake rates of phytoplankton in the Laptev and East Siberian seas
July 2017
https://www.researchgate.net/publication/318379646_Field-obtained_carbon_and_nitrogen_uptake_rates_of_phytoplankton_in_the_Laptev_and_East_Siberian_seas
___________________________
The Importance of Benthic Nutrient Fluxes in Supporting Primary Production in the Laptev and East Siberian Shelf Seas
17 June 2021
https://agupubs.onlinelibrary.wiley.com/doi/10.1029/2020GB006849
___________________________
Seasonal nitrogen fluxes of the Lena River Delta
2021 Dec 16
https://www.ncbi.nlm.nih.gov/pmc/articles/PMC8692507/
___________________________
Origin and biogeochemical cycling of organic nitrogen in the eastern Arctic Ocean as evident from D- and L-amino acids
2001
https://www.sciencedirect.com/science/article/abs/pii/S0016703701006883
___________________________
The biochemical composition of phytoplankton in the Laptev and East Siberian seas during the summer of 2013
15 October 2018
https://link.springer.com/article/10.1007/s00300-018-2408-0
___________________________
Community structure of nematodes in the Laptev Sea shelf with notes on the lives of ice nematodes
2019
https://www.sciencedirect.com/science/article/abs/pii/S2352485519302749
___________________________
Environmental conditions of the Laptev Sea region in the late postglacial time
18 February 2016
https://link.springer.com/article/10.1134/S0869593815060064
___________________________
The Indicator Role of Algae in Assessing the Organic Pollution in the Lena River Delta, the Russian Arctic
20 June 2022
https://www.frontiersin.org/articles/10.3389/fenvs.2022.921819/full
___________________________
Microbial Communities Involved in Methane, Sulfur, and Nitrogen Cycling in the Sediments of the Barents Sea
2021 Nov 15
https://www.ncbi.nlm.nih.gov/pmc/articles/PMC8625253/
___________________________
Marine seabed litter in Siberian Arctic: A first attempt to assess
2021
https://www.sciencedirect.com/science/article/abs/pii/S0025326X21008705
___________________________
Tritium in Natural Water of the Lena River Basin
05 July 2022
https://link.springer.com/article/10.1134/S1875372822010073
___________________________
Government scientists experimented with atomic blasts to fracture natural gas wells.
Project Gasbuggy was the first in a series of Atomic Energy Commission downhole nuclear detonations to release natural gas trapped in shale. This was “fracking” late 1960s style.
In December 1967, government scientists — exploring the peacetime use of controlled atomic explosions — detonated Gasbuggy, a 29-kiloton nuclear device they had lowered into an experimental well in rural New Mexico. The Hiroshima bomb of 1945 was about 15 kilotons.
https://aoghs.org/technology/project-gasbuggy/
___________________________
Reprocessing of Fast Reactors Mixed U-Pu Used Nuclear Fuel in Russian Federation: Studies and Industrial Test
https://media.superevent.com/documents/20170618/bc26981d5599f87809b89f8551913320/fr17-076.pdf
___________________________
In Soviet Russia, Lake Contaminates You
October 2008
https://www.damninteresting.com/in-soviet-russia-lake-contaminates-you/
___________________________
More Than a Dozen Mysterious Carved Discs Found Near Volgograd, Russia
27 April, 2022
https://www.ancient-origins.net/news-general/mysterious-discs-003918
___________________________
First 230Th/U date of middle Pleistocene peat bog in Siberia (key section Krivosheino, Western Siberia)
2012
http://yadda.icm.edu.pl/yadda/element/bwmeta1.element.baztech-article-BWMA-0009-0002
___________________________
A method for determination of the isotopic composition of authigenic uranium in Baikal bottom sediments
2007
https://pubs.geoscienceworld.org/rgg/article-abstract/48/6/468/588982/A-method-for-determination-of-the-isotopic?redirectedFrom=fulltext
___________________________
Last
interglacial environment of the Baikal Region (Southern Siberia,
Russia) based on analysis of fossil invertebrates and plants
2021
https://www.biotaxa.org/pe/article/view/palaeoentomology.4.6.6
___________________________
Volostnov Aleksandr Valerevich. Uranium and thorium in coals of the Central Siberia. 2004
https://disseng.com/methods-geochemical-geochemistry/uranium-and-thorium-coals-the-central.html#gsc.tab=0
___________________________
Uranium and thorium in carbonatitic minerals from the Guli massif, Polar Siberia
2013
https://link.springer.com/article/10.1134/S0016702913090036
___________________________
New Siberian Islands
https://en.wikipedia.org/wiki/New_Siberian_Islands
___________________________
Alaska Purchase
The Alaska Purchase was the purchase of Alaska from the Russian Empire by the United States for a sum of $7.2 million in 1867 (equivalent to $129 million in 2023).[1] On May 15 of that year, the United States Senate ratified a bilateral treaty that had been signed on March 30, and American sovereignty became legally effective across the territory on October 18.
https://en.wikipedia.org/wiki/Alaska_Purchase
___________________________
Russian politician says Kremlin should ‘claim back’ Alaska
08 July 2022
Russia colonised Alaska and established several settlements there until US purchased it in 1867 for $7.2 million
https://www.independent.co.uk/news/world/europe/russia-alaska-putin-vyacheslav-volodin-b2118942.html
___________________________
Current State of the Rare Earth Industry in Russia and Siberia
2014
https://www.sciencedirect.com/science/article/pii/S1876619614001739
___________________________
Geography of Russia
https://en.wikipedia.org/wiki/Geography_of_Russia
___________________________
The longest rivers of Russia
https://gm.efuc.org/1937-the-longest-rivers-of-russia.html
___________________________
Arctic today News
___________________________
Quick facts, basic science, and information about snow, ice, and why the cryosphere matters
___________________________
___________________________
___________________________
Section 3: Biology
___________________________
___________________________
___________________________
Melting Ice, Moving Pollutants: The Arctic Drift That’s Rewriting Ocean Chemistry
___________________________
Pollution in the Arctic Ocean: An overview of multiple pressures and implications for ecosystem services
2021
https://pmc.ncbi.nlm.nih.gov/articles/PMC8692579/
___________________________
Pollution in the Arctic Ocean
https://en.wikipedia.org/wiki/Pollution_in_the_Arctic_Ocean
___________________________
Landscape of the metaplasmidome of deep-sea hydrothermal vents located at Arctic Mid-Ocean Ridges in the Norwegian–Greenland Sea: ecological insights from comparative analysis of plasmid identification tools
2024
Abstract
Plasmids are one of the key drivers of microbial adaptation and evolution. However, their diversity and role in adaptation, especially in extreme environments, remains largely unexplored. In this study, we aimed to identify, characterize, and compare plasmid sequences originating from samples collected from deep-sea hydrothermal vents located in Arctic Mid-Ocean Ridges. To achieve this, we employed, and benchmarked three recently developed plasmid identification tools—PlasX, GeNomad, and PLASMe—on metagenomic data from this unique ecosystem. To date, this is the first direct comparison of these computational methods in the context of data from extreme environments. Upon recovery of plasmid contigs, we performed a multiapproach analysis, focusing on identifying taxonomic and functional biases within datasets originating from each tool. Next, we implemented a majority voting system to identify high-confidence plasmid contigs, enhancing the reliability of our findings. By analysing the consensus plasmid sequences, we gained insights into their diversity, ecological roles, and adaptive significance. Within the high-confidence sequences, we identified a high abundance of Pseudomonadota and Campylobacterota, as well as multiple toxin–antitoxin systems. Our findings ensure a deeper understanding of how plasmids contribute to shaping microbial communities living under extreme conditions of hydrothermal vents, potentially uncovering novel adaptive mechanisms.
https://pmc.ncbi.nlm.nih.gov/articles/PMC11451466/
___________________________
Emergent biogeochemical risks from Arctic permafrost degradation
30 September 2021
Abstract
The Arctic cryosphere is collapsing, posing overlapping environmental risks. In particular, thawing permafrost threatens to release biological, chemical and radioactive materials that have been sequestered for tens to hundreds of thousands of years. As these constituents re-enter the environment, they have the potential to disrupt ecosystem function, reduce the populations of unique Arctic wildlife and endanger human health. Here, we review the current state of the science to identify potential hazards currently frozen in Arctic permafrost. We also consider the cascading natural and anthropogenic processes that may compound the impacts of these risks, as it is unclear whether the highly adapted Arctic ecosystems have the resilience to withstand new stresses. We conclude by recommending research priorities to address these underappreciated risks.
https://www.nature.com/articles/s41558-021-01162-y
___________________________
Could microbes, locked in Arctic ice for millennia, unleash a wave of deadly diseases?
___________________________
A rising danger in the Arctic
November 25, 2024
As climate change melts permafrost, microbes will emerge. The world isn’t paying enough attention to the potential threat they pose.
https://thebulletin.org/2024/11/a-rising-danger-in-the-arctic-microbes-unleashed-by-climate-change/
___________________________
Microbial genomics amidst the Arctic crisis
2020
Abstract
The Arctic is warming – fast. Microbes in the Arctic play pivotal roles in feedbacks that magnify the impacts of Arctic change. Understanding the genome evolution, diversity and dynamics of Arctic microbes can provide insights relevant for both fundamental microbiology and interdisciplinary Arctic science. Within this synthesis, we highlight four key areas where genomic insights to the microbial dimensions of Arctic change are urgently required: the changing Arctic Ocean, greenhouse gas release from the thawing permafrost, 'biological darkening' of glacial surfaces, and human activities within the Arctic. Furthermore, we identify four principal challenges that provide opportunities for timely innovation in Arctic microbial genomics. These range from insufficient genomic data to develop unifying concepts or model organisms for Arctic microbiology to challenges in gaining authentic insights to the structure and function of low-biomass microbiota and integration of data on the causes and consequences of microbial feedbacks across scales. We contend that our insights to date on the genomics of Arctic microbes are limited in these key areas, and we identify priorities and new ways of working to help ensure microbial genomics is in the vanguard of the scientific response to the Arctic crisis.
https://pmc.ncbi.nlm.nih.gov/articles/PMC7371112/
___________________________
Microbial dynamics in rapidly transforming Arctic proglacial landscapes
June 25, 2024
https://journals.plos.org/climate/article?id=10.1371/journal.pclm.0000337
___________________________
Comparative analysis of characteristics of antibiotic resistomes between Arctic soils and representative contaminated samples using metagenomic approaches
2024
https://www.sciencedirect.com/science/article/abs/pii/S0304389424005223
___________________________
Metagenomic characterization of antibiotic resistance genes in Antarctic soils
2019
https://www.sciencedirect.com/science/article/abs/pii/S0147651319303719
___________________________
Antibiotic resistance discovered in newly identified bacterium
May 7, 2025
Staphylococcus borealis has been found to be resistant to several different types of antibiotics, posing a potentially significant problem for the elderly.
In 2020, a research group at UiT The Arctic University of Norway in Tromsø discovered a previously unknown bacterium. You may have heard of Staphylococcus aureus (golden staph), but this one belongs to the white variety.
The newcomer, discovered in Tromsø in Northern Norway, was proudly named Staphylococcus borealis (S. borealis) after the northern lights.
But how dangerous is it really, and is it a threat to us at all?
https://phys.org/news/2025-05-antibiotic-resistance-newly-bacterium.html
___________________________
The Arctic Sea revealed as a potential treasure trove for new medicines
Aug 30 2024
Antibiotics are the linchpin of modern medicine: without them, anyone with open wounds or needing surgery would be at constant risk of dangerous infections. Yet, we continue to face a global antibiotic crisis as more and more resistant strains of bacteria evolve. In contrast, the discovery rate of fundamentally new antibiotics has been much slower.
New Hope from Unexplored Environments
But there is reason for hope: 70% of all currently licensed antibiotics have been derived from actinobacteria in the soil, and most environments on Earth have not yet been prospected for them. Thus, focusing the search on actinobacteria in other habitats is a promising strategy—especially from unexplored environments like the Arctic Sea—especially if this were to yield novel molecules that neither kill bacteria outright nor stop them from growing but only reduce their 'virulence' or capacity for causing disease. This is because it is hard for targeted pathogenic strains to evolve resistance under these conditions, while such antivirulence compounds are also less likely to cause unwanted side effects.
Advanced Screening Assays Reveal New Compounds
"In our study, we utilized high-content screening assays (FAS-HCS) and Tir translocation assays to specifically identify antivirulence and antibacterial compounds from actinobacteria extracts," said Dr Päivi Tammela, a professor at the University of Helsinki, Finland, and the corresponding author of a new study in Frontiers in Microbiology. "We discovered two distinct compounds: a large phospholipid that inhibits enteropathogenic E. coli (EPEC) virulence without affecting its growth, and a growth-inhibiting compound, both in actinobacteria from the Arctic Ocean."
High-throughput automated screening of these candidate compounds was performed using an advanced workflow designed to handle the complex nature of microbial extracts. Tammela and colleagues developed a new suite of methods that simultaneously test for the antivirulence and antibacterial effects of hundreds of unknown compounds. They targeted an EPEC strain that causes severe—and sometimes deadly—diarrhea in children under five, especially in developing countries. EPEC causes disease by adhering to cells in the human gut. Once it adheres to these cells, EPEC injects so-called 'virulence factors' into the host cell to hijack its molecular machinery, ultimately killing it.
Discovery of Antivirulence and Antibacterial Compounds
The tested compounds were derived from four species of actinobacteria, isolated from invertebrates sampled in the Arctic Sea off Svalbard during an expedition of the Norwegian research vessel 'Kronprins Haakon' in August 2020. These bacteria were then cultured, their cells extracted, and their contents separated into fractions. Each fraction was then tested in vitro against EPEC adhering to cultured colorectal cancer cells.
The researchers found two previously unknown compounds with distinct biological activities: one from an unknown strain (T091-5) in the genus Rhodococcus and another from an unknown strain (T160-2) of Kocuria. The compound from T091-5, identified as a large phospholipid, showed powerful antivirulence effects by inhibiting the formation of actin pedestals and the binding of EPEC to the Tir receptor on the host cell’s surface. The compound from T160-2 exhibited strong antibacterial properties by inhibiting the growth of EPEC bacteria.
Promising Results and Next Steps
Detailed analysis revealed that the phospholipid from T091-5 does not inhibit bacterial growth, making it a promising candidate for antivirulence therapy, as it reduces the likelihood of resistance development. In contrast, the compound from T160-2 was found to inhibit growth and is being investigated further for its potential as a novel antibiotic.
The researchers used HPLC-HR-MS2 to isolate and identify these compounds, with the phospholipid's molecular weight around 700 and its specific role in disrupting the interaction between EPEC and host cells. "The next steps are the optimization of the culture conditions for compound production and the isolation of sufficient amounts of each compound to elucidate their respective structures and further investigate their respective bioactivities," said Tammela.
___________________________
Mercuric reductase genes (merA) and mercury resistance plasmids in High Arctic snow, freshwater and sea-ice brine
01 January 2014
https://academic.oup.com/femsec/article/87/1/52/508980?login=false
___________________________
Identification of miniature plasmids in psychrophilic Arctic bacteria of the genusVariovorax
2016
___________________________
Plasmid diversity in Arctic strains of Psychrobacter spp
March 2013
___________________________
Interactions between plasmids and other mobile genetic elements affect their transmission and persistence
2019 Feb 14
https://pubmed.ncbi.nlm.nih.gov/30771401/
___________________________
Anthropogenic Perturbations of Arctic Marine Microbial Community
06 December 2024
Abstract
Diverse ecosystems including the Arctic marine community provide numerous essential services to humans due to the presence plus activities of the microbial organics dwelling in it. In the cold seeps are microbial mats comprised of different populations of methane- and sulfide-oxidizing bacteria and anaerobic methane-oxidizing archaea (ANME) with sulfate-reducing bacteria (SRB), thereby ensuring the amount of methane reaching the seafloor and water column. However, periodic disturbances across the sediment–water interface influence these marine coastal sediments, thereby ensuring diversity maintenance and impacting many of the Earth’s ecosystems. These disturbances emanate from the dissipation of energetic flows of varying strengths and at differential temporal scales in the benthic boundary layer. Varied disturbances and climate change have affected these Arctic marine ecosystems and the services they provide, the well-being of humans that depend on these services, and cascading effects cum feedbacks across social-ecological systems (SES) such as when sea-ice loss that alters food security through changes in the distribution of marine animals. In furtherance, as the high variability of ice cover and temperature subsists, the frequency and magnitude of marine heatwaves tend to increase globally and disrupt the provision of ecosystem services in decades to come. Consequences of these anticipated changes will present significant challenges to coastal communities and commercial dependents of living marine resources and can exacerbate unexpected turnouts such as deterministic microbial community assembly, and promote the development of alternative stable conditions. Current investigation approaches have been strategized to the anthropogenic processes to facilitate amelioration of the challenges encountered. Thus, the identification of these cascading changes in SES can forestall surprised outcomes of these anthropogenic perturbations and facilitate revamped responses from policymakers.
https://link.springer.com/chapter/10.1007/978-3-031-73584-4_15
___________________________
A review of wastewater handling in the Arctic with special reference to pharmaceuticals and personal care products (PPCPs) and microbial pollution
2021
https://www.sciencedirect.com/science/article/abs/pii/S0925857412001528
___________________________
Microbes Discovered in the Alps and Arctic That Can Digest Plastic at Low Temperatures
___________________________
Confronting Plastic Pollution With Bacteria
March 2019
https://www.jonaa.org/content/2019/03/16/bacteria-biodegradable-plastic
___________________________
How microbes can detoxify heavy metal pollution in the ocean
19 March 2025
___________________________
Cold-resistant bacteria found in the Arctic can degrade crude oil
February 8, 2024
https://phys.org/news/2024-02-cold-resistant-bacteria-arctic-degrade.html
___________________________
Microarray and Real-Time PCR Analyses of the Responses of High-Arctic Soil Bacteria to Hydrocarbon Pollution and Bioremediation Treatments
2009
https://pmc.ncbi.nlm.nih.gov/articles/PMC2753079/
___________________________
Characterization of antimicrobial resistance genes and virulence factor genes in an Arctic permafrost region revealed by metagenomics
2021
https://www.sciencedirect.com/science/article/abs/pii/S0269749121022168
___________________________
Diatoms in Arctic regions: Potential tools to decipher environmental changes
2018
https://www.sciencedirect.com/science/article/pii/S1873965217301391
___________________________
Freshwater diatoms as indicators of environmental change in the High Arctic
05 June 2012
Introduction
High Arctic environments continue to receive increased attention from the scientific community, policy makers, and the public at large because polar regions are considered to be especially sensitive to the effects of global climatic and other environmental changes (Rouse et al., 1997; ACIA, 2004; IPCC, 2007). Polar lakes and ponds, and the biota they contain, are important sentinels of environmental changes (Pienitz et al., 2004; Schindler & Smol, 2006) and have thus been the focus of many research programs (Vincent & Laybourn-Parry, 2008).
There is considerable potential for using living and fossil diatom assemblages to track environmental trends in High Arctic regions (Smol & Douglas, 1996; Douglas et al., 2004a). A growing number of studies have examined the taxonomy, ecology, and paleoecology of High Arctic diatoms, as lakes and ponds are dominant features of most Arctic landscapes. Given the diversity and vastness of these regions, many exciting research opportunities exist. For example, about 18% (by area) of Canada's surface waters are situated north of 60 °N (Statistics Canada, 1987), and Sheath (1986) estimated that tundra ponds cover approximately 2% of the Earth's surface. The heightened interest in High Arctic environments, coupled with an increased accessibility of these remote regions (e.g. by helicopter), has resulted in a recent surge of interest in Arctic diatom research. Whilst some proxy techniques, such as palynology and dendroecology, have limited applicability in some High Arctic regions due to the paucity of higher plants (Gajewski et al., 1995), paleolimnological approaches using diatoms have become especially important for studies of long-term global environmental change.
___________________________
Diatom
A diatom (Neo-Latin diatoma)[a] is any member of a large group comprising several genera of algae, specifically microalgae, found in the oceans, waterways and soils of the world. Living diatoms make up a significant portion of Earth's biomass. They generate about 20 to 50 percent of the oxygen produced on the planet each year,[11][12] take in over 6.7 billion tonnes of silicon each year from the waters in which they live,[13] and constitute nearly half of the organic material found in the oceans. The shells of dead diatoms are a significant component of marine sediment, and the entire Amazon basin is fertilized annually by 27 million tons of diatom shell dust transported by transatlantic winds from the African Sahara, much of it from the Bodélé Depression, which was once made up of a system of fresh-water lakes.
https://en.wikipedia.org/wiki/Diatom
___________________________
Diatom Autecological Responses with Changes To Ice Cover (Diatom-ARCTIC)
1 Mar 2018
Following the polar amplification of global warming in recent decades, we have witnessed unprecedented changes in the coverage and seasonality of Arctic sea ice, enhanced freshwater storage within the Arctic seas, and greater nutrient demand from pelagic primary producers as the annual duration of open-ocean increases. These processes have the potential to change the phenology, species composition, productivity, and nutritional value of Arctic sea ice algal blooms, with far-reaching implications for trophic functioning and carbon cycling in the marine system. As the environmental conditions of the Arctic continue to change, the habitat for ice algae will become increasingly disrupted.
___________________________
Impact of Sea-Ice Dynamics on the Spatial Distribution of Diatom Resting Stages in Sediments of the Pacific Arctic Region
17 June 2021
https://agupubs.onlinelibrary.wiley.com/doi/full/10.1029/2021JC017223
___________________________
Diatom assemblages in Arctic sea ice—indicator for ice drift pathways
1992
https://www.sciencedirect.com/science/article/abs/pii/S0198014906800191
___________________________
Diatoms Are Selective Segregators in Global Ocean Planktonic Communities
2020
https://pubmed.ncbi.nlm.nih.gov/31964765/
___________________________
A review of diatoms found in highly acidic environments
August 2000
https://link.springer.com/article/10.1023/A:1004066620172
___________________________
Diatom morphology and adaptation: Current progress and potentials for sustainable development
2022
https://www.sciencedirect.com/science/article/pii/S2772737822000104
___________________________
Novel oil-associated bacteria in Arctic seawater exposed to different nutrient biostimulation regimes
16 October 2024
https://enviromicro-journals.onlinelibrary.wiley.com/doi/full/10.1111/1462-2920.16688
___________________________
Environmental stressors and zoonoses in the Arctic: Learning from the past to prepare for the future
2024
https://www.sciencedirect.com/science/article/pii/S0048969724070268
___________________________
Major Diatom Microfossils from the Arctic Region: A Review
January 01, 2024
___________________________
Archaea: 27 Characteristics Of These Most Ancient Organisms
January 2, 2020
https://earthlife.net/prokaryotes/archaea
___________________________
Archaeal distribution and abundance in water masses of the Arctic Ocean, Pacific sector
2013
https://www.int-res.com/articles/ame_oa/a069p101.pdf
___________________________
Archaea Family Tree Blossoms, Thanks to Genomics
Jun 1, 2018
Identification of new archaea species elucidates the domain’s unique biology and sheds light on its relationship to eukaryotes.
https://www.the-scientist.com/features/archaea-family-tree-blossoms-thanks-to-genomics-36643
___________________________
Arctic Life/Bacteria
https://arcticbioscan.ca/wiki/w/Arctic_Life/Bacteria
___________________________
The Influence of Vegetation Type on the Dominant Soil Bacteria, Archaea, and Fungi in a Low Arctic Tundra Landscape
01 September 2011
https://acsess.onlinelibrary.wiley.com/doi/abs/10.2136/sssaj2011.0057
___________________________
Archaea in a hyper-arid polar desert
January 12, 2010
https://www.pnas.org/doi/10.1073/pnas.0912316107
___________________________
Archaea and the meaning of life
10 May 2016
https://microbiologysociety.org/publication/past-issues/what-is-life/article/archaea-and-the-meaning-of-life-what-is-life.html
___________________________
Unique archaeal assemblages in the Arctic Ocean unveiled by massively parallel tag sequencing.
26 Mar 2009
https://europepmc.org/article/MED/19322244
___________________________
Ammonia Oxidizing Archaea in Arctic Tundra Soils
2013
https://archaea.univie.ac.at/research/christa-schleper-lab/former-projects/oxidizing-archaea-in-arctic-tundra-soils/
___________________________
Ammonia-oxidizing Archaea in the Arctic Ocean and Antarctic coastal waters
2009
https://www.academia.edu/6716292/Ammonia_oxidizing_Archaea_in_the_Arctic_Ocean_and_Antarctic_coastal_waterse_mi_1974_2434_2445
___________________________
Global warming in the Canadian arctic
November 18, 2013
https://www.sciencedaily.com/releases/2013/11/131118160037.htm
___________________________
Declining fungal diversity in Arctic freshwaters along a permafrost thaw gradient
30 August 2021
https://onlinelibrary.wiley.com/doi/10.1111/gcb.15852
___________________________
Response of an Arctic Sediment Nitrogen Cycling Community to Increased CO2
2013
https://www.deepdyve.com/lp/springer-journals/response-of-an-arctic-sediment-nitrogen-cycling-community-to-increased-nfauxd9uoR
___________________________
Unique archaeal assemblages in the Arctic Ocean unveiled by massively parallel tag sequencing
26 March 2009
https://www.nature.com/articles/ismej200923/
___________________________
Asgard (archaea)
https://en.wikipedia.org/wiki/Asgard_(archaea)
___________________________
Archaeal amoA and ureC genes and their transcriptional activity in the Arctic Ocean
2014 Apr 11
https://www.ncbi.nlm.nih.gov/pmc/articles/PMC3983602/
___________________________
Compendium of 530 metagenome-assembled bacterial and archaeal genomes from the polar Arctic Ocean
15 November 2021
https://www.nature.com/articles/s41564-021-00979-9
___________________________
Bacterial respiration and abundance affect life in the Arctic Ocean
2022
https://www.polar.se/en/news/2022/bacterial-respiration-and-abundance-affect-life-in-the-arctic-ocean/
___________________________
Role for urea in nitrification by polar marine Archaea
2012 Oct 1
https://www.ncbi.nlm.nih.gov/pmc/articles/PMC3497816/
___________________________
Ammonia
Oxidation by the Arctic Terrestrial Thaumarchaeote Candidatus
Nitrosocosmicus arcticus Is Stimulated by Increasing Temperatures
2019
https://www.frontiersin.org/articles/10.3389/fmicb.2019.01571/full
___________________________
Archaeal communities of Arctic methane-containing permafrost
June 2016
https://www.researchgate.net/publication/304032919_Archaeal_communities_of_Arctic_methane-containing_permafrost
___________________________
Archaea vs. Bacteria: What Are the Differences?
July 18, 2021
https://www.treehugger.com/archaea-vs-bacteria-5190902
___________________________
Methanogenic archaea in Arctic soils from Spitsbergen, Norway (78 N)
2006
https://www.academia.edu/21488649/Methanogenic_archaea_in_Arctic_soils_from_Spitsbergen_Norway_78_N_
___________________________
Vertical profile and components of marine planktonic archaea in the Pacific sector of the Arctic Oceean
December 2011
https://ui.adsabs.harvard.edu/abs/2011AGUFMOS31A1605A/abstract
___________________________
Contribution of archaea and bacteria in sustaining climate change by oxidizing ammonia and sulfur in an Arctic Fjord
2020
https://www.sciencedirect.com/science/article/pii/S0888754320320024
___________________________
Archaea in Arctic Thermokarst Lake Sediments
December 2011
https://ui.adsabs.harvard.edu/abs/2011AGUFM.B43C0312M/abstract
___________________________
Arctic Life/Protista
The
kingdom Protista has long been the repository for all life forms that
possess the cellular structures typical of eukaryotes (nucleus,
mitochondria, chloroplasts), but look different from animals, fungi, or
plants. It is now recognized that many of the traditional members of
this kingdom need to be assigned elsewhere. In fact, there is good
agreement that its members need to be subdivided into two groups – the
kingdom Chromista and the kingdom Protozoa. As well, a number of other
"traditional" protists have been assigned to the kingdom Plantae (e.g.,
green algae, red algae) or to the kingdom Fungi (e.g., Pneumocystis)
based on genetic studies. However, because the process of revising the
classification of protists is a work in progress, we have continued to
place all of these groups in a single kingdom, retaining the name
Protista. In an effort to simplify the discussion of this immensely
diverse group of organisms, we have separated information on four
broadly recognized groups of protists: algae, oomycetes, protozoans, and
slime moulds.
Northern Algae & Allies
Three groups
of protists dominate arctic environments: algae, oomycetes, and
protozoans. We have compiled a list of major protist phylums which you
may encounter in the Canadian Arctic. Please explore the pages below to
learn more about protists and their impacts on Northern ecosystems.
Algae
Diatoms
Euglenoids
Green Algae
Brown Algae
Dinoflagellates
Red Algae
Water Moulds - Phylum Oomycota
Freshwater Oomycetes
Marine Oomycetes
Terrestrial Oomycetes
Protozoa
Amoebae
Ciliates
https://arcticbioscan.ca/wiki/w/Arctic_Life/Protista
___________________________
Communities and diversities of bacteria and Archaea in Arctic seawater
2018
http://www.evolutionary-ecology.com/issues/v19/n04/ffar3147.pdf
___________________________
Ecology of the rare microbial biosphere of the Arctic Ocean
December 29, 2009
https://www.pnas.org/doi/10.1073/pnas.0908284106
___________________________
Mapping the Uncharted Diversity of Arctic Marine Microbes

All of life on Earth is divided into three major domains: the Bacteria, Archaea and Eukarya. This is the universal phylogenetic tree based on a gene that we all have, the ribosomal RNA. We (humans) are located in the crown group of animals, but the majority of diversity on this planet is in the microbial (bacterial and archaeal) world. Image adapted from Woese et al. 1990.
___________________________
Quantification of methanogenic Archaea within Baltic Sea copepod faecal pellets
29 September 2020
https://link.springer.com/article/10.1007/s00227-020-03759-x
___________________________
Urea uptake and carbon fixation by marine pelagic bacteria and archaea during the Arctic summer and winter seasons.
2014
How Arctic climate change might translate into alterations of
biogeochemical cycles of carbon (C) and nitrogen (N) with respect to
inorganic and organic N utilization is not well understood. This study
combined 15N uptake rate measurements for ammonium, nitrate, and urea
with 15N- and 13C-based DNA stable-isotope probing (SIP). The objective
was to identify active bacterial and archeal plankton and their role in N
and C uptake during the Arctic summer and winter seasons. We
hypothesized that bacteria and archaea would successfully compete for
nitrate and urea during the Arctic winter but not during the summer,
when phytoplankton dominate the uptake of these nitrogen sources.
Samples were collected at a coastal station near Barrow, AK, during
August and January. During both seasons, ammonium uptake rates were
greater than those for nitrate or urea, and nitrate uptake rates
remained lower than those for ammonium or urea. SIP experiments
indicated a strong seasonal shift of bacterial and archaeal N
utilization from ammonium during the summer to urea during the winter
but did not support a similar seasonal pattern of nitrate utilization.
Analysis of 16S rRNA gene sequences obtained from each SIP fraction
implicated marine group I Crenarchaeota (MGIC) as well as
Betaproteobacteria, Firmicutes, SAR11, and SAR324 in N uptake from urea
during the winter. Similarly, 13C SIP data suggested dark carbon
fixation for MGIC, as well as for several proteobacterial lineages and
the Firmicutes. These data are consistent with urea-fueled nitrification
by polar archaea and bacteria, which may be advantageous under dark
conditions.
https://europepmc.org/article/PMC/PMC4178671
___________________________
Remarkably diverse and contrasting archaeal communities in a large arctic river and the coastal Arctic Ocean
2006
https://www.int-res.com/articles/ame2006/44/a044p115.pdf
___________________________
Marine
Group-II archaea dominate particle-attached as well as free-living
archaeal assemblages in the surface waters of Kongsfjorden, Svalbard,
Arctic Ocean
10 March 2021
https://link.springer.com/article/10.1007/s10482-021-01547-1
___________________________
AMMONIA-OXIDIZING ARCHAEA FROM HIGH ARCTIC SOILS
2011
https://repositorio.ul.pt/bitstream/10451/4027/1/ulfc090822_tm_Ricardo_Alves.pdf
___________________________
The Archaea and the deeply branching and phototrophic bacteria
2001
https://www.semanticscholar.org/paper/The-Archaea-and-the-deeply-branching-and-bacteria-Boone-Castenholz/62d2a26e4afd77c16325adcf73c5df77558213f5
___________________________
Primordial 'Asgard' Lifeform Has Been Successfully Grown in The Lab
17 January 2020

When scientists ran DNA analysis on a sediment core taken from the floor of the Arctic ocean back in 2010, they found something surprising. A previously unknown organism belonging to the strange domain of microbes called Archaea appeared to have genomic characteristics associated with a totally different domain - Eukaryota.
They named their discovery Lokiarchaeota, after the Loki's Castle hydrothermal vent near Greenland where it was found; but doubt shadowed the finding. Could the sample have been contaminated by something else in the core?
Now, thanks to the work of Japanese scientists, those doubts can be put to rest. For the first time, they have isolated Lokiarchaeota, and grown it in a lab.
That means, for the first time, researchers can closely study and interact with living Lokiarchaeota, which could help us to find our very first ancestors on this incredible blue planet. Their research was released last year and has now been published in the journal Nature.
The tree of life, at its base, is divided into three domains. One of those is occupied by bacteria - single-celled microbes that don't have a nucleus or membrane-bound organelles, and get around by waving hair-like structures called flagella. Another is eukaryotes, organisms whose cells have nuclei and membranes. That domain includes us humans, animals, plants, and algae.
And then there are archaea. These are a lot like bacteria, in that they lack nuclei and membrane-bound organelles, and get around using flagella. But there are a few key differences. They divide differently. Their cell walls are made of slightly different stuff. And their RNA is different enough to separate them on the phylogenetic tree.
But then along came Lokiarchaeota - followed by other archaea specimens that had eukaryotic characteristics. These were named Thorarchaeota, Odinarchaeota and Heimdallarchaeota (to follow the same naming convention).
Collectively, they are called the Asgard archaea, and some scientists think they could be the origin of eukaryotic life - perhaps after an Asgard-like archaeon swallowed up a bacterium.
But it's hard to tell without studying the organisms in isolated detail. This is where the Japanese scientists come in. They retrieved a sediment core from the seabed in the Nankai Trough, 2,533 metres (8,310 feet) below sea level, in 2006.
This was before anyone knew about Asgard archaea. Only later, an RNA analysis of their rich sample revealed the presence of a Lokiarchaeota-like organism.
When the team started their work, they didn't know this yet. They carefully cultivated their samples for five years, in a methane-fed continuous-flow bioreactor system designed to mimic the conditions of a deep-sea methane vent. Very slowly, the microbes multiplied.
The next step was to place samples from the bioreactor in glass tubes with nutrients to keep them fed and growing. There they sat for another year, finally starting to develop a very faint population of Lokiarchaeota.
Then, the team invested even more time into isolating, cultivating and growing this slow-dividing population. Common bacteiral populations usually take about half an hour to double. Lokiarchaeota took 20 days.
"Repeated subcultures … gradually enriched the archaeon with extremely slow growth rate and low cell yield," the researchers wrote in their paper.
"The culture consistently had 30-60 days of lag phase and required over 3 months to reach full growth [..] Variation of cultivation temperatures, and substrate combinations and concentrations did not significantly improve the lag phase, growth rate or cell yield."
In all, the experiment took 12 years. The researchers named their cultivated microbe Prometheoarchaeum syntrophicum - after Prometheus, the ancient Greek mythological Titan who was credited with creating humans out of clay.
They made several curious findings. The first is that Prometheoarchaeum would only grow in the presence of one or two other microbes, the archaeon Methanogenium and the bacterium Halodesulfovibrio. When Prometheoarchaeum breaks down amino acids into food, it produces hydrogen, which the other microbes eat.
If the hydrogen was allowed to hang around, the experiments revealed, this could further hinder Prometheoarchaeum's already slow growth, indicating the archaea has a symbiotic relationship with other microbes, in this case syntrophic - meaning the growth of one species or both depends on what the other eats.
Then, when the organism was examined under an electron microscope, it revealed an unusual shape for an archaeon - long tentacles sprouting from its body, within which its partner microbes nestled. When oxygen started increasing on Earth, the researchers hypothesised, this organism could have switched to a relationship with bacteria that used oxygen, increasing its chances of survival, and setting out on the path to eukaryotic life.
And indeed, DNA sequencing revealed the eukaryotic characteristics seen in other Asgard archaea...
Obviously more work needs to be done. Prometheoarchaeum might be quite different from the archaea of billions of years ago. And it's far from definitive proof that eukaryotes evolved from archaea.
https://www.sciencealert.com/primordial-asgard-lifeform-has-been-successfully-grown-in-the-lab
___________________________
Role for urea in nitrification by polar marine Archaea
October 1, 2012
https://www.pnas.org/doi/10.1073/pnas.1201914109
___________________________
State of the Arctic Marine Biodiversity Report: chapter 3.2: Plankton
https://caff.is/marine/marine-monitoring-publications/state-of-the-arctic-marine-biodiversity-report/424-state-of-the-arctic-marine-biodiversity-report-chapter-3-2-plankton
___________________________
Standing stocks and activity of Archaea and Bacteria in the western Arctic Ocean
15 March 2007
https://aslopubs.onlinelibrary.wiley.com/doi/abs/10.4319/lo.2007.52.2.0495
___________________________
Marine archaea and archaeal viruses under global change
2017
https://f1000research.com/articles/6-1241
___________________________
Bacteria and Archaea biodiversity in Arctic terrestrial ecosystems affected by climate change in Northern Siberia
June 6, 2019
https://www.gbif.org/dataset/3f922dfb-0b72-4130-933a-a2f4beb3eef7
___________________________
Archaeal nitrification is a key driver of high nitrous oxide emissions from arctic peatlands
2019
https://pubag.nal.usda.gov/catalog/6536649
___________________________
Anaerobic respiration pathways and response to increased substrate availability of Arctic wetland soils
2020
https://pubs.rsc.org/en/content/articlelanding/2020/em/d0em00124d#!
___________________________
Archaeal nitrification is a key driver of high nitrous oxide emissions from arctic peatlands
2019
https://www.sciencedirect.com/science/article/abs/pii/S0038071719302032
___________________________
Persistence of bacterial and archaeal communities insea ice through an Arctic winter
2010
https://sfamjournals.onlinelibrary.wiley.com/doi/epdf/10.1111/j.1462-2920.2010.02179.x
___________________________
Anaerobic methane oxidizing archaea offset sediment methane concentrations in Arctic thermokarst lagoons
June 20, 2022
https://www.biorxiv.org/content/10.1101/2022.06.20.496783v1
___________________________
Methane munchers: how will increases in ocean temperatures affect methane-eating archaea?
January 31, 2022
https://oceanbites.org/methane-munchers-archaea/
___________________________
Archaea Domain
March 13, 2019
Extreme Microscopic Organisms
https://www.thoughtco.com/archaea-373417
___________________________
Sequenced genes (ureC gene) and a metagenome from Archaea in Arctic and Antarctic marine environments
January 31, 2019
https://www.gbif.org/dataset/53fb0f04-3ba5-4fe8-8ea4-0511914bd0c3
___________________________
How Methanogenic Archaea Contribute to Climate Change
May 6, 2022
https://asm.org/Articles/2022/May/How-Methanogenic-Archaea-Contribute-to-Climate-Cha
___________________________
Archaeal ancestors of eukaryotes: not so elusive any more
05 October 2015
https://bmcbiol.biomedcentral.com/articles/10.1186/s12915-015-0194-5
___________________________
Complete
genome sequence of Arcticibacterium luteifluviistationis SM1504T, a
cytophagaceae bacterium isolated from Arctic surface seawater
26 November 2018
Abstract
Arcticibacterium luteifluviistationis SM1504T was isolated from Arctic surface seawater and classified as a novel genus of the phylum Bacteroides. To date, no Arcticibacterium genomes have been reported, their genomic compositions and metabolic features are still unknown. Here, we reported the complete genome sequence of A. luteifluviistationis SM1504T, which comprises 5,379,839 bp with an average GC content of 37.20%. Genes related to various stress (such as radiation, osmosis and antibiotics) resistance and gene clusters coding for carotenoid and flexirubin biosynthesis were detected in the genome. Moreover, the genome contained a 245-kb genomic island and a 15-kb incomplete prophage region. A great percentage of proteins belonging to carbohydrate metabolism especially in regard to polysaccharides utilization were found. These related genes and metabolic characteristics revealed genetic basis for adapting to the diverse extreme Arctic environments. The genome sequence of A. luteifluviistationis SM1504T also implied that the genus Arcticibacterium may act as a vital organic carbon matter decomposer in the Arctic seawater ecosystem.
https://environmentalmicrobiome.biomedcentral.com/articles/10.1186/s40793-018-0335-x
___________________________
Inspecting the genomic link between Archaea and Eukaryota
2017
https://merenlab.org/2017/01/03/loki-the-link-archaea-eukaryota/
___________________________
Pelagic Archaea in the changing coastal Arctic (PACCA)
2006
https://www.narcis.nl/research/RecordID/OND1339723
___________________________
Microbes found at bottom of ocean are our long-lost relatives
6 May 2015
https://www.newscientist.com/article/mg22630204-000-microbes-found-at-bottom-of-ocean-are-our-long-lost-relatives/
___________________________
Genomic
mechanisms for cold tolerance and production of exopolysaccharides in
the Arctic cyanobacterium Phormidesmis priestleyi BC1401
02 August 2016
https://bmcgenomics.biomedcentral.com/articles/10.1186/s12864-016-2846-4
___________________________
Microbial metabarcoding surveys (Bacteria, Archaea and Eukaryota) of the arctic marine environment
2019
https://obis.org/dataset/7b582a46-8c4d-4616-93d1-1643c3962dd7
___________________________
The Crenarchaeota: Lovers of Extreme Temperatures
January 3, 2020
https://earthlife.net/prokaryotes/crenarchaeota
___________________________
Adaption to life at high salt concentrations in Archaea, Bacteria and Eukarya
17 August 2005
https://aquaticbiosystems.biomedcentral.com/articles/10.1186/1746-1448-1-6
___________________________
How ethane-consuming archaea pick up their favorite dish
July 26, 2021
Scientists decode structure of the enzyme responsible for ethane fixation
U.S.
National Science Foundation-funded researchers have discovered
ethane-degrading microbes at hydrothermal vents in the Gulf of
California's Guaymas Basin at a water depth of 2,000 meters. The results
are published in the journal Science.
"Many new discoveries are
being made in the oceans, and this unique microbial metabolism of a
natural hydrocarbon shows there is still more to learn," says Mike
Sieracki, a program director in NSF's Division of Ocean Sciences.
The
researchers named the microbes Ethanoperedens thermophilum, meaning
"heat-loving ethane-eaters." The ethane is consumed by microorganisms
that form a so-called consortium: archaea, which break down the natural
gas, and bacteria, which couple the electrons released in the process to
the reduction of sulfate, an abundant compound in the ocean.
Some
natural gas components such as propane or butane can be broken down by
bacteria alone. But to degrade the main components of natural gas --
methane and ethane – the two organisms are necessary.
The
discovery of the ethane-eating microbes has brought a new direction to
research in this field. Compared to microbes eating methane, which
normally take a lot of time to grow, these ethane specialists grow much
faster, doubling every week, the scientists found. Biomass production
time is reduced, and reactions are faster in key enzymes catalyzing the
oxidation of natural gas.
The enzyme structure shows how these
microbes from geothermally active vents became specialized in ethane
capture. The work is leading to a deeper understanding of the first step
in ethane degradation, the only source of energy for the archaea, the
scientists say. The finding that the enzyme responsible has specific
traits for recognizing ethane is a big step forward, the researchers
believe.
https://beta.nsf.gov/news/how-ethane-consuming-archaea-pick-their-favorite-dish
___________________________
A New Role for Marine Archaea
Jul 1, 2016
Researchers
discover acetogenesis in archaea, suggesting an important role for
these little-studied organisms in generating organic carbon below the
seafloor.
https://www.the-scientist.com/the-literature/a-new-role-for-marine-archaea-33267
___________________________
Discerning
autotrophy, mixotrophy and heterotrophyin marine TACK archaea from the
North Atlantic TACK archaea from the North Atlantic
2018
https://scholarworks.wm.edu/cgi/viewcontent.cgi?article=2591&context=vimsarticles
___________________________
Nitrification rates in Arctic soils are associated with functionally distinct populations of ammonia-oxidizing archaea
2014
https://meetingorganizer.copernicus.org/EGU2014/EGU2014-12734.pdf
___________________________
Soil
warming and fertilization altered rates of nitrogen transformation
processes and selected for adapted ammonia-oxidizing archaea in
sub-arctic grassland soil
2016
https://dspace.library.uu.nl/handle/1874/359053
___________________________
Response of methanogenic archaea to Late Pleistocene and Holocene climate changes in the Siberian Arctic
2013
https://orgprints.org/id/eprint/22247/
___________________________
Archaea of the Miscellaneous Crenarchaeotal Group are abundant, diverse and widespread in marine sediments
2012
http://dmoserv3.whoi.edu/data_docs/IODP_347/Archaea%20of%20the%20Miscellaneous%20Crenarchaeotal%20Group%20are%20abundant,%20diverse%20and%20widespread%20in%20marine%20sediments.pdf
___________________________
The Polar Night Shift: Annual Dynamics and Drivers of Microbial Community Structure in the Arctic Ocean
April 10, 2021
https://www.biorxiv.org/content/10.1101/2021.04.08.436999v2.full
___________________________
Microbial metagenome-assembled genomes of the Fram Strait from short and long read sequencing platforms
June 30, 2021
https://peerj.com/articles/11721/
___________________________
Mesacs: A Multi-Method Environmental Study Over The Arctic Chukchi Sea
2019-01-01
https://scholarworks.utep.edu/cgi/viewcontent.cgi?article=1048&context=open_etd
___________________________
Soil
warming and fertilization altered rates of nitrogen transformation
processes and selected for adapted ammonia-oxidizing archaea in
sub-arctic grassland soil
2017
https://pure.knaw.nl/portal/en/publications/soil-warming-and-fertilization-altered-rates-of-nitrogen-transfor
___________________________
Anaerobic methane oxidizing archaea offset sediment methane concentrations in Arctic thermokarst lagoons
2022
https://www.reddit.com/r/biorxiv/comments/vh4sy8/anaerobic_methane_oxidizing_archaea_offset/
___________________________
Zeroing in on the last common ancestor of all complex cells
4/10/2016
Your distant ancestors may have belonged to a group called Lokiarchaea.
https://arstechnica.com/science/2016/04/zeroing-in-on-the-last-common-ancestor-of-all-complex-cells/
___________________________
Linkages between geochemistry and microbiology in a proglacial terrain in the High Arctic
04 March 2019
https://www.cambridge.org/core/journals/annals-of-glaciology/article/linkages-between-geochemistry-and-microbiology-in-a-proglacial-terrain-in-the-high-arctic/25FC48996C28206ACF3A36651AED29D6
___________________________
Active lithoautotrophic and methane-oxidizing microbial community in an anoxic, sub-zero, and hypersaline High Arctic spring
2022
https://infoscience.epfl.ch/record/293600
___________________________
Asgard archaea: Diversity, function, and evolutionary implications in a range of microbiomes
2019
https://www.aimspress.com/article/10.3934/microbiol.2019.1.48
___________________________
Biotechnological applications of archaeal enzymes from extreme environments
2018
https://www.scielo.cl/scielo.php?script=sci_arttext&pid=S0716-97602018000100504
___________________________
Oligonucleotide primers, probes and molecular methods for the environmental monitoring of methanogenic archaea
2011
https://sfamjournals.onlinelibrary.wiley.com/doi/full/10.1111/j.1751-7915.2010.00239.x
___________________________
Crenarcaea and Crenarceaota
https://classifyinglivingorganisms.weebly.com/crenarchaea-and-crenarchaeota.html
___________________________
Permafrost
thawing exhibits a greater influence on bacterial richness and
community structure than permafrost age in Arctic permafrost soils
11 Nov 2020
Abstract
Global
warming accelerates permafrost thawing and changes its microbial
community structure, but little is known about how microorganisms in
permafrost with different ages respond to thawing. Herein, we
disentangled the relative importance of permafrost age (young,
medium-aged, old, and ancient, spanning from 50 to 5000 years) and
thawing status (active, transitional, and permanently frozen) in shaping
bacterial community structure using HiSeq sequencing of the 16S rRNA
gene. Our results revealed significant influences of both permafrost
thawing and age on bacterial richness. The bacterial richness was
significantly higher in the young and thawed permafrost, and the
richness increase was mainly observed in Firmicutes, Actinobacteria,
Chloroflexi, Deltaproteobacteria, and Alphaproteobacteria. Permafrost
thawing led to a gradual change in bacterial community structure and
increased contribution of determinism. Permutational analysis of
variance demonstrated that thawing significantly changed bacterial
community structure at all soil ages, but the community convergence due
to permafrost thawing was not observed. Structural equation modeling
revealed that permafrost thawing exhibited a greater influence on both
bacterial richness and community structure than permafrost age. Our
results indicate that microorganisms in permafrost with different ages
respond differently to thawing, which eventually leads to distinct
bacterial community compositions and different organic carbon
decomposition processes in Arctic permafrost.
https://tc.copernicus.org/articles/14/3907/2020/
___________________________
Isolation
and complete genome sequence of the thermophilic Geobacillus sp.
12AMOR1 from an Arctic deep-sea hydrothermal vent site
2016
https://environmentalmicrobiome.biomedcentral.com/articles/10.1186/s40793-016-0137-y
___________________________
Scientists Discover Viruses That Infect Archaea
JUN 28, 2022
https://www.labroots.com/trending/cell-and-molecular-biology/23074/scientists-discover-viruses-infect-archaea
___________________________
Archaea in boreal Swedish lakes are diverse, dominated by Woesearchaeota and follow deterministic community assembly
2020
https://pub.epsilon.slu.se/24548/
___________________________
Microbes in extreme environments
04-23-2019
https://www.encyclopedie-environnement.org/en/life/microbes-in-extreme-environments/
___________________________
Structure
and diversity of bacterial, eukaryotic and archaeal communities in
glacial cryoconite holes from the Arctic and the Antarctic
2012
http://eprints.gla.ac.uk/215731/
___________________________
Importance of particle-associated bacterial heterotrophy in a coastal Arctic ecosystem
2008
https://www.cen.ulaval.ca/warwickvincent/PDFfiles/242.pdf
___________________________
Archaeal
ammonia oxidizers respond to soil factors at smaller spatial scales
than the overall archaeal community does in a high arctic polar oasis
2016
https://research.wit.ie/en/publications/archaeal-ammonia-oxidizers-respond-to-soil-factors-at-smaller-spa-5
___________________________
Vertical stratification of bacteria and archaea in sediments of a small boreal humic lake
2019
https://jyx.jyu.fi/handle/123456789/63621
___________________________
Soil enzymes illustrate the effects of alder nitrogen fixation on soil carbon processes in arctic and boreal ecosystems
28 November 2021
https://esajournals.onlinelibrary.wiley.com/doi/full/10.1002/ecs2.3818
___________________________
Nitrification rates in Arctic soils are associated with functionally distinct populations of ammonia-oxidizing archaea
07 March 2013
https://www.nature.com/articles/ismej201335
___________________________
Examples of Archaebacteria With Their Scientific Name & Classification
April 23, 2018
https://sciencing.com/examples-archaebacteria-scientific-name-classification-16044.html
___________________________
The 'intraterrestrials': New viruses discovered in ocean depths
March 23, 2015
Viruses infect methane-eating archaea beneath the seafloor
https://www.nsf.gov/news/news_summ.jsp?cntn_id=134312
___________________________
Bacteria and Archaea biodiversity in Arctic terrestrial ecosystems affected by climate change in Northern Siberia
13 June 2019
https://ipt.biodiversity.aq/resource?r=methanobase&v=1.4
___________________________
Poles Apart: Arctic and Antarctic Octadecabacter strains Share High Genome Plasticity and a New Type of Xanthorhodopsin
May 6, 2013
https://journals.plos.org/plosone/article?id=10.1371/journal.pone.0063422
___________________________
Extremophiles and the Search for Extraterrestrial Life
5 Jul 2004
https://www.liebertpub.com/doi/abs/10.1089/153110702762027862
___________________________
Never-before-seen microbes in Arctic could aid search for life on Mars
Jun 26, 2022
https://interestingengineering.com/never-before-seen-microbes-in-arctic-could-aid-search-for-life-on-mars
___________________________
Deep Frozen Arctic Microbes Are Waking Up
November 2020
https://www.researchgate.net/publication/346036997_Deep_Frozen_Arctic_Microbes_Are_Waking_Up
___________________________
How Microbes in Permafrost Are Waking Up—and Changing the Atmosphere
April 20, 2025
The Greenhouse Gas Feedback Loop
The release of greenhouse gases from thawing permafrost sets off a troubling feedback loop. As more gases enter the atmosphere, the planet warms even faster, which in turn leads to more permafrost thaw. It’s a cycle that can spiral out of control if left unchecked. Scientists worry that this self-reinforcing loop could push the climate system past a tipping point, where warming accelerates rapidly and irreversibly. The permafrost, once a guardian of ancient secrets, becomes a potential accelerator of climate change—its microscopic inhabitants holding outsized power over the future of Earth’s climate.
___________________________
Holocene dynamics of the Arctic's largest ice shelf
2011
https://www.ncbi.nlm.nih.gov/pmc/articles/PMC3223438/
___________________________
Climate change impacts on methane hydrates
2010
https://worldoceanreview.com/en/wor-1/ocean-chemistry/climate-change-and-methane-hydrates/
___________________________
Huge Ancient Methane Seeps Discovered in the Canadian High Arctic
2017
https://wattsupwiththat.com/2017/04/14/huge-ancient-methane-seeps-discovered-in-the-canadian-high-arctic/
___________________________
Molecular diversity of bacteria in Antarctic and Arctic soils
2015
https://eprints.um.edu.my/15085/
___________________________
Former Navy Officer Tells Us What He Saw While Diving In The Arctic
2022
https://www.youtube.com/watch?v=sqI7YjdQTMg
___________________________
Methane nibbling bacteria are more active during summer
5. May 2021
https://cage.uit.no/2021/05/05/methane-nibbling-bacteria-are-more-active-during-summer/
___________________________
Bacteria sleep 100 million years in the Arctic Ocean
2018
https://scienceinfo.net/bacteria-sleep-100-million-years-in-the-arctic-ocean.html
___________________________
Bacterial Activity at −2 to −20°C in Arctic Wintertime Sea Ice
2004
https://www.ncbi.nlm.nih.gov/pmc/articles/PMC321258/
___________________________
Arctic bacteria found multiplying at record –15 C
2013
Microbes offer clues about possible life on Mars
https://www.cbc.ca/news/science/arctic-bacteria-found-multiplying-at-record-15-c-1.1362819
___________________________
Scientists Found 'Superbugs' in Remote Arctic Wilderness
Jan 29, 2019
The
antibiotic-resistant bacteria were first found in India a decade ago,
and took only a few years to travel 8,000 miles to one of the most
remote parts of the globe.
https://www.popularmechanics.com/science/health/a26069745/superbugs-remote-arctic-wilderness/
___________________________
Arctic avengers: New microbial strains unleashed in the fight against plastic pollution
May 31 2023
https://www.news-medical.net/news/20230531/Arctic-avengers-New-microbial-strains-unleashed-in-the-fight-against-plastic-pollution.aspx
___________________________
Genes linked to antibiotic-resistant superbugs found in Arctic
2019
Discovery of genes, possibly carried by birds or humans, shows rapid spread of crisis
https://www.theguardian.com/society/2019/jan/28/genes-linked-to-antibiotic-resistant-superbugs-found-in-arctic
___________________________
Diversity of planktonic microorganisms in the Arctic Ocean
2015
https://www.sciencedirect.com/science/article/abs/pii/S0079661115001615
___________________________
Arctic bacteria show long evolution in toxic mercury resistance
October 6, 2014
https://phys.org/news/2014-10-arctic-bacteria-evolution-toxic-mercury.html
___________________________
As the Arctic Warms, Soil Bacteria May Diversify and Release More Carbon Dioxide
January 4, 2021
https://sitn.hms.harvard.edu/flash/2021/as-the-arctic-warms-soil-bacteria-may-diversify-and-release-more-carbon-dioxide/
___________________________
Carbon dioxide reaches record high
February 7, 2025
The daily average carbon dioxide (CO₂) at Mauna Loa, Hawaii, was 428.60 parts per million (ppm) on February 6, 2025, the highest daily average on record. The previous record high was 428.59 ppm on April 26, 2024. To find higher levels, one needs to go back millions of years (see inset).
https://arctic-news.blogspot.com/2025/02/carbon-dioxide-reaches-record-high.html
___________________________
Chlamydia-Related Bacteria Discovered in the Deep Arctic Ocean
March 11, 2020
‘What on earth were they doing there?’ one researcher asks
https://www.smithsonianmag.com/smart-news/chlamydia-related-bacteria-discovered-deep-arctic-ocean-180974392/
___________________________
Diversity and biogeography of SAR11 bacteria from the Arctic Ocean
09 September 2019
https://www.nature.com/articles/s41396-019-0499-4
___________________________
Giant Balls of Bacteria Pile Up on Arctic Lake Beds, Ooze Toxin
23 December 2015
Researchers
have found cyanobacteria colonies as big as softballs thriving
unexpectedly on shallow Greenland lake bottoms, exuding liver-damaging
microcystin. Locals dubbed them "sea tomatoes."

Ball-shaped cyanobacteria colonies, nicknamed “sea tomatoes,” litter the bed of a shallow Arctic lake near the shore where sunlight readily penetrates to the bottom.
https://eos.org/articles/giant-balls-of-bacteria-pile-up-on-arctic-lake-beds-ooze-toxin
___________________________
Bacteria for blastoff: Using microbes to make supercharged new rocket fuel
June 30, 2022
Scientists have developed a new class of energy-dense biofuels based on one of nature's most unique molecules
https://www.sciencedaily.com/releases/2022/06/220630160038.htm
___________________________
Genes from Arctic Bacteria Used to Create Vaccines
2010
https://www.discovermagazine.com/planet-earth/genes-from-arctic-bacteria-used-to-create-new-vaccines
___________________________
Heavy-metal resistance in Gram-negative bacteria isolated from Kongsfjord, Arctic
2015 Apr 2
https://pubmed.ncbi.nlm.nih.gov/25942102/
___________________________
Bacteria from the ocean floor could be influencing Arctic weather
2019
https://www.adn.com/alaska-news/science/2019/11/17/bacteria-from-the-ocean-floor-could-be-influencing-arctic-weather/
___________________________
Zhemchug Canyon
Zhemchug
Canyon is an underwater canyon located in the middle of the Bering Sea.
It is the deepest submarine canyon in the world, and is also tied for
the widest.
https://en.wikipedia.org/wiki/Zhemchug_Canyon
___________________________
Category:Submarine canyons of the Bering Sea
https://en.wikipedia.org/wiki/Category:Submarine_canyons_of_the_Bering_Sea
Bering Canyon
Bowie Canyon
Navarin Canyon
Pribilof Canyon
Zhemchug Canyon
___________________________
Council again fails to protect the magnificent Bering Sea canyons
April 14, 2014
https://www.greenpeace.org/usa/council-fails-protect-magnificent-bering-sea-canyons/
___________________________
Plastic Waste Fills Ocean Canyons.
March 15, 2021
The Truth About Plastic Waste in the Worlds Ocean
https://opdera.org/plastic-waste-fills-ocean-canyons/
___________________________
Small but mighty: Arctic bacteria are capable of cleaning up oil spills
October 8, 2019
https://www.mcgilltribune.com/sci-tech/small-but-mighty-arctic-bacteria-are-capable-of-cleaning-up-oil-spills-081019/
___________________________
Climate change: Arctic melt could release bacteria, undiscovered viruses, cold-war era radioactive waste
October 25, 2021
https://www.indiatoday.in/science/story/climate-change-arctic-melting-polar-caps-viruses-radioactive-waste-bacteria-1869061-2021-10-25
___________________________
Frozen rotifer reanimated after 24,000 years in the Arctic tundra
June 7, 2021
Move over water bears, rotifers are pretty tough too.
According to new research, Bdelloid rotifers, a class of microscopic invertebrates, can remain frozen for thousands of years and survive.
Recently, researchers at the Soil Cryology Lab -- part of the Institute of Physicochemical and Biological Problems in Soil Science, located in Russia -- reanimated a Bdelloid rotifer that had been frozen in Siberian permafrost for 24,000 years.

Rotifers are some of the world's oldest asexually producing animals.
https://www.upi.com/Science_News/2021/06/07/russia-bdelloid-rotifers-arctic-permafrost/5451623091577/
___________________________
Novel Insights into Dimethylsulfoniopropionate Catabolism by Cultivable Bacteria in the Arctic Kongsfjorden
2021 Nov 17
https://pubmed.ncbi.nlm.nih.gov/34788071/
___________________________
Metacommunity
dynamics of bacteria in an arctic lake: the impact of species sorting
and mass effects on bacterial production and biogeography
2014
https://www.academia.edu/81648335/Metacommunity_dynamics_of_bacteria_in_an_arctic_lake_the_impact_of_species_sorting_and_mass_effects_on_bacterial_production_and_biogeography
___________________________
Collaborative
study of natural hydrocarbon seep in Canada’s Arctic reveals presence
of methane-degrading bacteria, healthy animal population
May 12, 2021
https://science.ucalgary.ca/news/collaborative-study-natural-hydrocarbon-seep-canadas-arctic-reveals-presence-methane-degrading
___________________________
Bacteria release more carbon from the ocean than previously thought
Deep-sea bacteria dissolve carbon-containing rocks, releasing excess carbon
April 21, 2021
https://beta.nsf.gov/news/bacteria-release-more-carbon-ocean-previously-thought
___________________________
Bacteria feeding on Arctic algae blooms can seed clouds
August 29, 2019

A 2009 phytoplankton bloom in the Bering Sea. Cloud seed bacteria may feed on phytoplankton.
New
research finds Arctic Ocean currents and storms are moving bacteria
from ocean algae blooms into the atmosphere where the particles help
clouds form. These particles, which are biological in origin, can affect
weather patterns throughout the world, according to the new study in
the AGU journal Geophysical Research Letters.
Particles suspended
in air called aerosols can sometimes accelerate ice crystal formation
in clouds, impacting weather climate and weather patterns. Such
ice-nucleating particles include dust, smoke, pollen, fungi and
bacteria. Previous research had shown marine bacteria were seeding
clouds in the Arctic, but how they got from the ocean to the clouds was a
mystery.
In the new study, the researchers took samples of water
and air in the Bering Strait, and tested the samples for the presence
of biological ice nucleating particles. Bacteria normally found near the
sea floor was present in the air above the ocean surface, suggesting
ocean currents and turmoil help make the bacteria airborne.
Oceanic
currents and weather systems brought bacteria feeding off algae blooms
to the sea spray above the ocean's surface, helping to seed clouds in
the atmosphere, according to the new research.
"These special
types of aerosols can actually 'seed' clouds, kind of similar to how a
seed would grow a plant. Some of these seeds are really efficient at
forming cloud ice crystals," said Jessie Creamean, an atmospheric
scientist at Colorado State University in Fort Collins, Colorado, and
lead author on the new study.
Understanding how clouds are seeded can help scientists understand Arctic weather patterns.
Pure
water droplets in clouds don't freeze until roughly minus 40 degrees
Celsius (minus 40 degrees Fahrenheit). They are supercooled below their
freezing point but still liquid. Aerosols raise the base freezing
temperature in supercooled clouds to minus five degrees Celsius (23
degrees Fahrenheit), by providing a surface for water to crystalize on,
and creating clouds mixed with supercooled droplets and ice crystals.
Mixed clouds are the most common type of clouds on the planet and the
best for producing rain or snow.
"Cloud seeds," like the bacteria
found in algae blooms, can create more clouds with varying amounts of
ice and water. An increase in clouds can affect how much heat is trapped
in the atmosphere, which can influence climate. The clouds'
compositions can affect the Arctic's water cycle, changing the amount of
rain and snow that is produced. Increasing the number of clouds and
changing the composition of Arctic clouds also affects northern weather
systems, potentially affecting weather trends worldwide, the authors of
the new study said...
https://phys.org/news/2019-08-bacteria-arctic-algae-blooms-seed.html
___________________________
Polar Cloud Bacteria
In
this research project her team is examining the role that bacteria
could play in polar atmospheric cloud formation and precipitation
processes (on the general topic of bacteria in the atmosphere see:
Biological Ice Nucleators.
As Co-PI with Brian Swanson from the
Laucks Foundation she is investigating whether polar bacteria can
interact with ice surfaces via ice nucleation processes. It is known
that heterotrophic bacteria play a key role in carbon cycling in polar
regions, but little is known about how they interact with their
geological material, the ice itself, be it sea-ice, lake ice, glacier
ice or ice in the atmosphere. The climate of the earth is very sensitive
to the microphysical, radiative and chemical properties of glaciated
clouds (IPCC, 2001). Accurate climate modeling requires that the entire
process from particle formation to cloud drop nucleation be known.
Studies of Arctic ice forming nuclei (IFN) have concluded that marine
bacteria and other particles of biological origin derived from open
leads within the sea-ice cover could be importantfor cloud formation in
the Arctic (Bigg and Leck, 2002), but no investigations have been done
on the ice-nucleating behavior of marine bacteria temporarily enclosed
in sea ice. In Antarctica, devoid of a terrestrial source for IFN,
studies also suggest that biological nuclei play a role in the
formationof coastal clouds and that the surrounding ocean might be their
source (Saxena, 1983). In this project with Brian Swanson, the
researchers are investigating a likely origin of these biological nuclei
– marine psychrophilic bacteria and viruses using a novel freeze tube
technique that studies the freezing of droplets in free-fall.
http://psc.apl.uw.edu/polar-cloud-bacteria/
___________________________
A Constant Flux of Diverse Thermophilic Bacteria into the Cold Arctic Seabed
18 Sep 2009
https://www.science.org/doi/10.1126/science.1174012
___________________________
Dissemination of Multidrug-Resistant Bacteria into the Arctic
https://wwwnc.cdc.gov/eid/article/14/1/07-0704_article
___________________________
Scientists discover bacteria deep beneath the Arctic ice which can interact with humans
March 12, 2020
Bacteria
belong to the family known as 'Chlamydiae', has been discovered deep
beneath the surface of the Arctic ice, revealed scientists
https://www.ibtimes.sg/scientists-discover-bacteria-deep-beneath-arctic-ice-which-can-interact-humans-40840
___________________________
Sunlight, not bacteria, key to CO2 in Arctic
Aug 22, 2014
https://zeenews.india.com/news/eco-news/sunlight-not-bacteria-key-to-co2-in-arctic_956515.html
___________________________
Sun-Loving Bacteria May Be Accelerating Glacial Melting
2021
Scientists
find that cyanobacteria cause sediments on glaciers to clump, thus
absorbing more sunlight. It's not great news for fans of lower sea
levels.
https://www.wired.com/story/sun-loving-bacteria-may-be-accelerating-glacial-melting/
___________________________
Genes from Arctic bacteria used to create new vaccines
July 12, 2010
https://www.nationalgeographic.com/science/article/genes-from-arctic-bacteria-used-to-create-new-vaccines
___________________________
Dissemination of Multidrug-Resistant Bacteria into the Arctic
2008
https://wwwnc.cdc.gov/eid/article/14/1/pdfs/07-0704.pdf
___________________________
Arctic Floating University to focus on Arctic bacteria’s use in medicine, food industry
https://tass.com/science/1447381
___________________________
Tiny globetrotters: Bacteria which live in the Arctic and the Antarctic
December 13, 2017
https://www.sciencedaily.com/releases/2017/12/171213125738.htm
___________________________
Bioprospecting around Arctic islands: Marine bacteria as rich source of biocatalysts
11 December 2015
https://onlinelibrary.wiley.com/doi/abs/10.1002/jobm.201500505
___________________________
Potential Application of Living Microorganisms in the Detoxification of Heavy Metals
27 June 2022
https://www.mdpi.com/2304-8158/11/13/1905/htm
___________________________
U of C alumnus finds high numbers of heat-loving bacteria in cold Arctic Ocean
September 17, 2009
http://esciencenews.com/articles/2009/09/17/u.c.alumnus.finds.high.numbers.heat.loving.bacteria.cold.arctic.ocean
___________________________
Bacteria That Can Break Down Crude Oil And Diesel Found In The Arctic
Aug 17, 2021
https://www.iflscience.com/bacteria-that-can-break-down-crude-oil-and-diesel-found-in-the-arctic-60674
___________________________
Bacteria Produce Electric Current from Sugar
Oct 19, 2018
https://www.advancedsciencenews.com/bacteria-produce-electric-current-from-sugar/
___________________________
Antifreeze protein activity in Arctic cryoconite bacteria
01 February 2014
https://academic.oup.com/femsle/article/351/1/14/501000?login=false
___________________________
Self-healing bacteria bricks could help us build on the moon or Mars
Jan. 20, 2020
This construction Franken-material's alive -- and it could be a more sustainable solution for building.
Future
buildings may be teeming with bacteria, with scientists developing a
hybrid construction material, made of microbes, that may be capable of
repairing itself or even pulling carbon dioxide out of the air.
Wil
Srubar, a professor at the University of Colorado Boulder, headed up an
interdisciplinary team that used bacteria to create a durable "living"
building material that would, among other tricks, be able to heal its
own cracks. That would be an especially valuable asset in extreme
conditions or military structures, the scientists say, as bricks made
from the material could fix themselves after natural disasters or damage
from enemy fire.
"We believe this material is particularly
suitable in resource-scarce environments, such as deserts or the Arctic,
even human settlements on other planets," Srubar, who founded a
living-materials lab at the university that takes inspiration from
nature, told me. "The sky is the limit, really, for creative
applications of the technology."
https://www.cnet.com/science/self-healing-bacteria-bricks-could-help-us-build-on-the-moon-or-mars/
___________________________
Batteries Made of Bacteria?
November 19, 2008
Researchers
believe the energy produced by Geobacteria microbes can be harnessed
for electrical power, environmental remediation and biosensors
https://beta.nsf.gov/news/batteries-made-bacteria
___________________________
Algal Mats May Be a Key to the Arctic Food Web
27 June 2022
Melt ponds in sea ice have thriving algal communities with startlingly high levels of photosynthetic activity.
https://eos.org/articles/algal-mats-may-be-a-key-to-the-arctic-food-web
___________________________
Seasonal Synergy between bacteria and algae in Kobbefjord sea ice
2014
https://asp-net.org/content/seasonal-synergy-between-bacteria-and-algae-kobbefjord-sea-ice
___________________________
Bacteria at Hydrothermal Vents
https://divediscover.whoi.edu/hot-topics/bacteria-at-hydrothermal-vents/
___________________________
Cilia: 'The bouncer' of bacteria
08.09.2017
https://www.innovations-report.com/life-sciences/cilia-the-bouncer-of-bacteria/
___________________________
Methane and Black Carbon Impacts on the Arctic:
2016
Communicating the Science
https://19january2017snapshot.epa.gov/sites/production/files/2016-09/documents/arctic-methane-blackcarbon_communicating-the-science.pdf
___________________________
Phytoplankton enhance Arctic Ocean's ability to soak up carbon dioxide, study finds
July 14, 2020
Stanford University scientists report microalgae have increased by 57 percent over two decades
https://www.foxnews.com/science/phytoplankton-enhance-arctic-oceans-ability-carbon-dioxide
___________________________
Warnings in Sweden about dangerous bacteria in Baltic Sea
July 29, 2019
https://www.rcinet.ca/eye-on-the-arctic/2019/07/29/bacteria-baltic-sea-sweden-vibrio/
___________________________
Last
year, a record number of people in Sweden were infected by the
water-bourne bacteria Vibrio, which can cause serious infection.
July 29, 2019
The
spread of Vibrio is likely to increase as climate change warms up
oceans. Projections show that the Baltic Sea will likely be warmer
during a longer season and further north. Studies from the European
Centre for Disease Prevention and Control show that this increases the
growth of the bacteria Vibrio in the water.
In 2018, 135 people
in Sweden were infected by Vibrio, the highest number since 2004, the
first year the infections had to be reported to the health authorities.
One of the infected people died. If you swim with an open wound and get a
Vibrio infection, you can get blood poisoning. Vibrio can also cause
ear infections and diarrhea if you swallow water with the bacteria in
it.
https://www.eurekaselect.com/article/57124
___________________________
Novel bacteria associated with Arctic seashore lichens have potential roles in nutrient scavenging
2 April 2014
https://cdnsciencepub.com/doi/abs/10.1139/cjm-2013-0888
___________________________
Novel bacteria associated with Arctic seashore lichens have potential roles in nutrient scavenging
2 April 2014
https://www.scienceworldreport.com/articles/5500/20130312/new-bacteria-lake-vostok-actually-contamination-reports.htm
___________________________
Marine bacteria in Canadian Arctic capable of biodegrading diesel and oil
August 11, 2021
https://www.sciencedaily.com/releases/2021/08/210811131602.htm
___________________________
Cryptogams signify key transitions of bacteria and fungi in Arctic sand dune succession
03 February 2020
https://nph.onlinelibrary.wiley.com/doi/10.1111/nph.16469
___________________________
Melting Arctic ice may be causing a deadly virus to spread in marine mammals
November 9, 2019
https://www.cbsnews.com/news/melting-arctic-ice-may-be-spreading-a-deadly-virus-to-spread-in-marine-mammals/
___________________________
Research discovers new bacteria that attach to deep-sea plastics and run through the ocean
May 01, 2022
https://www.aninews.in/news/science/research-discovers-new-bacteria-that-attach-to-deep-sea-plastics-and-run-through-the-ocean20220501144535/
___________________________
Sprawling sponge gardens found deep beneath the Arctic sea ice
February 8, 2022

Scientists discovered a surprisingly rich and densely populated ecosystem on the peaks of extinct underwater volcanoes in the Arctic deep sea.
https://www.cnn.com/2022/02/08/world/arctic-sponge-discovery-scn/index.html
___________________________
Prevalence of potential nitrogen-fixing, green sulfur bacteria in the skeleton of reef-building coral Isopora palifera
26 February 2016
https://aslopubs.onlinelibrary.wiley.com/doi/full/10.1002/lno.10277
___________________________
Meet the Arctic Benthos
https://oceanexplorer.noaa.gov/explorations/02arctic/background/education/media/arctic_benthos.pdf
___________________________
Are Benthic Cyanobacteria a Source of Toxic Blooms and a Threat to Human Health?
10/04/2018
https://coastalscience.noaa.gov/news/are-benthic-cyanobacteria-a-source-of-toxic-blooms-and-a-threat-to-human-health/
____________________________
Nanoparticles kill beneficial Arctic soil bacteria
2011
https://www.adn.com/arctic/article/nanoparticles-kill-beneficial-arctic-soil-bacteria/2011/04/09/
___________________________
Vertical distribution of bacteria in Arctic sea ice
1993
https://www.academia.edu/15065376/Vertical_distribution_of_bacteria_in_arctic_sea_ice
___________________________
Purifying Bad Water with Good Bacteria
April 30, 2013
https://research.umn.edu/inquiry/post/purifying-bad-water-good-bacteria
___________________________
Bacteria clean oil-polluted soil on old military bases
June 18th, 2021
Diesel-polluted
soil from now-defunct military outposts in Greenland can be remediated
using naturally occurring soil bacteria, according to an extensive
five-year experiment in Mestersvig, East Greenland.
https://www.futurity.org/bacteria-diesel-polluted-soil-remediation-2584012/
___________________________
Epithelium-associated
bacteria in the gastrointestinal tract of Arctic charr (Salvelinus
alpinus L.). An electron microscopical study
21 December 2001
https://sfamjournals.onlinelibrary.wiley.com/doi/full/10.1046/j.1365-2672.2001.01246.x
___________________________
Scientists Just Discovered Plastic-Eating Bacteria That Can Break Down PET
10 March 2016
https://www.sciencealert.com/new-plastic-munching-bacteria-could-fuel-a-recycling-revolution
___________________________
The Next Pandemic Could Be Hiding in the Arctic Permafrost
April 2, 2020
Global warming could unearth ancient microbes. Will we be as unprepared as we were for the coronavirus?
https://newrepublic.com/article/157129/next-pandemic-hiding-arctic-permafrost
___________________________
Cold-Loving Bacteria Offer Clues for Life on Mars
May 23, 2013
https://www.livescience.com/34657-coldest-temperature-bacteria-found-in-permafrost.html
___________________________
Alaska’s Rusting Waters: Pristine Rivers and Streams Turning Orange
May 20, 2024
At Least 75 Degraded Sites Spotted Along Brooks Range
Dozens of Alaska’s most remote streams and rivers are turning from a crystal clear blue into a cloudy orange, and the staining could be the result of minerals exposed by thawing permafrost, new research in the Nature journal Communications: Earth and Environment finds.
For the first time, a team of researchers from the National Park Service (NPS), U.S. Geological Survey, the University of California, Davis, and other institutions have documented and sampled some of the impaired waters, pinpointing 75 locations across a Texas-sized area of northern Alaska’s Brooks Range.
These degraded rivers and streams could have significant implications for drinking water and fisheries in Arctic watersheds as the climate changes, the researchers said.
“The more we flew around, we started noticing more and more orange rivers and streams,” said lead author Jon O’Donnell, an ecologist for the NPS’ Arctic Inventory and Monitoring Network. “There are certain sites that look almost like a milky orange juice.
Those orange streams can be problematic both in terms of being toxic but might also prevent migration of fish to spawning areas.”
Visible from space
O’Donnell first noticed an issue when he visited a river in 2018 that appeared rusty despite having been clear the year prior. He began asking around and compiling locations while grabbing water samples when possible in the remote region, where helicopters are generally the only way to access the rivers and streams.
“The stained rivers are so big we can see them from space,” said Brett Poulin, an assistant professor of environmental toxicology at UC Davis who was a principal investigator in the research. “These have to be stained a lot to pick them up from space.”
Poulin, whose expertise is in water chemistry, thought the staining looked similar to what happens with acid mine drainage, except no mines are near any of the impaired rivers, including along the famed Salmon River and other federally protected waters.
One hypothesis is that the permafrost, which is essentially frozen ground, stores minerals and as the climate warmed, the metal ores that were once locked up were exposed to water and oxygen, resulting in the release of acid and metals.
“Chemistry tells us minerals are weathering,” Poulin said. “Understanding what’s in the water is a fingerprint as to what occurred.”
The impacted rivers are on federal lands managed by Bureau of Land Management, Fish and Wildlife Service and NPS, including Gates of the Arctic and Kobuk Valley national parks.
Poulin and Ph.D. candidate Taylor Evinger analyzed initial samples, then collected their own on a trip last August, while others took samples in June and July. This year, they will take three trips during the summer to collect additional samples.
Acidic water releasing metals
Some samples from the impaired waters have a pH of 2.3 compared to the average pH of 8 for these rivers. This means the sulfide minerals are weathering, resulting in highly acidic and corrosive conditions that release additional metals. Elevated or high levels of iron, zinc, nickel, copper and cadmium have been measured.
“We see a lot of different types of metals in these waters,” Evinger said. “One of the most dominant metals is iron. That’s what is causing the color change.”
While O’Donnell first noticed a change in 2018, satellite images have turned up stained waters dating back to 2008.
“The issue is slowly propagating from small headwaters into bigger rivers over time,” he said. “When emergent issues or threats come about, we need to be able to understand them...”
https://caes.ucdavis.edu/news/alaskas-rusting-waters-pristine-rivers-and-streams-turning-orange
___________________________
Alaska’s Arctic waterways are turning orange, threatening drinking water
December 13, 2022
https://www.hcn.org/articles/north-water-alaskas-arctic-waterways-are-turning-orange-threatening-drinking-water/
___________________________
The rusting of northern Alaska streams
February 08, 2024
During these late winter days, researchers who are studying the rusty discoloration of northern Alaska streams are prepping for summer field trips.
Jon O’Donnell of the National Park Service is one of a team of scientists who will float rivers and streams in Kobuk Valley National Park and Noatak National Preserve in 2024.
He and his co-workers will be armed with equipment designed to help understand what is making northern rivers turn orange, and how dangerous it might be to people, plants and fish.
In the past decade, scientists such as Roman Dial of Alaska Pacific University and Paddy Sullivan of the University of Alaska Anchorage noticed on their long traverses that waterways they had remembered to be as clear as gin were suddenly flowing orange.
Some investigation and deep thought has led to this hypothesis: Though rivers and streams of the far North have probably turned rusty naturally to some extent for a long time, “things got more intense after 2018,” said Josh Koch of the U.S. Geological Survey Alaska Science Center in Anchorage.
“It’s not totally unprecedented, but the scale and intensity seem to be something new,” Koch said during a December 2023 presentation at the American Geophysical Union Fall Meeting in San Francisco.
The oranging of northern rivers seems to be related to recent permafrost thaw that has allowed streams to release previously captive iron, trace metals and acid.
“Under colder climates in the past, these minerals were protected from weathering and interactions with groundwater,” O’Donnell said.
O’Donnell, Koch and others with the two agencies had the good fortune of in 2017 setting up a station to monitor stream chemistry and the living creatures present there in a clear tributary of the Akillik River in Kobuk Valley National Park.
When they returned in August 2018, they noticed their clear little creek had turned orange like so many others they had been noticing.
“This seemed like a strange disturbance that we should try and understand. But in general, it seemed anomalous,” O’Donnell said. “I hadn't seen anything like it in the Brooks Range. I figured our data could tell a cool story, or at least provide an interesting anecdote. But I was completely unaware of the scale.”
During that visit by helicopter in 2018, O’Donnell, Koch and USGS biologist Mike Carey noticed “a complete loss of resident fish — like Dolly Varden and slimy sculpin,” Koch said.
The creek had also become more acidic, fed by groundwater seeps with a pH reading of about 2, stronger than most off-the-shelf vinegar. The scientists think the fish may have moved somewhere else as their creek was becoming unlivable.
“We observed a steep decline in stoneflies, mayflies and other aquatic larvae (which are food for fish),” O’Donnell said. “It’s likely that the fish migrated out.”
Researchers have noticed more than 70 orange streams spanning the Brooks Range from the lower Noatak River to the Arctic National Wildlife Refuge in the east. Because the phenomenon can often be seen in a satellite view of an area, O’Donnell and his colleagues found many of those streams changed color in the last 10 years.
Streams have the ability to clear themselves. Sometimes, heavy summer rains can overwhelm the particles of iron and other trace metals, clearing the water while rocks remained stained. Permafrost within and surrounding a stream can also “recover” due to extreme cold conditions or lack of snowfall. That could lock up the reactive minerals.
On their northern explorations in summer 2024, Koch, O’Donnell and other scientists will try to determine how bad the orange streams are for fish and the tiny things they eat. High levels of trace metals like copper, nickel and zinc are not good for living things.
“It seems likely there’s a toxic effect, but we don’t know yet,” Koch said.
https://www.gi.alaska.edu/alaska-science-forum/rusting-northern-alaska-streams
___________________________
New Report: 100% of tested Southcentral Alaska water bodies contain microplastics
January 25, 2024
https://environmentamerica.org/alaska/center/media-center/new-report-100-of-tested-southcentral-alaska-water-bodies-contain-microplastics/
___________________________
Microplastics prevalent in Kenai Peninsula waterways
February 7, 2024
100% of all tested sites in southcentral Alaska contained microplastics, report says
https://www.homernews.com/news/microplastics-prevalent-in-kenai-peninsula-waterways/
___________________________
KENAI RIVER WATERSHED ZINC AND COPPER POLLUTION: A SUMMARY OF DATA ANALYSIS, LITERATURE REVIEW RESULTS, AND SUGGESTED ACTIONS
6/28/2017
http://dec.alaska.gov/media/16761/kenai-river-zinc-and-copper-pollution-study.pdf
___________________________
Discovering microplastics in Alaska, from the highest mountain to pristine waterways across the state
May 18, 2024
Two University of Alaska Fairbanks students are making their way up Denali while sampling for microplastics within the snow covering the 20,310-foot mountain. One of them, Matthew Crisafi-Lurtsema, has been sending back satellite texts, one each day since they flew from Talkeetna to Denali’s Kahiltna Glacier on May 8.
As of May 17, he and Roger Jaramillo are steadily progressing upward while scooping up snow samples along the way. When they return, they will analyze that melted snow for the presence of microplastics, which seem to be present everywhere else on Earth.
That includes lower elevations in Alaska, where a group of scientists from UAF’s Water and Environmental Research Center in 2020 and 2021 sampled snow and freshwater from more than 70 locations on a south-to-north transect, mostly along highways. Their recently published study showed plastic fragments everywhere they sampled, from the Kenai Peninsula to the North Slope.
https://www.adn.com/alaska-news/science/2024/05/18/discovering-microplastics-in-alaska-from-the-highest-mountain-to-pristine-waterways-across-the-state/
___________________________
Microplastics pollution in Alaska
2024
https://ine.uaf.edu/research-highlights/2024/microplastics-pollution/
___________________________
Microplastics found in water bodies across Southcentral Alaska
January 26, 2024
A research project that examined water from places ranging from urban centers to remote and wild sites found tiny bits of plastic in every sample
https://alaskabeacon.com/2024/01/26/microplastics-found-in-water-bodies-across-southcentral-alaska/
___________________________
Microplastics low and high in Alaska
May 20, 2024
https://www.gi.alaska.edu/alaska-science-forum/microplastics-low-and-high-alaska
___________________________
Map Shows Rivers Most at Risk as Drinking Water Warning Issued
Apr 17, 2024
Alaska
In Alaska, the Kobuk River's water quality is threatened by the Ambler Road, a proposed road and mining development that could damage its water quality, the report said. Communities along the river could be threatened. The report urged the Biden Administration to "revoke all permits allowing construction of the road."
https://www.newsweek.com/map-most-endangered-rivers-pollution-climate-change-environment-1891230
___________________________
Contaminants in Alaska’s Water Resources
2016
https://www.uaf.edu/ces/publications/database/insects-pests/contaminants.php
___________________________
New Alaska water quality rules are coming. Here's what that could mean for wastewater systems.
June 19, 2024
https://alaskapublic.org/news/2024-06-19/new-alaska-water-quality-rules-are-coming-heres-what-that-could-mean-for-wastewater-systems
___________________________
EPA threatens to step in if Alaska does not update its water pollution limit
June 7, 2024
https://www.adn.com/alaska-news/2024/06/07/epa-threatens-to-step-in-if-alaska-does-not-update-its-water-pollution-limit/
___________________________
Alaska Nonpoint Source Water Pollution Prevention and Restoration Strategy
May 18, 2020
https://dec.alaska.gov/media/bfbmqp5w/final-ak-fy21-25-nps-strategy.pdf
___________________________
State of Alaska Threatens Suit to Force Feds to Clean Up Contamination Left on ANCSA Lands
December 17, 2021
https://dec.alaska.gov/commish/newsroom/21-11-state-of-alaska-threatens-suit-to-force-feds-to-clean-up-contamination-left-on-ancsa-lands/
___________________________
Lawsuit Aims to Protect Cook Inlet, Belugas from Water Pollution, Noise
May 20, 2025
Gold Mining Exploration Threatens Lake Clark National Park, Beluga Critical Habitat
https://biologicaldiversity.org/w/news/press-releases/lawsuit-aims-to-protect-cook-inlet-belugas-from-water-pollution-noise-2025-05-20/
___________________________
New study shows Red Chris Mine waste dams, waste rock piles are leaking toxicants into the headwaters of transboundary Stikine River system
2025
JUNEAU, ALASKA—A disturbing report recently released by Canadian conservationists has revealed that Canada’s massive Red Chris copper-gold mine, located in Tahltan Territory in northern British Columbia (B.C.), Canada, is contaminating groundwater, creeks, and lakes in the upper reaches of the Iskut River, the largest tributary of the transboundary Stikine River. The Stikine, North America’s fastest free-flowing navigable river, flows into the United States at the community of Wrangell, Alaska. It is a critical salmon producer for both countries, serves as key habitat for a wide array of wildlife, and has been both home and a trade route for Indigenous peoples for thousands of years.
The report details an investigation conducted by Terrace, B.C.-based organization SkeenaWild Conservation Trust, mostly using data that is not readily available and was obtained through Freedom of Information Act requests. Report findings include that critical fish habitat near the mine has been destroyed and the seepage of contaminants like selenium and copper from the Red Chris Mine’s waste facility and waste rock piles is higher than predicted and could negatively impact aquatic life. The levels of selenium detected in fish tissue in nearby lakes are increasing and could be harmful to the fish and to the humans eating them. At elevated levels, selenium can cause mutations and death in fish and other animals. The impacted water bodies are an important source of food, clean water, and ways of life for residents of Iskut and the surrounding communities in Tahltan Territory, Northwestern B.C.
Additionally, according to the report, the toxic seepage at the Red Chris waste facility also poses risks to the stability of the mine waste (“tailings”) dams that are close to 150-feet and 260-feet tall, respectively, and hold in the toxic, acidic waste at the mine. The failure of the Red Chris tailings dams are predicted to significantly deteriorate or destroy fish and wildlife habitat downstream and could result in the loss of human life.
“We’re deeply grateful to the Canadian researchers who worked tirelessly to bring this information to light,” said Salmon Beyond Borders director Breanna Walker. “While the toxic seepage of the Red Chris Mine tailings dams impacts highlighted by the report are localized at this point, it is a cautionary tale. This is exactly why almost every Southeast Alaska municipality and several Tribes have called for a ban on mine waste dams along the Taku, Stikine, and Unuk transboundary salmon rivers. This is not about the U.S. versus Canada; it’s about the chronic problems with modern large-scale mining and the lack of industry-wide standards and polluter pays policies that will adequately protect people and the environment."
The tailings storage facility at the Red Chris Mine, co-owned by Newmont Corporation and Imperial Metals Corporation, has the same design as Imperial Metals’ Mount Polley Mine waste facility that failed in August 2014, sending 10,000 Olympic-sized swimming pools worth (6.6 billion gallons) of toxic sludge into the once salmon-rich Fraser River watershed. But the Red Chris waste facility is over six times larger than Mount Polley’s, and contains acid-generating waste. If and when they fail, the Red Chris Mine waste dams would likely adversely affect aquatic ecosystems and essential fish habitat even more significantly than what occurred at Mount Polley, given the larger volume and acidic nature of the Red Chris Mine waste.
“It’s mind-boggling that mining companies are allowed to build risky earthen mine waste dams in these pristine river valleys in the first place–especially since experts predict all tailings dams will eventually fail. The clean, cold salmon river systems of this region are the true wealth, not specks of gold and a giant lake of acidic mine waste that threatens the health of the entire Stikine-Iskut watershed,” said Salmon Beyond Borders advisor Heather Hardcastle.
SkeenaWild’s report comes in the middle of B.C.’s 30-day comment period, which closes April 10, 2025, on Red Chris co-owners’ proposed change of plans at the mine. Newmont Corporation and Imperial Metals Corporation propose to shift from open-pit mining to underground block-cave mining at Red Chris, to target low-grade ore bodies for copper and gold. Risks and uncertainties associated with block-cave mining include landslides and negative impacts to aquatic ecosystems, on top of the existing issues of toxic seepage and instability at the tailings storage facility as is outlined in the new report.
Background:
There are more than 100 Canadian gold-copper mines in some stage of operation, development, abandonment or exploration in the B.C.-Alaska transboundary region. Alaskans downstream face virtually all of the risks of Canadian mine projects while receiving none of the benefits. Multiple Tribes and almost every Southeast Alaska municipality have called for strong polluter pays laws and a permanent ban on new failure-prone mine waste dams along the transboundary Taku, Stikine, and Unuk Rivers flowing from B.C. into Alaska.
The news that substantive pollution is coming from the Red Chris tailings dams builds on concerns from Alaskans that have been growing for seven decades. Canada’s Tulsequah Chief Mine, of which Teck Resources is the historical owner, has been leaching acid mine contamination, unabated, for almost 70 years into the transboundary Taku River system, which enters the ocean just south of Juneau, Alaska.
Alaskans also learned recently in the media that Canada’s Premier gold mine, whose decades-old mine waste dams are located less than a mile from the Alaska border in the transboundary Salmon River watershed near Hyder, Alaska, was just slapped with tiny fines for “major” permit violations. In several cases, heavy metals in wastewater released from Premier’s tailings dams exceeded permit limits by 660%.
While these instances of B.C.-based mining pollution have occurred on different scales and timelines, they collectively highlight the need for improved mining regulations, including stronger polluter pays laws and increased coordination with Tribes and communities downstream.
https://salmonbeyondborders.org/press-releases/new-study-shows-red-chris-mine-waste-dams-waste-rock-piles-are-leaking-toxicants-into-the-headwaters-of-transboundary-stikine-river-system
___________________________
What’s Behind Chinook and Chum Salmon Declines in Alaska?
August 23, 2022
https://www.fisheries.noaa.gov/feature-story/whats-behind-chinook-and-chum-salmon-declines-alaska
___________________________
What the collapse of salmon populations means for one Alaska family
March 20, 2024
https://www.npr.org/2024/03/20/1236649555/what-the-collapse-of-salmon-populations-means-for-one-alaska-family
___________________________
Amid salmon crash, Alaska’s Yukon River residents say a new pact with Canada leaves them behind
March 19, 2024
https://alaskapublic.org/news/2024-03-19/amid-salmon-crash-alaskas-yukon-river-residents-say-a-new-pact-with-canada-leaves-them-behind
___________________________
Threats to Drinking Water and Public Health in Alaska – The Scope of the PFAS Problem, Consequences of Regulatory Inaction, and Recommendations
Sep 24, 2019
https://www.akaction.org/publications/threats-to-drinking-water-and-public-health-in-alaska-the-scope-of-the-pfas-problem-consequences-of-regulatory-inaction-and-recommendations-3/
___________________________
Anchorage and Fairbanks Area Waters Contaminated with “Forever Chemicals”
February 14, 2023
Alaska Community Action on Toxics (ACAT) conducted independent water quality testing in 2022 that showed PFAS (per- and polyfluoroalkyl substances) contamination in Anchorage lakes as well as in Ship Creek. These results show contamination in lakes used for swimming and fishing. The results also show contamination in Ship Creek downstream from Joint Base Elmendorf and Fort Richardson (JBER), an important urban ecosystem for fish, wildlife, as well as fishing. The samples from 2021 and 2022 revealed the presence of toxic PFAS chemicals in all the water bodies that we tested in both Anchorage and the Fairbanks North Star Borough.
These data emphasize the need for urgent action to protect public health as well as wildlife. The data concerning PFAS in our local lakes are of concern to environmental and public health. The information is a public right-to-know issue.
Our sampling analyses revealed PFAS levels in Anchorage lakes ranging from 10.2 ppt (Sundi Lake) to 952.2 ppt (Lake Spenard). In the Fairbanks North Star Borough, levels ranged from 2.8 ppt (Ballaine Lake) to 179.4 ppt PFAS (Airport Lake). Concentrations in Ship Creek ranged from 4.3 ppt to 32 ppt. Levels of PFAS in Anchorage lakes and Ship Creek are similar to those that triggered fish consumption advisories by the Alaska Department of Fish and Game for certain lakes in the Fairbanks North Star Borough. Levels of PFAS in fish can be several orders of magnitude higher than in the ambient waters because many PFAS are strongly bioaccumulative.
https://www.akaction.org/news/archive-newsroom/anchorage-and-fairbanks-area-waters-contaminated-with-forever-chemicals/
___________________________
PFAS in drinking water and serum of the people of a southeast Alaska community: A pilot study
Mar 29, 2022
https://www.akaction.org/publications/pfas-in-drinking-water-and-serum-of-the-people-of-a-southeast-alaska-community-a-pilot-study/
___________________________
Exposure to polybrominated diphenyl ethers and perfluoroalkyl substances in a remote population of Alaska Natives
Aug 5, 2017
https://www.akaction.org/publications/exposure-to-polybrominated-diphenyl-ethers-and-perfluoroalkyl-substances-in-a-remote-population-of-alaska-natives/
___________________________
Anchorage group releases findings on water contamination in Anchorage
2022
Groups calls for legislators to take action on preventing the spread of PFAS contamination in bodies of water in Alaska
https://www.alaskasnewssource.com/2022/05/10/anchorage-group-releases-findings-water-contamination-anchorage/
___________________________
Annual report cites Alaska’s Susitna River as under threat from development
April 17, 2025
The Susitna is listed among the nation’s 10 most endangered rivers, with the report citing threats posed by the proposed 100-mile West Susitna Access Project
https://alaskabeacon.com/2025/04/17/annual-report-cites-alaskas-susitna-river-as-under-threat-from-development/
___________________________
ALASKA’s IMPAIRED WATERS – 2010
https://dec.alaska.gov/media/16410/2010impairedwaters.pdf
___________________________
Protecting SE Alaska Transboundary Waters
https://dec.alaska.gov/water/transboundary
___________________________
Water Pollution In Alaska: Is It A Concern?
Apr 16, 2025
PFAS contamination in Anchorage and Fairbanks
Alaska's water resources face contamination from various sources, including natural and man-made pollutants. One of the significant concerns is the presence of PFAS (per- and polyfluoroalkyl substances), also known as "forever chemicals," which have been detected in the state's water bodies. PFAS contamination in Anchorage and Fairbanks, two of Alaska's largest cities, has particularly raised alarms among residents and environmental advocates.
In Anchorage, independent water quality testing conducted by Alaska Community Action on Toxics (ACAT) in 2022 revealed PFAS contamination in several lakes and Ship Creek. Lake Spenard and Lake Hood showed the highest PFAS levels, approximately 10 times the health-advisory threshold for drinking water set by the Environmental Protection Agency (EPA). These levels were about 952.2 and 698.7 parts per trillion, respectively. Other Anchorage lakes with PFAS contamination include Little Campbell Lake, a popular gathering site for swimmers, boaters, and fishers, and Sundi Lake, with lower PFAS levels of 10.2 parts per trillion.
Fairbanks, another major Alaskan city, also faces PFAS contamination issues. Airport Lake, located in the Fairbanks North Star Borough, had PFAS levels of 179.4 parts per trillion, while Ballaine Lake showed levels of 2.8 parts per trillion. The city has taken proactive measures to address PFAS contamination since 2015, including capping groundwater wells, installing monitoring wells, and connecting affected properties to city water systems. Despite these efforts, Fairbanks residents like Patrice Lee have expressed concerns about the loss of fishing activities due to PFAS-contaminated water bodies.
The sources of PFAS contamination in Anchorage and Fairbanks are attributed primarily to the use of fire-suppressing foams, as highlighted in ACAT's studies. These foams, commonly used by firefighting agencies and the military, have led to the dispersive use of PFAS in the environment. Additionally, PFAS chemicals are found in everyday items such as nonstick cookware, clothing, and even shampoos, contributing to the widespread presence of these persistent compounds.
The detection of PFAS in Anchorage and Fairbanks waterways has prompted calls for urgent action to protect public health and the environment. ACAT's executive director, Pamela Miller, has emphasized the need for legislation to address PFAS contamination and protect residents' health. Alaska Sen. Jesse Kiehl introduced Senate Bill 67, aiming to enforce a statewide ban on the use of fire-suppressing foam containing PFAS. These efforts underscore the recognition of PFAS as toxic chemicals linked to adverse health outcomes, including liver and kidney damage, reproductive issues, immune system impairment, and certain cancers.
Arsenic in groundwater
Arsenic is a naturally occurring toxic element commonly found in groundwater in Alaska. It is used for a variety of purposes within industry and agriculture, such as wood preservatives and insecticides, and is a byproduct of copper smelting, mining, and coal burning. Inorganic arsenic occurs naturally in the Earth's crust, most commonly as the mineral arsenopyrite. When arsenopyrite oxidizes into its elemental components and enters the groundwater system, the resulting arsenic is toxic to humans.
Soils in some parts of Alaska have high concentrations of inorganic arsenic, which can leach into groundwater and render private well water unsafe for consumption. Arsenic in surface water tends to bind with iron oxide and organic material, making it less likely to reach drinking water sources. However, arsenic also accumulates in food crops grown in arsenic-rich soil or watered with contaminated groundwater. It can be changed into a less toxic organic form by microbes, which can then accumulate in seafood.
Arsenic has been found in groundwater wells in the Fairbanks area, Seward and Kenai Peninsulas, Mat-Su Valley, and Anchorage. Other locations in Alaska are also likely to have arsenic concentrations greater than the EPA limit of 10 parts per billion (ppb) for drinking water. The Alaska Department of Health and Social Services (DHSS) recommends testing private wells annually for arsenic and other contaminants, especially if it is known that there is arsenic in the water from wells in the same watershed.
Arsenic can cause multiple health problems, including gastrointestinal irritation and decreased blood cell production in high-quantity, short-term exposure. Low-quantity, long-term exposure can lead to circulatory, nerve, and skin problems, as well as an increased risk of certain types of cancer.
Radon in water
Water pollution is a pressing issue in Alaska, with various contaminants affecting both surface water and groundwater. While Alaska's water sources are relatively free of radon, other pollutants, such as arsenic, PFAS, and leachate from dumps and landfills, pose significant risks to the state's water quality and the health of its residents.
Radon is a colourless, odourless gas that can be harmful when inhaled or ingested. It is derived from the radioactive decay of naturally occurring uranium in rocks and dirt. While radon is typically associated with air quality, it can also be present in water, particularly groundwater. Inhalation of radon released from water used for household activities like showering can pose health risks.
Although Alaska's water sources have minimal detectable radon, it is important to address this issue to ensure the safety of its residents. Radon in water can increase the risk of lung cancer, as the gas and its radioactive particles can get trapped in the lungs and further decay, causing damage over time. The Alaska Division of Public Health recognises radon as an under-recognised health risk in the state, with many homes exceeding the EPA's safe limit of 4 picocuries per liter of air (pCi/L).
To mitigate the health risks associated with radon in water, testing is crucial. Residents are encouraged to test their homes for radon levels, especially during National Radon Action Month in January when free testing kits are provided. If high radon levels are detected, there are recommended actions to reduce indoor radon concentrations, such as sealing cracks and filling slabs to prevent air from the ground from entering the house.
While radon in water may not be a significant issue in Alaska compared to other contaminants, it is still essential to address this under-recognised health hazard. By raising awareness, promoting testing, and implementing mitigation measures, Alaska can protect its residents from the harmful effects of radon exposure through water sources.
https://shunwaste.com/article/is-there-water-pollution-in-alaska
___________________________
Overview of the Alaskan Layered Pollution and Chemical Analysis (ALPACA) Field Experiment
2024
https://pmc.ncbi.nlm.nih.gov/articles/PMC10928659/
___________________________
Thawing Alaskan permafrost is unleashing more mercury, confirming scientists’ worst fears
Aug 26, 2024
"It has that sense of a bomb that's going to go off."
https://grist.org/indigenous/thawing-alaskan-permafrost-is-unleashing-more-mercury-confirming-worst-fears-of-scientists/
___________________________
Threat: Arctic permafrost melting emits harmful mercury in Alaska’s Yukon River
Aug 16, 2024
Arctic permafrost melting due to climate change releases mercury sequestered for millennia into Alaska’s Yukon River, endangering a vital freshwater source.
https://interestingengineering.com/energy/threat-arctic-permafrost-melting-emits-harmful-mercury-in-alaskas-yukon-river
___________________________
Mining-Related Selenium Contamination in Alaska, and the State of Current Knowledge
https://www.mdpi.com/2075-163X/7/3/46
___________________________
EPA says Red Dog Mine failed to identify hazardous waste for over 4 years
August 9, 2024
The Environmental Protection Agency announced a settlement this week with the operators of the Red Dog Mine for nearly two dozen hazardous waste violations. Records show that Red Dog Mine failed to identify hazardous waste in its laboratory for over four years.
Teck Alaska, Inc. operates the mine, one of the world’s largest producers of lead and zinc located about 80 miles north of Kotzebue.
In June, Teck agreed to pay the EPA over $429,794 for hazardous waste violations spanning from October 2019 until January 2024. EPA representatives said those last four years amount to the largest hazardous waste violation in the mine’s more than 30 years of operating.
An inspection in 1995 revealed violations of a lesser nature. In that case, the two parties reached an informal resolution without any penalties for Teck. According to the EPA, it is the fourth recent violation involving Alaska mines; the others involved gold mines.
A representative from the EPA said that those 20 counts outlined in a consent agreement between the EPA and Teck include Teck’s failure to identify, store, and treat hazardous waste, as well as a failure to properly notify and report hazardous material to the EPA. The agency said that these are “serious violations.”
Kevin Schanilec, a hazardous waste compliance officer for the EPA, said while there have been no identified effects on humans or the environment from the violations, there could have been.
“Acids were stored in containers and a tank; they weren't labeled,” Schanilec said. “If someone didn't know what was in that container, they might have done something with it, or if it got spilled, people wouldn't have known what was in the container.”
The EPA has what’s informally referred to as a “cradle to grave” policy for handling hazardous waste through the Resource Conservation and Recovery Act. According to Schanilec, a mine’s laboratory – which was where the violations occurred – represents the cradle side of a mine’s waste stream. These areas are used primarily to assess core samples to determine their concentrations of particular metals.
A representative from the mining company wrote in an emailed statement that the violations were due to a “different interpretation of EPA requirements for identifying, storing and disposing” of the lab’s sample residuals. “These residuals went through a treatment process in accordance with our permit and regulations and had no negative environmental impact. Teck is updating its operational procedures to align with EPA’s guidance. For context, less than 200 grams of solid residuals per month are generated which is about the weight of 80 pennies,” the representative wrote.
But Schanilec said that isn’t entirely accurate.
“The amount of waste in question was such that, had Teck notified us as is required under the regulations, they would have been a category in a higher category of waste generation that exceeds 1,000 kilograms (2,204 pounds) per month,” Schanilec said. “So the amount of wastes in question were much greater in weight than a stack of pennies.”
The EPA verified that Teck had paid the nearly $430,000 penalty for the violations. The agency said the company has until June 2025 to ensure that their laboratory’s tank and associated piping where hazardous waste is stored is clean and does not have the potential to contaminate the environment.
https://alaskapublic.org/news/2024-08-09/epa-says-red-dog-mine-failed-to-identify-hazardous-waste-for-over-4-years
___________________________
In Red Devil, an old mine's pollution is not enough to doubt Donlin’s promise
October 1, 2019
This is a three-part series reported from a village of 20 people on the Upper Kuskokwim River that stands to gain the most from the proposed Donlin Mine. Many villages in the region are conflicted over the mine. Red Devil was built by mining almost 100 years ago, and now carries a toxic legacy of mine pollution. But to most of its residents, the Donlin Gold mine represents hope. Like so many communities in Alaska, resource extraction is at once a lifeline and a risk...
https://alaskapublic.org/2019-10-01/for-people-who-live-in-remote-red-devil-an-old-mines-toxic-legacy-is-not-enough-to-doubt-donlins-promise
___________________________
Alaska Leads the Nation in Toxic Releases for a Good Reason: Large Mines Like Pebble Are Toxic
Feb 19, 2020
https://inletkeeper.org/alaska-leads-the-nation-in-toxic-releases-for-a-good-reason-large-mines-like-pebble-are-toxic/
___________________________
Alaska’s Bristol Bay at risk from the Pebble Mine
June 24, 2016
https://earthworks.org/blog/bristol-bay/
___________________________
Risks of mining to salmonid-bearing watersheds
1 Jul 2022
https://www.science.org/doi/10.1126/sciadv.abn0929
___________________________
Risks of mining to salmonid-bearing watersheds
2022
https://pmc.ncbi.nlm.nih.gov/articles/PMC10883362/
___________________________
Salmon migration affected by drug pollution in water from antianxiety medication
April 16, 2025
https://www.cnn.com/2025/04/16/science/drug-pollution-affect-salmon-migration/index.html
___________________________
Psychoactive drug pollution makes fish less risk-averse
April 14, 2025
Clobazam, an anti-anxiety drug, is polluting our waterways. A Swedish study found traces of the drug had altered the way wild Atlantic salmon migrate.
A common anti-anxiety drug, which has been found to pollute the world's waterways, seems to be influencing the migration behavior of wild Atlantic Salmon, according to a study out of Sweden.
The study, published in the journal Science, found that wild salmon became less risk-averse when they were exposed to the psychoactive drug clobazam. That, in turn, changed the way the fish migrate.
"[Salmon exposed to clobazam] were more likely to complete their migration to the sea, and they passed through man-made barriers like hydropower dams faster than fish that were not exposed," said Jack Brand at the Swedish University of Agricultural Sciences in Uppsala, the study's lead author.
"While an increase in migration success might initially sound like a positive effect, any disruption to natural behaviors can have negative consequences that ripple across ecosystems," Brand told DW.
Surveys of the world's rivers have found drug contamination in waterways on every continent on Earth — even Antarctica. Almost 1,000 different active pharmaceutical drugs have been detected in environments worldwide, harming biodiversity, ecosystem functioning and public health...
How drugs pollute waterways elsewhere in the world
The study is the latest to highlight the ecological problem of pharmaceutical pollution.
Researchers have so far investigated the effects of over 400 different pharmaceutical compounds in almost 200 different species of aquatic animals.
Pharmaceuticals enter the environment via treated or untreated sewage water, and from discharge of livestock or veterinary wastewater effluents. The drugs accumulate in the bodies and brains of wild animals.
Experiments in Canada in 2006 found that fish populations were being exposed to a common synthetic estrogen used in birth-control pills. Accumulation of the hormone in wild fish led to the feminization of males and the near collapse of local fish populations.
"Many, but not all, of the studies found that the tested drug had an effect on animal behavior," said Sundin.
Given the broad presence of pharmaceutical substances in waterways across the globe, Brand suspects that many different species may be vulnerable to their effects. Studies are showing that pharmaceuticals can move through the entire food chain.
"This can affect not just aquatic life but also land animals that feed on insects or fish from contaminated waterways, showing how far-reaching these effects might be," said Brand...
https://www.dw.com/en/psychoactive-drug-pollution-makes-fish-less-risk-averse/a-72201626
-
New study details mining’s impacts on salmon habitat, even hundreds of miles downstream
July 15, 2022
https://alaskapublic.org/news/2022-07-15/new-study-details-minings-impacts-on-salmon-habitat-even-hundreds-of-miles-downstream
___________________________
NEW REPORT: 80% of Alaska Metal Mines Polluted Water
March 10, 2020
Today Earthworks, along with four Alaska conservation, environmental health and justice organizations, released a report on the extensive record of spills and pollution violations at Alaska’s five major operating hardrock mines: Red Dog, Fort Knox, Pogo, Kensington and Greens Creek.
Metal mining is the leading source of toxic releases in Alaska, as well as the United States overall, posing a significant threat to clean water, clean air and healthy land. Yet that hasn’t prevented an onslaught of attempts to undermine community involvement and rigorous permitting in order to fast-track new mines, such as the controversial Pebble Mine in Bristol Bay. The Trump Administration recently added mining to the Fast Act (FAST-41), and there is an ongoing attempt in Congress to gut the National Environmental Policy Act.
Below are key findings from the report, which is based on information gathered from an extensive review of state and federal documents, news reports and the federal National Response Center database:
100% – All five mines have experienced at least one major spill or other accidental release of hazardous materials such as mine tailings, cyanide solution, diesel fuel and ore concentrate.
80% – Four of the five mines failed to capture or control contaminated mine water, resulting in water quality violations that often occurred over an extended period.
80% – Four out of five mines have been identified by EPA as out of compliance with federal laws to protect clean air or water in the last three years.
40% – Metals pollution from two mines has contaminated public lands designated as National Monuments.
80% – The Environmental Impact Statement (EIS) process at four of the mines underestimated water quality impacts, failing to predict violations of federal and state laws.
https://earthworks.org/releases/new-report-80-of-alaska-metal-mines-polluted-water/
___________________________
New Analysis Examines 8,000 Spills at Alaska’s 5 Largest Mines
Apr 6, 2022
Federal permitting processes for Alaska’s 5 largest mines severely underestimated the risks of spills — more than 300 per year
FAIRBANKS, ALASKA – A groundbreaking analysis released today is the first to compare predicted versus actual spills of hazardous materials at the five largest mining operations in Alaska, and expose the enormous discrepancy between the two.
The analysis found more than 8,150 total spills associated with these five mines between 1995-2020, or approximately 300 spills each year. These mining operation spills released more than 2.3 million gallons and 1.9 million pounds of hazardous materials during that 26-year span. The analysis, conducted by Dr. Susan Lubetkin on behalf of a diverse coalition of tribal and conservation organizations, finds that mining proponents severely underestimated spill risk when they sought federal/state permits. Dr. Lubetkin examined not only the disturbing evidence of spills but also the inaccurate forecasting for industrial hardrock mining across the state.
In their industrial mining permit applications and environmental reports, companies analyzed the likelihood of spills for only three substances, versus the more than 50 different hazardous materials, including extremely hazardous cyanide and hydrochloric acid, that spilled from mining operations. What’s more, three out of five mining companies focused on truck accidents as potential transportation-related spills and only one of those also included risk assessments for slurry pipeline spills. All five companies failed to forecast risks from other causes, such as equipment failure or human error, or even total anticipated spills. In reality, truck accidents represented a mere 114 or 1.4% of the spill incidents from all causes at the five mines...
https://www.npca.org/articles/3109-new-analysis-examines-8-000-spills-at-alaska-s-5-largest-mines
___________________________
Alaska Mining Spills
April 6, 2022
Hardrock mines are large industrial facilities that generate and use large volumes of hazardous and toxic materials which present a significant environmental and public health risk if spilled into the environment. These spills can include processing chemicals (e.g., cyanide solution), ore concentrate (e.g., zinc and lead), fuels (e.g., diesel), mine tailings, blasting agents, water treatment chemicals, and other chemical reagents.
The permitting process is intended to provide decision-makers and the public with accurate information about the potential risks associated with a proposed mine, including any associated pipelines and access roads. Alaska has a long history of mining, and with it, a trove of mine permitting documents and environmental records. This report reviewed state and federal government records for the five major hardrock mining operations in Alaska (Pogo, Kensington, Greens Creek, Fort Knox/True North, and Red Dog), with the following objectives:
https://earthworks.org/resources/alaska-mining-spills/
___________________________
Sullivan Demands Transparency from Canadians on Mine Spill in Yukon Watershed
07.30.24
https://www.sullivan.senate.gov/newsroom/press-releases/sullivan-demands-transparency-from-canadians-on-mine-spill-in-yukon-watershed
___________________________
Opportunity To Protect the Brooks Range From Unnecessary Mining via Ambler Road
Dec 13, 2023
Why we don’t need new mines in remote Alaska for clean energy
Copper:
Copper is primarily used as a conductor in high-voltage electrical transmission lines. The U.S. Geological Survey (USGS), the authority on mining and minerals, has determined and repeatedly confirmed that copper—due to its abundance in the lower 48, notably in less remote and pristine landscapes than the Arctic—is not a critical mineral. Not only do the United States and allied countries have abundant supplies of copper, but this mine would not address global supply chain challenges caused by China’s role as a copper refinery. Additionally, there are less ecologically sensitive places to ethically mine copper, such as Voisey’s Bay Mine in Canada, where Vale has negotiated benefit agreements with the community and opened education centers in the area.
Cobalt:
The Ambler Mining District does not contain any proven economic deposit of cobalt. The mining report for one of four proposed mines in the district previously listed cobalt, but in 2023, the company entirely removed cobalt from its mineral resource estimate. There have also been recent increases in the global supply of cobalt, to the extent that demand is causing low sale price. A new cobalt mine in Idaho was actually suspended due to lack of profitability. Not only that, but there is research underway to find cobalt alternatives, including a recent discovery that lithium-ion cathodes can be made with a cobalt substitute. It would not make sense to build an environmentally harmful road to mine a mineral that may not even be there—and which has unpredictable demand and value.
Germanium:
Trilogy Metals recently announced that there could be a potential for germanium as a byproduct of mining at one of the Ambler mining sites, but this remains another unconfirmed and uncertain resource—and absolutely not enough of a cause to build a road. No economic feasibility study has been completed to determine if the deposit is even profitable to develop, meaning that it could cost more to mine than the potential revenue it could bring in. Additionally, the applicability of germanium has heavily decreased over time, and it currently plays no role in clean energy development.
Zinc:
Zinc is used for galvanizing steel, which is part of a wind turbine. But the U.S gets 66 percent of its supply of processed zinc from Canada, which is both an allied country and a secure supply chain. And while the mining assessment of Ambler Mining District does include zinc, the deposit would produce less than 1 percent of the annual worldwide zinc production and would need to be shipped to East Asia for processing. The primary contention with zinc mining arises from the refining process, nearly 50 percent of which is done in China. Because of this, mining in this region for zinc would do nothing for U.S. mineral independence or supply chain security. Allied countries of the United States have plentiful zinc supplies, and mining at Ambler would not result in any positive gain.
Lead and gold:
Lead is not a critical mineral, and the threats that lead poses to ecosystems and public health through air and water pollution are far too risky. Gold is also not a critical mineral and serves the sole purpose of increasing the wealth for the richest. While gold and lead have been identified in the Ambler Mining District, extracting them would do nothing to advance clean energy, national security, or the United States’ competitiveness in the global supply chain.
https://www.americanprogress.org/article/the-biden-administrations-opportunity-to-protect-the-brooks-range-from-unnecessary-mining-via-ambler-road/
___________________________
Biden administration bans drilling in nearly half of Alaska petroleum reserve in sweeping win for climate advocates
April 19, 2024
https://www.cnn.com/2024/04/19/climate/alaska-drilling-ban-biden-climate/index.html
___________________________
Alaska Metal Mines
March 2020
The track record of impacts
https://www.savetheboundarywaters.org/sites/default/files/resource-file/AK-MINE-POLLUTION-REPORT-2020%20%281%29.pdf
___________________________
Remote Western Alaska, Raising Fears in a Nearby Village
June 18, 2025
Demand for low-carbon nuclear energy could boost uranium prospects on Alaska’s Seward Peninsula. But residents of the small village of Elim fear a mine would pollute the river they depend on.
https://insideclimatenews.org/news/18062025/uranium-demand-fears-remote-western-alaska-village/
___________________________
Metal mining identified as major pollutant
March 19, 2020
https://thecordovatimes.com/2020/03/19/metal-mining-identified-as-major-pollutant/
___________________________
Mining in British Columbia Threatens Transboundary Watersheds, Wildlife, and Indigenous Communities
Dec 07, 2022
https://www.nwf.org/Latest-News/Press-Releases/2022/12-7-22-BC-Mines-Threaten-Wildlife-Watersheds-Indigenous-Communities
___________________________
Alaska gold, copper mine blocked over environmental worries
January 31, 2023
https://apnews.com/article/politics-us-environmental-protection-agency-alaska-business-fish-139ceb6e697c006737d09f984456b0e1
___________________________
Alaska Supreme Court finds former North Pole refinery owner liable for pollution
May 30, 2023
https://alaskabeacon.com/briefs/alaska-supreme-court-finds-former-north-pole-refinery-owner-liable-for-pollution/
___________________________
Mining Companies Polluted Western Waters. Now Taxpayers Have to Pay for the Clean Up.
March 18, 2019
https://www.motherjones.com/environment/2019/03/mining-companies-polluted-western-waters-now-taxpayers-have-to-pay-for-the-clean-up/
___________________________
Hecla Mining fined for hazardous waste management at silver mine in Alaska
June 14, 2023
https://www.mining.com/web/hecla-mining-fined-for-hazardous-waste-management-at-silver-mine-in-alaska/
___________________________
Mine operator sentenced for polluting Alaska River
2016
https://www.justice.gov/usao-ak/pr/mine-operator-sentenced-polluting-alaska-river
___________________________
Press Release: Groups Challenge State of Alaska Over Flawed Mine Water Permit
November 8, 2023
https://seacc.org/press-release-groups-challenge-state-of-alaska-over-flawed-mine-water-permit/
___________________________
After 65 years of waiting, an acid waste-generating abandoned mine in the Taku River watershed may finally be cleaned up.
2022
https://salmonbeyondborders.org/press-releases/after-65-years-of-waiting-an-acid-waste-generating-abandoned-mine-in-the-taku-river-watershed-may-finally-be-cleaned-up
___________________________
All that flows downhill: How mining in Canada threatens downstream communities in Alaska, Washington, Idaho and Montana
Sep 19, 2024
https://www.law.utah.edu/news-articles/all-that-flows-downhill-how-mining-in-canada-threatens-downstream-communities-in-alaska-washington-idaho-and-montana/
___________________________
Gratitude for resolution of mining threat to Skagit Headwaters, but threat of Canadian mines to American rivers remains
Jan 27, 2022
https://conservationnw.org/news-updates/gratitude-for-resolution-of-mining-threat-to-skagit-headwaters-but-threat-of-canadian-mines-to-american-rivers-remains/
___________________________
Could low-carbon hydrogen fuel come from Alaska mines? Researchers are studying it.
December 6, 2024
https://alaskabeacon.com/briefs/could-low-carbon-hydrogen-fuel-come-from-alaska-mines-researchers-are-studying-it/
___________________________
America’s most toxic site is in the Alaskan Arctic
February 28, 2018
In the Alaskan Arctic, Iñupiat sail across seas they’ve navigated for thousands of years in search of a whale to bring home. Polar bears roam atop the frozen ocean while caribou graze on the grassy tundra. Spring bursts forth with a bright spray of flowers, summer beckons long, golden days, and fall oozes with the blood red colors of moss and lichen preparing for winter’s cold blast.
Against this picturesque backdrop, one that colors so many brochures of the Arctic, is Kotzebue, Alaska’s Red Dog Mine, which is making headlines as it does nearly every year for earning the title of America’s most toxic site. National Geographic, for instance, recently ran a story that the coastal Alaskan settlement, which Barack Obama visited during his tour of the Arctic in 2015, is America’s most toxic town, drawing on a November 2017 report published by Forbes. That undesirable position is based the U.S. Environmental Protection Agency’s Toxics Release Inventory (TRI), a database of pollution established in response to citizen pressure stemming from the Union Carbide gas disaster in Bhopal, India in 1984. The TRI covers toxic releases to the land from mostly metal mining operations. 21,629 sites are covered, mostly in the mining, electricity generation, petroleum refining, chemical distribution, and hazardous waste treatment sectors. Importantly, oil and natural gas sites are exempt, a loophole that environmentalists have sought to close for years. If fossil fuel extraction was included, there would probably be many more toxic sites in the Alaskan Arctic. (Researcher Robin du Bois’ survey does a pretty comprehensive job of summing up pollution across the Arctic.)
So, as it has done nearly every year in recent history, Kotzebue’s Red Dog Mine has kept its top-polluter title. The open-pit zinc and lead mine began operations in 1989 and was generating over half of Alaska’s mineral value by the mid-2000s. This remote corner of the Arctic is the world’s single largest source of zinc, a mineral used in things like paints, batteries, and cosmetics. In 2016, the most recent year for which data is available, the mine released over 756 million pounds of material classified as “toxic” into the environment last year. That actually marks a big comedown from 2014, when it released over 1.1 billion pounds of the stuff. The mine’s operator, Teck, a Canadian company that runs Red Dog in a joint venture with NANA, an Alaska Native Regional Corporation, on NANA land claims that “more than 99.95 percent of the total weight reported by Red Dog…is the waste rock and tailings that are safely managed each year at the mine in accordance with State and Federal permits.”
A site-specific EPA report, however, still shows that Red Dog is an extremely risky proposition compared to other mines in Alaska and in the U.S. at large. The numbers also suggest otherwise, with close to 3,000 pounds of zinc and manganese compounds going right into the water and over 223,000 pounds of toxins into the air.
Additionally, an open-access study led by a National Parks Service researcher published last year in the prestigious journal PLoS One found that even though concentrations of zinc, lead, and cadmium along the haul road leading from the mine to the port on the Chukchi Sea had decreased in recent years, they were still elevated. The authors concluded, “While there has been a decrease in deposition, NPS is concerned about the potential for a growing and increasingly bioavailable soil contaminant layer.”
The mine produced an Empire State Building’s worth of pollution, but no dividends
Toxic or not, those 756 million pounds are still pollution. The amount represents all the dirt, rocks, and toxins that have been dredged up in the name of development. The NANA Regional Corporation has profited from the mine, reporting that it has kept approximately $480 million from the $1.3 billion it has received in net proceeds from the mine since operations commenced almost 30 years ago. A little less than half of that amount has been distributed to NANA’s approximately 13,800 shareholders, while another $820 million has been distributed to other Alaska Native Regional Corporations and at-large shareholders. Notably, however, NANA shareholders did not receive a dividend in 2016 “primarily due to reductions in operating income from its oil and gas sector and lower zinc prices.” Economic conditions, however, were apparently not tough enough to stop the release of almost a billion pounds of matter.
In terms of toxic releases, Red Dog Mine far outstrips the next most polluted site in America, the Kennecott Copper Mine outside Salt Lake City, Utah. I crunched the TRI data to show that Red Dog Mine is responsible for half of the total toxic releases of the top 25 most polluting sites in America. Coincidentally, the 760 million pounds released from Red Dog Mine is just a little over the same weight as the Empire State Building, which clocks in at 730 million pounds.
Red Dog Mine also produces the most toxic release per person in the U.S.
The 760 million pounds is being dumped straight onto the Northwest Alaskan Borough, which unsurprisingly takes the title of America’s most toxic county. While the National Geographic article describes the overall amount of toxins flooding the borough, it does not capture the burden shouldered by its residents compared to the rest of the United States. Combining the TRI data with U.S. Census population data from 2015 shows just how extreme the per capita pollution is. Given that only 7,752 people live in the Northwest Arctic Borough, the amount of toxic releases per capita is a smidgen under 100,000 pounds per person. That’s three times higher than the county with the second-highest amount of toxic releases per capita: the aptly-named Eureka, Nevada.
The absurdly high levels of toxic releases per person can also be shown with a scatterplot. The chart below illustrates shows just exactly how much of an outlier the Northwest Arctic Borough is both in terms of total amount of toxic releases and in per capita pollution.
Toxins closer to home: the Great Salt Lake Basin
Most people, including myself, haven’t traveled to Red Dog Mine. For anyone who’s gone on a cross-country road trip, however, you might be more likely to have seen the dusty, salt-strewn deserts of Nevada and Utah, which also rank in the TRI database’s upper echelons.The region’s industrial landscapes generate neon-pink sunsets, crusty, dried-up lake beds, and pyramids of pure white salt. In the Great Basin, everything drains into the ground, and unlike in Alaska, nothing flows out to the sea.
One of the most polluted sites in the area, and in fact the third most toxic location in the entire country, is the Carlin Mine, which adjoins the more extensive (yet less polluting) Barrick Gold Mine. From space, Barrick Gold Mine’s open pit looks like a blackened crater etched into the Earth. The mine also elicits terrible reviews from truck drivers on Google, so this facility isn’t pleasing anybody. A few crop circles, likely growing hay, appear southwest of the two mines, irrigated with water from who knows where (though maybe this Nevadan farmer who accidentally unearthed a 200-degree underground spring, creating a geyser, might have some details). If consumers knew that their food, or at least the food of the animals they eat, was coming from farms located near two of the most toxic sites in America, it’s doubtful they’d want to purchase it.
If this juxtaposition of farming and mining is distasteful, imagine the land you rely on for sustenance being downwind and downstream of an even larger mine emitting hundreds of thousands of pounds of toxins like nickel, cadmium, and mercury compounds each year. That’s basically the kind of environment surrounding Red Dog as Iñupiat hunt, fish, and gather food. You can see in the picture below how the tailings sweep over the snow each winter. The same concerns about polluted food sources might therefore cross the minds of Alaskans living off the land as they go to hunt caribou and ptarmigan and gather berries downstream of a site emitting millions of pounds of toxins like nickel, cadmium, and mercury compounds each year.
https://www.cryopolitics.com/2018/02/28/americas-toxic-site-alaskan-arctic/
___________________________
Alaska Has Some of the Most-Polluted Areas in the Country According to 2019 'State of the Air' Report
April 24, 2019
The American Lung Association “State of the Air” 2019 report found that Alaska has some of the worst air quality in the nation. Many Alaskans are living in areas with unhealthy air with wood-burning stoves and wildfire smoke contributing to poor air quality. These rankings demonstrate a need to work together on solutions to improve the air Alaskans breathe.
The annual air quality “report card” tracks Americans’ exposure to unhealthful levels of ozone or particle pollution, both of which can be deadly. The report also tracked short-term spikes in particle pollution, as these can be extremely dangerous and even lethal.
Alaska has two areas where particle pollution is a problem, both due to wood burning home heating. Data for the 2019 State of the Air report come from air quality monitoring data collected in 2015 – 2017, the most recent years of quality assured data available.
The Mat-Su Borough had a solid drop in unhealthy particle days to 5.3 days in 2015-2017, down from 7.0 in last year’s report. The borough’s annual average particle pollution dropped as well and remains well below the national standard.
The Fairbanks area saw some improvement in air quality, however the particle pollution problem persists. The area worsened to the third most polluted area for short-term particle pollution, but saw a positive uptick to become the third most polluted for annual particle pollution.
Each year, “State of the Air” provides a report card on the two most widespread outdoor air pollutants, ozone pollution, which is not an issue in Alaska currently, and particle pollution, sometimes called soot. The report analyzes particle pollution in two ways: through average annual particle pollution levels and short-term spikes in particle pollution. Particle pollution is dangerous to public health and can increase the risk of premature death and other serious health effects such as lung cancer, asthma attacks, cardiovascular damage, and developmental and reproductive harm.
“Particle pollution is made of soot or tiny particles that come from coal-fired power plants, diesel emissions, wildfires and wood-burning devices. These particles are so small that they can lodge deep in the lungs and trigger asthma attacks, heart attacks and strokes, and can even be lethal,” said Marge Stoneking, Executive Director for the American Lung Association in Alaska...
Top twenty-five most polluted cities for short-term particle pollution
1. Bakersfield, CA
2. Fresno-Madera-Hanford, CA
3. Fairbanks, AK
4. San Jose-San Francisco-Oakland, CA
5. Missoula, MT
6. Yakima, WA
7. Los Angeles-Long Beach, CA
8. Salt Lake City-Provo-Orem, UT
9. Seattle-Tacoma, WA
10. Pittsburgh-New Castle-Weirton, PA-OH-WV
11. Logan, UT-ID
12. Visalia, CA
13. Phoenix-Mesa, AZ
14. El Centro, CA
15. Spokane-Spokane Valley-Coeur d’Alene, WA-ID
15. Sacramento-Roseville, CA
17. Medford-Grants Pass, OR
17. Santa Maria-Santa Barbara, CA
19. Eugene-Springfield, OR
20. Salinas, CA
21. Mat-Su Borough, AK
22. Bend-Prineville, OR
23. Portland-Vancouver-Salem, OR-WA
25. Bismarck, ND (tie)
25. Pocatello, ID (tie)
https://www.lung.org/media/press-releases/sota-2019-alaska
___________________________
Fairbanks Ranks as Most-Polluted City in the Nation
April 18, 2018
ANCHORAGE, AK | April 18, 2018
The American Lung Association’s State of the Air 2018 report shows that Alaska has some of the worst air quality in the nation. Many Alaskans are living in areas with unhealthy air with wood-burning stoves and wildfire smoke contributing to poor air quality. These rankings demonstrate a need to work together on solutions to improve the air Alaskans breathe.
“Far too many Alaskans are living in areas with unhealthy levels of air pollution, which puts our public health at risk for diseases such as lung cancer and asthma,” said Marge Stoneking, Executive Director for the American Lung Association in Alaska. “This report shows that we can, and should do more to improve the air quality in our communities.”
Data for the 2018 State of the Air report come from air quality monitoring data collected in 2014 – 2016, the most recent years of quality assured data available.
Many Alaskans live in areas with unhealthy air at some point during the year. Alaska’s second-largest city, Fairbanks, is now the number one most polluted city for year-round particle pollution and ranks as the number four most polluted city in short-term particle pollution. This change in ranking results from additional data from a monitor in the North Star region of the Borough. In the 2017 State of the Air Report, Fairbanks ranked at #17. Wood-burning stoves in homes continues to be a major source of pollution in the area.
Each year the “State of the Air” provides a report card on the two most widespread outdoor air pollutants, ozone pollution, which is not an issue in Alaska currently, and particle pollution, also called soot. The report analyzes particle pollution in two ways: through average annual particle pollution levels and short-term spikes in particle pollution. Particle pollution is dangerous to public health and can increase the risk of premature death and other serious health effects such as lung cancer, asthma attacks, cardiovascular damage, and developmental and reproductive harm.
https://www.lung.org/media/press-releases/fairbanks-ranks-as
___________________________
Method rapidly determines surface air quality during Alaska wildfires
October 23, 2024
https://www.gi.alaska.edu/news/method-rapidly-determines-surface-air-quality-during-alaska-wildfires
___________________________
In Fairbanks, Alaska, Researchers Unravel Frigid Air Pollution
Sep. 06, 2024
https://news.research.gatech.edu/2024/09/06/fairbanks-alaska-researchers-unravel-frigid-air-pollution
___________________________
Fairbanks' Air Pollution: Why Is It So Deadly?
May 10, 2025
https://shunwaste.com/article/why-is-air-pollution-in-fairbanks-alaska-so-bad
___________________________
Alaska air pollution holds clues for other Arctic climates
March 25, 2022
https://alaskapublic.org/xx-statewide-news/2022-03-25/alaska-air-pollution-holds-clues-for-other-arctic-climates
___________________________
Long-term efforts to clean air in Alaska’s second-largest city are paying off
May 12, 2025
Better wood and better stoves are key components of cleaner air in a cold-weather region where atmospheric inversions trap pollution
https://alaskabeacon.com/2025/05/12/long-term-efforts-to-clean-air-in-alaskas-second-largest-city-are-paying-off/
___________________________
Tour of Fairbanks toxic sites shows need for clean-up
August 21, 2023
https://alaskapublic.org/news/2023-08-21/tour-of-fairbanks-toxic-sites-shows-need-for-clean-up
___________________________
Understanding how Fairbanks pollution differs from that of the Lower 48
April 22, 2024
https://fairair.community.uaf.edu/2024/04/22/understanding-how-fairbanks-pollution-differs-from-that-of-the-lower-48/
___________________________
The most toxic town in America
June 4, 2018
The Environmental Protection Agency named Kotzebue, Alaska, the worst industrially polluted town in the United States earlier this year. The not-so-bragworthy distinction came from an annual EPA data set called the Toxics Release Inventory.
The contamination does not originate within Kotzebue itself. It comes from the Red Dog Mine, located about 80 miles away. The Red Dog Mine produces more than 750 million pounds of toxins annually and is one of the world’s largest lead and zinc mines. While Kotzebue is the town listed on the EPA inventory, the environmental impact may be even stronger in the Native Alaskan villages of Kivalina and Noatak, which are much closer to the mine itself.
“The primary problem is that, due to the huge fugitive dust emissions and releases of toxic chemicals to the streams and rivers downstream from the mine, the lands and waters are contaminated with heavy metals,” says Pamela Miller, executive director of Alaska Community Action on Toxics, a nonprofit advocacy group. “These are lands that have been used for generations by the Native communities in the region for subsistence. So, the gathering of greens and berries, the gathering of medicinal plants, the hunting of animals such as caribou and fish and beluga — all of these are [done] downstream or downwind from the mine.”
Because the community is so remote, there have been no detailed assessments of the mining operations’ impact on public health, although the toxins associated with Red Dog Mine are known to cause kidney disorders and neurological problems.
Miller and her group have been working on this issue since 2004 when they produced an investigative report about the contamination from the mine. They also pursued litigation to control contamination through the Clean Air Act and the Clean Water Act, two pieces of federal legislation that helped reduce the fugitive dust emissions and releases to surface waters.
“They have controlled some of their releases through the creation of storage ponds and tailings, but these simply slow down the releases further downstream,” Miller explains of the mine. “This is a problem that will persist for many generations to come because I don’t believe the corporation will be held accountable for responsible cleanup of this site. It’s a Superfund site in the making.”
In the long term, she says, environmental agencies “need to make sure that when this mine shuts down, the corporation does not leave the land in a contaminated state, so we don’t have contamination in perpetuity.”
People in the community also disagree about the mine’s impact on local jobs. Some claim it creates jobs; others say it destroys them. Miller sides with the latter group.
“This mine actually provides very few jobs to local people, and I think the economic benefits are way overblown,” she says. “I think much of the revenue generated from the mining of heavy metals from the Red Dog Mine actually benefits a foreign corporation based in Canada. I don’t see that the local communities benefit very directly whatsoever.”
https://theworld.org/stories/2018/06/04/most-toxic-town-america
___________________________
The True Cost of Coal
12th August 2019
https://groundtruthalaska.org/articles/CoalTrueCost/
___________________________
Mercury from Coal
12th August 2019
https://groundtruthalaska.org/articles/CoalMercury/
___________________________
Pros and cons of oil drilling in Alaska
https://thinkrealstate.com/pros-and-cons-of-oil-drilling-in-alaska/
___________________________
The Arctic’s Last Frontier: The Environmental Impact of Oil Drilling in Alaska
May 18, 2023
https://ecoadvice.org/oil-drilling-in-alaska/
___________________________
Exxon Valdez oil spill
The Exxon Valdez oil spill was a major environmental disaster that occurred in Alaska's Prince William Sound on March 24, 1989. The spill occurred when Exxon Valdez, an oil supertanker owned by Exxon Shipping Company, bound for Long Beach, California, struck Prince William Sound's Bligh Reef, 6 mi (9.7 km) west of Tatitlek, Alaska at 12:04 a.m. The tanker spilled more than 10 million US gallons (240,000 bbl) (or 37,000 tonnes) of crude oil over the next few days.
https://en.wikipedia.org/wiki/Exxon_Valdez_oil_spill
___________________________
The Disadvantages Of Oil Drilling In Alaska
Updated Mar 24, 2022
https://www.sciencing.com/the-disadvantages-of-oil-drilling-in-alaska-13662686/
___________________________
Deep-sea mining study reveals significant environmental and economic risks to coastal communities and businesses
April 14, 2025
https://phys.org/news/2025-04-deep-sea-reveals-significant-environmental.html
___________________________
Deep-sea mining risks leads study to urge shift to circular solutions
April 14, 2025
https://www.sciencedaily.com/releases/2025/04/250414124214.htm
___________________________
Dangerous and unnecessary: New report finds we shouldn’t mine the deep sea
June 18, 2024
https://environmentamerica.org/alaska/center/media-center/dangerous-and-unnecessary-new-report-finds-we-shouldnt-mine-the-deep-sea/
___________________________
The Unbelievable Dangers of Deep Sea Mining
2024
https://www.americanoceans.org/facts/dangers-deep-sea-mining/
___________________________
Bristol Bay: The Dangers of Mining the Earth
February 24, 2015
https://www.oceanfutures.org/news/blog/bristol-bay-dangers-of-mining-the-earth
___________________________
Norway becomes first country to back deep-sea mining despite environmental concerns
11/01/2024
https://www.euronews.com/green/2024/01/11/norway-becomes-first-country-to-back-deep-sea-mining-despite-environmental-concerns
___________________________
Arctic seabed mining will cause ‘irreversible harm’ to wildlife – Greenpeace
23 September 2024
https://www.independent.co.uk/climate-change/news/norway-arctic-government-norwegian-sea-british-government-b2616060.html
___________________________
Arctic deep sea mining plans halted in Norway
2 December 2024
https://geographical.co.uk/news/arctic-deep-sea-mining-plans-halted-in-norway
___________________________
World famous fjords threatened by toxic waste
18/06/2014
Time may be running out to prevent toxic mining waste from being dumped directly into vulnerable Norwegian fjords – despite warnings from scientists, local inhabitants and the sea-food and tourism industries, warns Naturvernforbundet/Friends of the Earth Norway.
https://friendsoftheearth.eu/news/world-famous-fjords-threatened-by-toxic-waste/
___________________________
An almost completed pollution-recovery cycle reflected by sediment geochemistry and benthic foraminiferal assemblages in a Swedish–Norwegian Skagerrak fjord
2015
https://www.sciencedirect.com/science/article/abs/pii/S0025326X15002337
___________________________
Benthic foraminifera as bio-indicators of chemical and physical stressors in Hammerfest harbor (Northern Norway)
2016
https://www.sciencedirect.com/science/article/abs/pii/S0025326X16307895
___________________________
Fjords create mercury problems
28.01.2019
It has been a mystery why deep-sea fish contain so much mercury in fjords without any known sources of mercury pollution. In fact, fish in a clean fjord like Sognefjorden contain more mercury than fish around the polluted submarine wreck at Fedje. Can it be the fjord itself that is to blame?
https://www.hi.no/en/hi/news/2019/january/fjorden-skaper-kvikksolv-trobbel
___________________________
'One of the most severe spills in Norway': Salmon group pollutes fjord with 35 million plastic pellets
25 April 2025
https://www.intrafish.com/sustainability/one-of-the-most-severe-spills-in-norway-salmon-group-pollutes-fjord-with-35-million-plastic-pellets/2-1-1810814
___________________________
Environmental Contaminants in an Urban Fjord, 2019
2020
https://www.miljodirektoratet.no/globalassets/publikasjoner/m1766/m1766.pdf
___________________________
Assessing Environmental Quality in a Historically Polluted Fjord: A Comparison of Benthic Foraminiferal eDNA and Morphospecies Approaches
30 November 2024
https://agupubs.onlinelibrary.wiley.com/doi/full/10.1029/2023JG007781
___________________________
A historic victory could save Norway’s Førdefjorden
14 March 2025
https://seas-at-risk.org/members-news/a-historic-victory-could-save-norways-fordefjorden/
___________________________
Global Fjords as Minor Sources of Nitrous Oxide to the
Atmosphere
2025
https://agupubs.onlinelibrary.wiley.com/doi/pdf/10.1029/2024GL111624
___________________________
River pollution suffocating the sea, campaigners say
2025
https://www.bbc.com/news/articles/cj0m2vp14qno
___________________________
With deep-sea mining plans in limbo, Norwegian companies fold or dig in
22 Apr 2025
https://news.mongabay.com/2025/04/with-deep-sea-mining-plans-in-limbo-norwegian-companies-fold-or-dig-in/
___________________________
‘Acutely toxic’ mine waste threatens the death of Norway’s fjords
https://icsf.net/newss/acutely-toxic-mine-waste-threatens-the-death-of-norways-fjords/
___________________________
Nordic Mining’s threat to the Førdefjord
January 10, 2024
https://bergensia.com/nordic-minings-threat-to-the-fordefjord/
___________________________
Environmental Scientists Warned of Environment Problems Due to Norway's Deep Sea Mining Plans
Jan 09 2024
https://www.natureworldnews.com/articles/60214/20240109/environmental-scientists-warned-environment-problems-due-norways-deep-sea-mining.htm
___________________________
Environmental Crisis in Norway: Heavy Water Contamination in Nitelva river
June 8, 2025
https://ndc.eu.com/environmental-crisis-in-norway-heavy-water-contamination-in-nitelva-river
___________________________
Norwegian rivers need to be better protected
28.06.2022
When hydroelectric power plants suddenly switch off the water, we risk killing fish fry and other living organisms in rivers. The regulations need to change, say scientists and anglers.
https://norwegianscitechnews.com/2022/06/norwegian-rivers-need-to-be-better-protected/
___________________________
Norway’s Plastic Pollution Crisis
July 8, 2024
Coastal debris highlights the urgent need for global and domestic action against rising plastic waste
https://maritimecompass.com/2024/07/08/norways-plastic-pollution-crisis/
___________________________
Plastic pollution in Norway’s rivers highlights urgent need for cleanup efforts
Friday 9th 2024
https://www.dailynorthern.com/3045/plastic-pollution-in-norways-rivers-highlights-urgent-need-for-cleanup-efforts/
___________________________
The planet has a plastic problem. Norway has a groundbreaking solution
October 29, 2024
https://www.icwa.org/norway-plastic-solution/
___________________________
Oslo takes bold steps to reduce air pollution, improve livability
https://www.unep.org/news-and-stories/story/oslo-takes-bold-steps-reduce-air-pollution-improve-livability
___________________________
Norway Committed $200 Million to Fight Ocean Plastic at the Global Citizen Festival
October 4, 2018
https://www.globalcitizen.org/en/content/norway-200-million-to-ocean/
___________________________
Norway’s environmental performance: “Are we as green as we think we are?”
2022
https://www.oecd.org/en/blogs/2022/04/norways-environmental-performance-are-we-as-green-as-we-think-we-are.html
___________________________
Researchers find microplastics for the first time in the Finnish Sámi waters
4 Feb 2025
https://news.mongabay.com/2025/02/researchers-find-microplastics-for-the-first-time-in-the-finnish-sami-waters/
___________________________
Fjord clean up at the Odda smelter
The Sørfjorden fjord adjacent to the Odda zinc smelter, which was once one of the most heavily polluted marine environments in the world, has been returned to almost pre-industrial conditions through a long-term commitment to environmental protection.
https://www.boliden.com/sustainability/case-studies/fjord-clean-up-at-the-odda-smelter/
___________________________
Sweden: Open pit mine will endanger indigenous lands and the environment – UN experts
10 February 2022
https://www.ohchr.org/en/press-releases/2022/02/sweden-open-pit-mine-will-endanger-indigenous-lands-and-environment-un
___________________________
Widespread waterborne pollution in central Swedish lakes and the Baltic Sea from pre-industrial mining and metallurgy
2009
https://www.sciencedirect.com/science/article/abs/pii/S0269749109000712
___________________________
Sweden cuts back on mining, but could this mean more 'carbon leakage'?
18/10/2021
https://www.euronews.com/green/2021/10/18/sweden-cuts-back-on-mining-but-could-this-mean-more-carbon-leakage
___________________________
It's a journey to the center of the rare earths discovered in Sweden
July 18, 2023
https://www.npr.org/2023/07/18/1187075988/europe-rare-earth-sweden
___________________________
Mining Europe’s biggest rare earth deposit could make life ‘impossible’ for Sámi communities
10/02/2023
The discovery of rare earth minerals has been described as crucial to enable the green transition - but not everyone agrees.
In January, Swedish state-owned mining company LKAB discovered more than 1 million tonnes of rare earth minerals in Kiruna, Sweden’s northernmost city.
These rare earth minerals are key components in everything from electric vehicle batteries to mobile phones to wind turbines. And the discovery of this deposit - just 30 kilometres from the Arctic circle - prompted a slew of celebratory headlines.
Many see the newly found resources as a way of ending Europe’s reliance on Russia and China for the rare earth minerals needed to fuel the green transition.
But it's a different story for the Indigenous Sámi population that lives near the site...
https://www.euronews.com/green/2023/02/11/mining-europes-biggest-rare-earth-deposit-could-make-life-impossible-for-sami-communities
___________________________
The European Commission calls on Sweden to comply with the Water Framework Directive
16/12/2024
https://smartwatermagazine.com/news/european-commission/european-commission-calls-sweden-comply-water-framework-directive
___________________________
Let Our Rivers Run Free: Dam Removal in Sweden | Polluting Infrastructure
https://waterkeeper.org/magazines/climate-solutions/let-our-rivers-run-free-dam-removal-in-sweden-polluting-infrastructure/
___________________________
Many towns in Sweden seek funds to clean up polluted sites
January 15, 2019
https://www.rcinet.ca/eye-on-the-arctic/2019/01/15/sweden-pollution-sites-clean-up-funds-river-waste/
___________________________
Environmental protection of the Arctic – a short history
https://www.amap.no/documents/download/67/inline
___________________________
Alarms: Environmental Requirements Threaten Sweden's Green Metals
October 28 2024
Sweden's large deposits of critical metals are an important piece of the puzzle in the EU's green transition – but today's regulatory framework threatens the extraction. Now, the Swedish Geological Survey (SGU) is sounding the alarm to the government.
https://swedenherald.com/article/alarms-environmental-requirements-threaten-swedens-green-metals
___________________________
How Sweden’s mining sector could lead the way to sustainability
3 July 2019
Materials and mining are crucial to meeting the global 2030 Agenda, but how can the industry meet demand sustainably?
https://www.sei.org/perspectives/how-swedens-mining-sector-could-lead-the-way-to-sustainability/
___________________________
Russian press attacks over alleged Norwegian pollution distracting and ill-informed, say observers
September 9, 2013
https://bellona.org/news/climate-change/2013-09-russian-press-attacks-over-alleged-norwegian-pollution-distracting-and-ill-informed-say-observers
___________________________
Several of Russia's dirtiest rivers are located near the border to Norway
12 November 2021
In the course of the year, pollutants like copper, nickel, mercury, aluminium, as well as other substances, have been found in higher levels than before, and a total of 170 cases of ‘high pollution’ and 106 cases of ‘extremely high pollution’ were recorded in 27 different rivers and lakes.
The situation is of special concern in Pechenga, the district located along the border to Norway and Finland, and rivers like the Khaukilampijoki, Luottnjoki and Kolosjoki are considered among the most dirty in the country.
Most of pollution in the Russian border area is linked with Nornickel, the company that operates the local nickel mines and processing plants. In Zapolyarny, a several thousand square meter reservoir with waste waters from the industrial activities is a serious source of pollution.
The huge reservoir is most likely a key source of pollution for the adjacent rivers. Among them is the Pechenga River that runs into the Barents Sea.
However, amid the worsening state of local rivers, there is an exception. According to researchers, the river of Kolosjoki is now slowly getting cleaner. The positive trend comes after Nornickel in late 2020 closed its old and highly polluting smelter in Nikel.
According to Anatoly Lukin from federal fisheries research institute Glavrybvod, studies of local fish show a considerably lower level of pollutants.
“When remembering what was here 20-25 years ago, the serious industrial pressure, then what we see now is a completely different picture,” he told KN51, a corporate newspaper of Nornickel.
According to the researcher, local fishermen no longer get blue-coloured pike in their nets.
Previously, pike caught in the area had a light blue flesh. “For me, it was an astonishing picture”, Lukin says and adds that foreign colleagues were “shocked” by images of the fish.
The researcher argues that the environmental situation in the Kolosjoki has gradually improved over the last 7-8 years.
“The pike that we now catch in the area is absolutely normal, almost completely healthy fish.”
The Kolosjoki runs through key parts of the recently abandoned industrial areas in Nikel, and researchers will now study the effects on the large volumes of leftover slag on the local ecosystem.
The Kolosjoki runs into the lake of Kustjarvi, which is connected with the Pasvik River, the waterway that separates Russia and Norway.
https://www.thebarentsobserver.com/industry-and-energy/several-of-russias-dirtiest-rivers-are-located-near-the-border-to-norway/138762
___________________________
Industrial pollution in the Russian Arctic is an environmental nightmare: A list of the dirtiest places
November 21, 2023
Several large industries have been operating in the Russian Arctic for decades — many of them dating back to Soviet times — and are having an unprecedentedly destructive impact on the region’s environment. The environmental problems associated with their work in many cases have not been resolved, despite various initiatives to reduce emissions and eliminate accumulated damage.
Against this background, over the past few years, the Arctic zone of Russia (AZRF) has been experiencing a new industrial boom. Industrial projects are being implemented, primarily in the field of natural resource extracion, some of which, due to their scale and enormous capacity, are proudly called megaprojects in Russian government documents.
The Northern Sea Route (NSR) is under development and is the main transport artery via which these megaproject enterprises will operate and export their products. Freight traffic along the NSR is planned to increase from the current 34 million tons per year to 150 and even 216.45 million tons per year in 2030.
On the whole, this concerns the production of oil, liquefied natural gas (LNG) and non-ferrous metals. By 2035, coal production and transportation volumes should also increase sharply. International sanctions have not yet significantly affected the scale of this activity.
This, in turn, raises concerns that — given current policies of the Russian state in the Arctic that have failed to address environmental problems for decades — the implementation of new large-scale projects for its industrial development could lead to the emergence of new environmental hot spots in one of the world’s most vulnerable regions.
In this article we address the current state of the four most problematic industrial clusters in the Russian Arctic from an environmental point of view: the Norilsk Nickel sites in Norilsk and the Murmansk region, as well as mining operations in Vorkuta and the Usinsk region of the Komi Republic, which in 1994 experienced the world’s worst land-based oil spill.
These industries present a bleak example of the consequences we can expect from the commissioning of new mining and processing facilities if Russian environmental policy does not undergo fundamental changes.
Norilsk
Norilsk is a city beyond the Arctic Circle in the Krasnoyarsk region. It finds its origins in the discovery of the Norilsk copper-nickel ore deposit in 1910-20. In 1935, the construction of the city-forming enterprise, the Norilsk Mining and Metallurgical Combine and the village attached to it, began with the labor of Gulag prisoners. In 1953, Norilsk was elevated to the status of a cit. A powerful impetus for its development was the discovery in 1960 of two more large deposits of copper-nickel ores — the Talnakh and Oktyabrsky deposits.
Since 1989, the Norilsk Mining and Metallurgical Combine, as a Polar Branch, became part of Norilsk Nickel joint stock company. Now the plant produces about 85% of Russian nickel and cobalt, about 70% of copper and more than 95% of platinum group metals, as well as silver, selenium, tellurium, and sulfur. At the same time, throughout its history it has been a powerful source of negative impacts for the environment.
Atmospheric emissions
In the spring, Rosprirodnadzor, Russia’s environmental oversight agency, published statistics on air pollution in Russia for 2022. Norilsk took first place among the country’s cities with its emissions of 1,787,000 tons of pollutants into the air, or 10.5% of atmospheric emissions from all stationary sources in the Russian Federation.
According to a Norilsk Nickel report, 1,779,000 tons of emissions were produced by numerous industrial sites at the company’s Polar Division, the vast majority of them being sulfur dioxide, or SO2. According to Rosprirodnadzor, SO2 emissions in Norilsk in 2022 were 1,765,000 tons. Greenpeace emphasizes that the Polar Branch is the world’s largest man-made source of sulfur dioxide pollution.
SO2 is a substance of hazard class 3, according to Russia’s classification system. It persists in the atmosphere from several hours to several days. Its presence in the atmosphere can lead to the formation of other sulfur compounds, which are also harmful to human health, as well as plants and animals.
Among other things, high concentrations of SO2 causes acid rain — as well as fog, snow, hail and other types of precipitation — which burns vegetation and acidifies the soil, which in turn degrades vegetation.
Of the remaining emissions from the Polar Division, heavy metals have the most negative impact on the environment. Specifically, these are nickel and copper, as well as cobalt, arsenic, etc.
Liquid waste
Wastewater from non-ferrous metallurgy also leads to acidification of water bodies. In 2022, these discharges at Norilsk Nickel enterprises amounted to 168 million tons, most of which came from the Polar Division.
In addition, liquid waste can enter the environment during accidental spills. The largest such spill at Norilsk Nickel enterprises occurred on May 29, 2020 on the territory of CHPP-3 in Norilsk. As a result, about 20,000 tons of oil products ended up in the Bezymianny stream and the Daldykan and Ambarnaya rivers. The latter flows into the large lake Pyasino, connected to the Kara Sea. Rosprirodnadzor estimated the damage from this accident at 147.8 billion rubles.
Four years earlier, in 2016, another major spill occurred in Norilsk, albeit on a smaller scale. Contaminated water from the tailings pond of the Nadezhda Metallurgical Plant, owned by the Polar Division, ended up in the Daldykan River. Norilsk Nickel first denied the the accident, admitting to it only a week later.
Lunar landscapes
As a consequence of the industrial activities of the Polar Branch, man-made wastelands, often called lunar landscapes in the media, have become the norm in the vicinity of Norilsk.
Specialists from the Central Siberian Botanical Garden (CSBS, Novosibirsk) determined that the diversity of plant communities in the Norilsk industrial region is 70-80% less than in unpolluted areas of the forest-tundra.
However, according to another study conducted by an international group of scientists from six countries, including Russia, and published in 2020 in the journal Ecology Letters, since the 1960s, when there was a sharp increase in industrial production in Norilsk, about 24 thousand square meters — equivalent to about 3,400 football fields — of boreal forest were destroyed thanks to associated emissions
Not surprisingly, the Polar Branch of Norilsk Nickel was included in the list of enterprises that cause the greatest harm to the environment, compiled in April 2018 by the Ministry of Natural Resources of the Russian Federation, which placed the enterprise in the highest hazard class. According to a 2012 study by the Blacksmith Institute (later renamed Pure Earth), Norilsk was included in the top 10 most polluted places on the planet in 2012.
“Within a radius of 30 kilometers from the city there is not a single living piece of grass or shrub,” said the organization’s founder, Richard Fuller, on the inclusion of Norilsk in the rating. “[Heavy metal] contamination was detected more than 60 kilometers [from the city].”
Emission reduction programs
At the same time, Norilsk Nickel regularly announces the implementation of environmental programs at its production facilities. Thus, in 2017, a program was launched to reduce harmful emissions at all the company’s industrial sites. Emssiosn were to decrease by 75% by 2023 compared to the 2015 level. In 2018, the company announced the imminent launch of another program, as a result of which sulfur dioxide emissions from the Polar Division were to be reduced by 45% by 2023 and by 90% by 2025, also compared to 2015 levels. It was planned to spend about $6 billion on both programs.
“My dream is that Norilsk will become not only a metallurgical, but also a tourist center,” said company president Vladimir Potanin at the time.
However, at the moment, the difference in emissions of the entire Norilsk Nickel between 2022 and the starting year of 2015, when they amounted to 2,063,500 tons, is 244,500 tons — that is less than 12%. As for the program to reduce sulfur dioxide emissions at the Polar Division, the so-called. Sulfur program — it started only recently, on October 25, 2023.
Norilsk Nickel in the Murmansk region
Correspondingly, at the second large industrial site of Norilsk Nickel, the Kola MMC in the Murmansk region, it was still possible to significantly reduce emissions — from 117,000 tons in 2018 to 16,000 tons in 2022. The vast majority of these emissions also consists of sulfur dioxide. However, due to their insignificance compared to the Polar Division, this did not affect the overall statistics of Norilsk Nickel. But this does not mean that the Kola MMC is harmless to the environment.
The Kola MMC spralws two production sites. These are “Pechenganikel” in the village of Nikel and the city of Zapolyarny in the north-west of the region and “Severonikel” in Monchegorsk, 100 km south of Murmansk. In relation to all three settlements of its presence, the company is a city-forming enterprise.
The production facilities of the Kola MMC belong to Pechenganikel and are located in a 25-kilometer strip between the village of Nikel and the city of Zapolyarny. The largest of them is the Severny mine. In addition to that, there is another mine and two quarries. Pechenganikel also includes processing plants, the most famous of which until recently was the smelting shop in the village of Nikel, which was closed in 2020. The plant mines sulfide copper-nickel ores, enriches them and carries out metallurgical processing into matte, an intermediate product, from which nickel, copper, sulfuric acid, and cobalt can then be obtained.
The enterprise in Monchegorsk processes imported high-grade matte. The main products are copper concentrate, nickel anodes, nickel tube furnace powder and sulfuric acid.
Atmospheric emissions
The total peak of emissions from both enterprises occurred in the 80s of the last century, when Pechenganikel alone emitted about 400,000 tons of sulfur dioxide per year into the atmosphere. This led to mass protests by residents of the Norwegian commune of Sør-Varanger, from where the village of Nikel is 30 km in a straight line.
With a general decline in production in the 1990s, emissions from Pechenganikel also decreased and in 2000-2010 stabilized within the range of 100,000-160,000 tons of pollutants per year. However, even then, sulfur dioxide emissions from the site were five to eight times higher than the total SO2 emissions from all sources in Norway, and Pechenganickel continued to be the largest air polluter in the border commune of Sør-Varanger. Other toxic substances released from the site include heavy metals such as cadmium, arsenic and lead.
The latest reduction in emissions from the Kola MMC is also largely due to the closure of production. If from 2018 to 2020 the company’s emissions decreased from 117 to 83 thousand tons, then in 2021 after the closure of the smelting shop in the village of Nikel on December 23, 2020 and the metallurgical shop in Monchegorsk in March 2021, they sharply decreased to 20,000 tons.
In Monchegorsk, the main pollutants emitted into the atmosphere are also sulfur dioxide, nickel and copper.
Manmade wastelands and ‘extremely dirty’ rivers
As in the case of Pechenganickel and the Polar Division, a man-made wasteland has formed and is expanding around the production of Severonickel. Forests in the Monchegorsk region are completely or partially burned as far away as 40 km south of the plant along the Priimandrovskaya Plain, and the soil is poisoned with heavy metals.
A similar situation is observed with water sources. Despite the closure of the smelter in Nikel, the Kola MMC, according to Roshydromet, Russia’s meteorological agency, is still one of the two main polluters in the Pechenga River basin. At the same time, the level of pollution of the Hauki-lampi-joki river in the Pechenga basin in 2022 increased from the level of “dirty” to “extremely dirty” due to the high content of nickel and manganese compounds within the range of 17-28 and 7-13 times the maximum permissible concentrations.
According to Russian legislation, this maximum concentration limit equates to the maximum concentration of chemical elements and their compounds in the environment that does not cause pathological changes or diseases in the human body when exposed to everyday life for a long time. At the same time, the state of plants and animals may be affected by concentrations significantly below the MPC.
In addition, in the Pechenga basin, excess concentrations of copper, mercury, zinc and sulfates are recorded. The content of cresyl dithiophosphate (used in the beneficiation of non-ferrous metal ores) in recent years has reached up to 3-6 MPC.
The water of the Nyuduay River in Monchegorsk from 2017 to 2022 is also assessed by Roshydromet as “dirty”. The main pollutants: nickel and copper compounds, the average annual concentrations of which in the long-term plan varied within the range of 21-54 MPC and 49-96 MPC, and the maximum concentrations were at the level of 31-124 and 93-299 MPC, respectively. There was also an excess of the maximum permissible concentration for the content of compounds of iron, mercury, manganese and sulfates.
Vorkuta
Vorkuta is located 150 km north of the Arctic Circle and 180 km from the coast of the Arctic Ocean. The city owes its appearance to the Pechora coal basin. Coal mining began here in 1931. This was done by the labor of Gulag prisoners. The city itself was founded in 1936.
A whole scattering of mines and settlements appeared around it, the most distant of which is the now-shutteredHalmer-Yu, located approximately 90 km along the highway from the city. All of them are administratively part of the Vorkuta urban district with an area of 24.2 thousand sq. km.
Now there are four coal mines, including the world’s first coal mine beyond the Arctic Circle, Yunyaginsky. At the beginning of the 1990s, there were 13 operating mines.
The Vorkuta urban district is a single-industry town. All operating mines and open-pit mines belong to the city-forming enterprise, the Vorkutaugol joint stock company, the largest mining enterprise in the Russian Federation. Since December 2021, it has been part of Russian Energy Group LLC. In addition, Vorkutaugol includes a central processing plant for the production of coal concentrate, a mechanical plant, a transport enterprise and a number of other production facilities.
Methane emissions
The list of enterprises of hazard class 1, published by the Ministry of Natural Resources and Environment in 2018, included all 5 mines in the Vorkuta region operating at that time, as well as the CHPP-2 power plant.
However, one of these mines, Severnaya, was closed and flooded back in 2016 after two accidents with the release and explosion of methane, which led to the death of 36 people. One of the city’s main air pollutants, CHPP-2, whose high emissions were caused by the combustion of coal, was switched to gas in 2021, as was the entire city’s energy system.
Despite this, Vorkuta, based on the results of 2022, took 8th place in the list of Russian cities with the most polluted air with total emissions of 168 thousand tons.
The vast majority of them — 151 thousand tons — are hydrocarbons without volatile organic compounds. According to this indicator, Vorkuta took fourth place in the country, behind only three districts located in the main coal-mining region of the country — Kuzbass. In one of them, the Mezhdurechensky district, is the largest coal mine in Russia.
These statistics are explained by the fact that coal mining is characterized by high emissions of methane, a greenhouse gas 25 times more potent than carbon dioxide. The Pechora coal basin, which includes the mines of the Vorkuta district (as well as the neighboring urban district of Inta), is characterized by high methane content of coal seams, which varies from 12 to 38 cubic meters per ton. For comparison, the average methane content of coal seams in Poland, the USA and India is 8-13, 7-14 and 5-8 cubic meters per ton respectively.
However, even closed mines produce methane. Thus, in 2019 in the United States, about 200 closed coal mines (with more than 500 operating) produced 8% of the total methane emissions in the country, or about 1% of the total greenhouse gases.
Other negative impacts
Underground coal mining is further characterized by pollution and disturbance of aquifers. Due to the constant pumping of water in mines, it reaches into the deep layers of the rock.
In addition, heavy metals — mercury, lead, cadmium, arsenic, as well as formaldehyde, sulfur, silicon dioxide — enter the atmosphere from mines, coal quarries and dumps. During fires, emissions of volatile organic compounds, soot, ash, carbon dioxide and carbon monoxide and sulfur dioxide are added to this.
Mines, dumps and cuts disrupt the natural profile of the soil, leading to disturbance of the topography and degradation of the vegetation cover. In addition, coal mines easily erode, becoming sources of dust pollution, and are capable of spontaneous combustion.
The Komi government, concerned about the problem of coal dumps around Vorkuta and Inta (another city located in the north of the republic), which began to form in the 1930s, is trying to get them included in the state register of objects of accumulated harm, which may give hope for their reclamation.
Socioeconomic crisis
The adverse environmental consequences of coal mining in the Vorkuta region are accompanied by an acute socio-economic situation. The outflow of residents from here began in 1991, which marked the peak of the city’s population of 117,000 residents. As of 2021, the number of residents had decreased to 57,000people. According to Rosstat, Russia’s statistics bureau, Vorkuta is the fastest dying city in Russia.
Abandoned houses, neighborhoods and villages have become a kind of calling card of the Vorkuta region. On the territory of Vorkuta alone there are about 100 abandoned buildings, 80 of which are apartment buildings. Thus, they smoothly move into the category of objects of accumulated environmental damage.
Another side of this process is the lack of funds to maintain urban infrastructure in proper condition. So it was in 2022, on New Year’s Eve, the city’s wastewater treatment plants collapsed. They were put into operation in 1976 and have never been overhauled since then, and the Vorkuta Vodokanal was declared bankrupt back in 2016. As a result, the contents of the sewer were dumped into a nearby stream for almost three weeks, from where it flowed along the Vorkuta and Usa rivers into the Pechora River, which flows into the Barents Sea.
Usinsk district
The Municipal district of Usinsk with an area of 30.5 thousand square kilometers is also located in the northern part of the Komi Republic. About a third of its territory is located beyond the Arctic Circle. However, the entire district is located in the Pechora basin. In July 2020, it was included in the Arctic Zone of the Russian Federation.
The Usinsk region is the center of oil production in the region. About 70% of all oil in the republic is produced here. It was for this reason that it became infamous in 1994, when it suffered the largest onshore oil spill in world history.
Up to 200 thousand tons of oil spilled from the emergency pipeline. To eliminate the consequences of the accident, Russia had to borrow about $100 million from the World Bank. Work to collect oil that reached the Barents Sea and remediate spill sites was completed only in 2010. According to environmentalists, it will take at least 100 years for the territory to regenerate itself.
However, oil spills have occurred here regularly before. They still occur regularly, although there have been none of comparable scale.
The last major spill was recorded on July 2. A forest area with a total area of over 1.2 thousand hectares was damaged. Oil-containing liquid entered the Kolva River. Cleaning up the consequences of the spill took several weeks.
Controversial statistics
What complicates the situation is that statistics on oil spills vary greatly. Thus, according to the report of the Ministry of Natural Resources of Komi, in 2019, 22 accidents involving environmental pollution with oil products occurred in the republic, and in 2020, 38 accidents occurred, as a result of which 13.6 hectares of land were contaminated.
At the same time, the Federal Ministry of Natural Resources reports 17,000 accidents with oil spills in Russia in 2019 — equaling 46.5 accidents per day. Of these, 10,500 occurred on oil pipelines. These figures are based on statistics collected by the Central Dispatch Directorate of the Fuel and Energy Complex of Russia, which registers such accidents. For comparison, Rosprirodnadzor recorded only 819 oil spills across the country in the same year. In the covid year of 2020, according to the Central Dispatch Department of the Fuel and Energy Complex, the number of oil spills on pipelines was 8,600 thousand.
At the same time, Lukoil, which owns most of the fields in Komi, is the second largest oil spilling company in Russia with 1,508 oil spills in 2018 alone.
Considering the above, as well as the fact that in 2019-2020, 2.5-2.6% of Russian oil was produced in the region, the data from the Komi Ministry of Natural Resources look greatly underestimated.
Oil spills are profitable
According to estimates by the Central Dispatch Department of the Fuel and Energy Complex, 90% of Russia’s oil spills at pipelines occur due to pipe corrosion.
“We have an unspoken agreement that oil companies do not invest money in accident prevention, infrastructure, or liquidation of consequences — and thus reduce the cost of oil. And it is becoming more competitive in the international market,” says Ivan Ivanov, chairman of the Committee for the Rescue of Pechora, adding that such tactics are beneficial to the state.
In addition to this, information about oil production and its logistics in Russia is becoming harder to obtain. On February 22, 2023, a law was passed allowing the government to suppress any official statistics.
Since March 2023, Rosstat has stopped publishing oil production data in its official report. Also, beginning March 2023, the publication of monthly data on oil production (including gas condensate) in physical terms ceased. The secrecy of such information further limits the assessment of environmental risks in the Russian oil production sector.
In the meantime, according to the Komi Ministry of Natural Resources, more than 90% of the entire oil-contaminated territory of the region is located in the Usinsk region.
According to Roshydromet, in 2022 the water quality of the rivers in the river basin. Pechora continued to be assessed across a wide range from “slightly polluted” to “dirty”. The highest pollution of river water with oil products was recorded in 2022 at the mouth of the Pechora River above the city of Naryan-Mar (i.e. downstream of the main oil production facilities) in the amount of up to 4 MAC. Considering the situation with oil spill statistics, the question arises how different they are from the real state of affairs.
What’s next?
This is not a complete list of long-standing environmental hot spots in the Russian Arctic. Areas of severe pollution and disturbance of the natural environment are located in four more settlements in the Murmansk region, in the area of Arkhangelsk and Severodvinsk in the Arkhangelsk region, around the Deputatsky tin deposit in Yakutia, and so on. In particular, the neighboring Ukhta district in the Komi Republic and a number of territories of the Nenets Autonomous Okrug adjacent to both of them suffer from severe pollution with oil products.
Even though territories with a heavily disturbed and polluted environment are more often found in the European part of the Russian Arctic due to its greater development, they exist in every Arctic region of the country.
At the same time, emissions into the atmosphere from the Arctic sites of Norilsk Nickel and Gazprom alone are greater than those of the entire industry of Alaska and the Arctic zone of Canada combined.
However, the cessation of operation of a particular production does not mean that it automatically ceases to threaten the environment, and that nature around it is instantly restored. Thus, the tailings dump of the Deputatsky deposit, which ceased operation back in 1997, is still a serious source of contamination of nearby areas with iron and manganese.
Several new ones may soon be added to this list of environmental hot spots, including the Syradasaysky coal mine in Taimyr, which began operations this year. It is planned that when it reaches full capacity, 12 million tons of coal per year will be shipped from it.
Another candidate is the Vostok Oil project, unprecedented in terms of oil production volumes, owned by Rosneft — the company that, according to Greenpeace, holds the record for oil spills in Russia (4,253 pipeline spills in 2018). When reaching full capacity, Vostok Oil would ship 100 million tons of oil per year.
Considering the current strategy for the development of the Russian Arctic, based on the exploitation of natural resources, but not on environmental protection, there may be much more such installations.
https://bellona.org/news/industrial-pollution/2023-11-industrial-pollution-in-the-russian-arctic-is-an-environmental-nightmare-a-list-of-the-dirtiest-companies
___________________________
Russian officials name most polluted regions
June 13, 2019
https://bellona.org/news/industrial-pollution/2019-06-russias-murmansk-region-among-countrys-10-most-polluted-says-government-agency
___________________________
Quantification of Natural Backgrounds and Anthropogenic Contaminants in a Pristine Arctic Environment: the Anadyr River Basin, Chukotka Peninsula, Russia
1999
https://www.sciencedirect.com/science/article/abs/pii/S0025326X98901461
___________________________
Hydrochemical Anomalies in Rivers in Murmansk Region
22024
https://link.springer.com/article/10.1134/S0097807824700775
___________________________
A tale of how the West is polluting Murmansk: a day in the life of a ‘foreign agent’
April 24, 2015
https://bellona.org/news/industrial-pollution/2015-04-tale-west-polluting-murmansk-day-life-foreign-agent
___________________________
Murmansk’s ecological problems and their solutions, as presented by Bellona
December 8, 2014
https://bellona.org/news/arctic/2014-12-murmansks-ecological-problems-solutions-presented-bellona
___________________________
Snow cover dust pollution in Murmansk and its suburbs
2022
https://iopscience.iop.org/article/10.1088/1755-1315/1010/1/012012/meta
___________________________
'Dirty as Hell': Coal Dust Chokes Murmansk as Moscow Ramps Up Asia Exports
April 17, 2024
https://www.themoscowtimes.com/2024/04/17/dirty-as-hell-coal-dust-chokes-murmansk-as-moscow-ramps-up-asia-exports-a84850
___________________________
Villages near Russia's former Gulag capital Vorkuta are facing extreme river pollution
21 August 2023
https://globalvoices.org/2023/08/21/villages-near-russias-former-gulag-capital-vorkuta-are-facing-extreme-river-pollution/
___________________________
Pollution Comparison Between Bergen and Vorkuta
https://www.numbeo.com/pollution/compare_cities.jsp?country1=Norway&city1=Bergen&country2=Russia&city2=Vorkuta
___________________________
Evaluation of aerial technogenic pollution near industrial enterprises in the tundra zone (by the example of Vorkuta city)
December 2019
https://www.researchgate.net/publication/368071354_Evaluation_of_aerial_technogenic_pollution_near_industrial_enterprises_in_the_tundra_zone_by_the_example_of_Vorkuta_city
___________________________
Effect of changes in the fuel type of thermal power plants on the spatial distribution and levels of PAH pollution in the Vorkuta agglomeration beyond the Arctic Circle
2024
https://www.sciencedirect.com/science/article/abs/pii/S1352231024002188
___________________________
The chemical composition of snow cover in the zone of activity of enterprises of the fuel and energy complex of Vorkuta, as an indicator of the encroachment of the territory
October 2021
https://www.researchgate.net/publication/367852590_The_chemical_composition_of_snow_cover_in_the_zone_of_activity_of_enterprises_of_the_fuel_and_energy_complex_of_Vorkuta_as_an_indicator_of_the_encroachment_of_the_territory
___________________________
Satellite image analysis of human caused changes in the tundra vegetation around the city of Vorkuta, north-European Russia
2002
https://www.sciencedirect.com/science/article/abs/pii/S0269749102001860
___________________________
Perceived and measured levels of environmental pollution: interdisciplinary research in the subarctic lowlands of northeast European Russia
2006
https://pubmed.ncbi.nlm.nih.gov/16989506/
___________________________
Anthropogenic metal enrichment of snow and soil in north-eastern European Russia
2002
https://www.sciencedirect.com/science/article/abs/pii/S0269749102002129
___________________________
Input of Pollutants with Winter Precipitation onto Vorkuta Agglomeration Territory
07 May 2018
https://link.springer.com/article/10.1134/S0097807818030156
___________________________
Multiple indicators of human impacts on the environment in the Pechora Basin, north-eastern European Russia
2009
https://researchportal.helsinki.fi/en/publications/multiple-indicators-of-human-impacts-on-the-environment-in-the-pe
___________________________
Manganese Pollution in Mining-Influenced Rivers and Lakes: Current State and Forecast under Climate Change in the Russian Arctic
30 March 2022
https://www.mdpi.com/2073-4441/14/7/1091
___________________________
Russia's Pollution Crisis: Soil And Air Damage
May 10, 2025
https://shunwaste.com/article/what-kinds-of-pollution-have-damaged-russias-soil-and-air
___________________________
Downstream Defender® and Up-Flo® Filter combine to catch coal dust pollution in Russia's Tuloma river.
https://hydro-int.com/en/case-studies/advanced-stormwater-treatment-technologies-protect-russian-river-coal-dust-pollution
___________________________
Green algae in tundra soils affected by coal mine pollutions
04 December 2008
https://link.springer.com/article/10.2478/s11756-008-0107-y
___________________________
Environmental issues in Russia
https://en.wikipedia.org/wiki/Environmental_issues_in_Russia
___________________________
Norilsk Nickel and Gazprom are the biggest polluters in the Arctic
October 12, 2023
https://bellona.org/news/industrial-pollution/2023-10-norilsk-nickel-and-gazprom-are-the-biggest-polluters-in-the-arctic
___________________________
Environmental contaminants in Arctic human populations: Trends over 30 years
2024
https://www.sciencedirect.com/science/article/pii/S0160412024003635
___________________________
Forty-Year Biomonitoring of Environmental Contaminants in Russian Arctic: Progress, Gaps and Perspectives
2022
https://pmc.ncbi.nlm.nih.gov/articles/PMC9565585/
___________________________
Mercury in the Barents region – River fluxes, sources, and environmental concentrations
2023
https://www.sciencedirect.com/science/article/pii/S0269749123010576
___________________________
Yukon seeks $25 million in outstanding cleanup fees from owners of shuttered, contaminated Wolverine mine
Feb. 25, 2020
___________________________
Toxic Legacies, Slow Violence, and Environmental Injustice at Giant Mine, Northwest Territories
07/06/2016
https://thenorthernreview.ca/index.php/nr/article/view/566
___________________________
Toxic Legacies Project
http://www.toxiclegacies.com/
___________________________
Archived government correspondence reveals extreme arsenic pollution of local waterbodies from gold mining at Yellowknife, NT prior to environmental regulation
2024
https://www.facetsjournal.com/doi/epdf/10.1139/facets-2024-0349
___________________________
Deep in an Abandoned Gold Mine, a Toxic Legacy Lurks - YELLOWKNIFE, Northwest Territories
May 3, 2025
Warming permafrost is fanning fears in a Canadian town that tons of lethal arsenic could seep into a nearby river system and spread all the way to the Arctic
https://www.wsj.com/world/canada-gold-mine-arsenic-6be1a2eb
___________________________
Lead contamination from gold mining in Yellowknife Bay (Northwest Territories), reconstructed using stable lead isotopes
2020
https://www.sciencedirect.com/science/article/abs/pii/S0269749119334669
___________________________
Decades of arsenic poisoning produced by Giant Mine has caused irreversible damage to Dene First Nation land
March 29, 2021
After decades of arsenic pollution flowing from the now-closed Giant gold mine and poisoning the land of the Yellowknife Dene First Nation, negotiations continue with the federal government about compensation and reconciliation.
https://capitalcurrent.ca/decades-of-arsenic-poisoning-produced-by-giant-mine-has-caused-irreversible-damage-to-yk-dene-first-nation-land/
___________________________
The City of Yellowknife, Canada, Is Sitting on Enough Arsenic to Kill Every Human on Earth
April 16, 2014
The Northern Canadian territories often get written off by all of us as a frigid tundra of nothingness. But it’s probably about time we start paying attention to the situation up there. Yellowknife is currently sitting on 237,000 tons of arsenic—enough to kill the entire human population of our planet a few times over.
The majority of this highly water-soluble carcinogen is sitting in specially designed underground chambers below an old and depleted gold mine called Giant Mine, on the outskirts of the city. The arsenic is a by-product of mining operations that started in the late 1940s, shortly after the discovery of gold in the north. Mining continued until 2004 when the company handed the depleted mine back to the federal government along with loads of arsenic trioxide dust...
For years the local mine’s arsenic production (averaging 22,000 pounds a day) was left unregulated until 1951, when a child from the Yellowknives Dene First Nation died of poisoning from eating snow in the area. It became apparent that the government needed to do something about it. But instead of shutting down operations, they thought the best course of action was to collect the massive amounts of poisonous dust in chambers underground, presumably hoping that the arsenic trioxide fairy would eventually come and take all of it away. They handed the child’s family $750 and decided to wait it out.
However, with a crumbling infrastructure and increasing concern about leakage into the local water supply, the time has come to do something about it. Now that it is 2014 and the Canadian government is older and wiser, they have finally come up with what a reasonable solution to our minor poison problem: They are going to freeze the 237,000 tons of arsenic trioxide underground—for all of eternity.
“How can we ever ensure that human systems are going to continue to keep something that requires rather sophisticated engineering and monitoring to function forever, that’s just crazy,” argues Kevin O’Reilly, an activist with Northern Alternatives. “We can’t even remember how the pyramids were built 5,000 years ago. How can we know that 5,000 years from now, if there are even people on this planet, that they are going to know what to do to keep this stuff frozen? That’s just irresponsible.”
The government had originally hoped that permafrost would creep its way back into the area and freeze the arsenic naturally, despite warnings from engineers that came as early as the 1950s that this would not be the case. After a decade of fruitless waiting the government’s plan to achieve this “frozen block” solution is to mimic the way an ice rink is kept frozen. That is: by continuously pumping coolant into the ground, the arsenic should theoretically stay frozen.
“My own thoughts are that we probably should bring the stuff up above ground and process it into a less toxic form of arsenic and put it at the bottom of the mine,” says Kevin. But this solution is seen as too costly to implement.
The government’s remediation plan of icing out the arsenic was initially met with uniform opposition from every group involved with Giant Mine. The Mackenzie Valley Review Board, an independent tribunal which aims to give the surrounding aboriginal peoples a greater say in the management of the area, proposed an environmental assessment, which will hopefully be approved by the minister in Ottawa any day now. The assessment lays out numerous amendments that include “forever” being reduced to only 100 years, as well as putting funding towards research that would seek to find a more attainable solution for the mine.
“The project went from having uniform opposition from every group involved to having support from many groups after environmental assessment,” says Alan Ehrlich, a member of the Mackenzie Valley Review Board.
The City of Yellowknife, as well as the Yellowknives Dene First Nation, unanimously passed a motion to accept the Review Board’s proposed amendments, as they would bring the people a slightly more hopeful future for their area. This is especially important when you put into context how much Giant Mine has affected the Dene people’s lands, upon which the mine is located.
The carelessness with which the mine was operated in the first few years of production has had profound repercussions on the Dene people. With no pollution control, everything inside the mine was going up the stack. Even towards the end of the mine’s life in 2004, there was still around 60 pounds of arsenic being diffused into the air every day. The end result was complete contamination of the Dene’s land.
“They have often talked about their land being destroyed,” says Kevin. “They used to go into the Baker Creek area as it was well known for fishing and berries. It’s really hard to find any blueberries around Yellowknife anymore. They’ve been scorched off the surface of the earth by the sulphur dioxide emissions from the mine.”
“They used to harvest throughout the area where the mine was,” Alan continues. “It was also on routes for hunting caribou as well, and now it has become one of the most contaminated sites in Canada.”
It’s no surprise that they would be concerned about how the proposed cleanup will affect them further. Numerous contaminated buildings will have to be exhumed and destroyed in an attempt to decontaminate the area. Soil will have to be removed, which has the potential to create toxic dust. The Dene people have raised concerns of how this will affect them physically and culturally, as many of their key cultural practices are closely tied to the land.
“One thing that I think is outstanding is the need for a public apology and compensation to the Yellowknives Dene First Nation for what was done to them and their land,” says Kevin. “There needs to be some acknowledgement that something bad happened and that [the government] will do their best to make sure that it never happens again.”
https://www.vice.com/en/article/yellowknife-is-sitting-on-enough-arsenic-to-kill-every-human-on-earth/
___________________________
Impacts on aquatic biota from salinization and metalloid contamination by gold mine tailings in sub-Arctic lakes
2021
https://www.sciencedirect.com/science/article/abs/pii/S026974912100395X
___________________________
Evaluating spatiotemporal patterns of arsenic, antimony, and lead deposition from legacy gold mine emissions using lake sediment records
2021
https://www.sciencedirect.com/science/article/pii/S0883292721001840
___________________________
‘How much more mining can our environments take?’: Discharge issues hit another closed mine in Yukon
___________________________
The Shift To Eco-friendly Gold Mining
https://goldfundz.com/latest-news/the-shift-to-eco-friendly-gold-mining/
___________________________
Mineral Jig vs. Sluice Box – Which Is Better?
Environmental Impact
Jigs are more eco-friendly than sluice boxes, as they don’t rely on large volumes of water or harmful chemicals. This is a crucial consideration for environmentally conscious miners.
{It is possible to use a sluice box without chemicals}.
https://blog.rgmak.com/mineral-jig-vs-sluice-box-which-is-better/
___________________________
Legend of the Golden Fleece was REAL: Greek myth originated near the Black Sea where miners used sheepskin to filter gold from mountain streams, geologists claim
27 November 2014
https://www.dailymail.co.uk/sciencetech/article-2851531/Legend-Golden-Fleece-real-hunt-sheepskin-used-filter-flakes-gold-mountain-streams.html
___________________________
Golden Fleece myth was based on real events, geologists contend
November 25, 2014
https://www.sciencenews.org/article/golden-fleece-myth-was-based-real-events-geologists-contend
___________________________
Prairie Creek Mine: Cyanide Disaster Waiting to Engulf Dehcho
There are 40 tonnes of lethal cyanide that have been stored for over 20 years beside Prairie Creek, a tributary of the South Nahanni River in Dehcho First Nations territory, and the federal government must remove it.
The Winter Leadership meeting of the Dehcho First Nations (DFN), meeting here last week, unanimously called on the federal government to remove the cyanide before it contaminates the South Nahanni River, and damages beyond recovery the pristine waters and lands of one of Canada’s most famous national parks, the Nahanni National Park Reserve, a UNESCO World Heritage Site.
The cyanide, along with deteriorating fuel tanks, mining infrastructure and a tailings pond are owned by a junior mining company, Canadian Zinc Corporation of Vancouver, who bought the never-operated Prairie Creek Mine in 1991. The mine itself was started in 1982 as part of an illfated attempt by Texans to corner the then booming silver market. When the price plummeted, however, the mine closed without ever removing a shovelful of ore.
But it left behind a dangerous legacy that sits decaying on Dehcho land. Canadian Zinc, which owns the mine and all the remains of the Prairie Creek infrastructure, wants to reopen the mine, speculating on higher silver and zinc prices today. Other mineral exploration companies are greedily eying the area.
The Dehcho and Parks Canada have identified mining activity, including the Prairie Creek mine, as “the greatest threat to the ecological integrity of the South Nahanni watershed”, which includes Nahanni National Park Reserve.
The Dehcho leadership have called on government to remove the cyanide and other toxic materials for a number of years to no avail, despite the fact that DFN and Parks Canada have signed an interim agreement to withdraw 70,000 sq kms from mineral development and are Government of Denendeh working towards a final agreement to expand Nahanni National Park to better protect the ecologically sensitive South Nahanni Watershed. national The nearby Dehcho community of Nahanni Butte and DFN have been at loggerheads with government over the Priairie Creek mine and cyanide for some time, challenging various regulatory authorities as well as Indian and Northern Affairs (INAC). The Mackenzie Valley Environmental Impact Review Board said the cyanide should be removed, and included measures in CZN’s permits to make the company properly store the cyanide in an enclosed container until it could be removed or neutralized. But it is so highly toxic, that even government field inspectors said they would refuse to go near the location, and the measure has never been enforced.
In 2006, Nahanni Butte wrote to INAC Minister Jim Prentice requesting the cyanide be neutralized on site and removed. The minister – in the days before the Conservative Party became green – refused, saying the mine site was safe and the cyanide safely stored. The Dehcho disagree, as the cyanide is stored out in the open environment, in aging barrels that sit on wooden skids, and are only covered by tarps. “If there is an environmental disaster then it will be on his head,” Grand Chief Herb Norwegian said.
In January of this year Nahanni Butte raised the cyanide issue again since Canadian Zinc has proposed to build a 170 km. road to re-supply fuel and other contaminants to the mine site. Alarmingly, Canadian Zinc also proposes to haul the highly toxic cyanide out through the heart of the South Nahanni Watershed, over the mountains, through the karst lands, and overwater bodies to the Liard highway. There is great anxiety among residents that the “cyanide removal” proposal is being used as a political lever to try and gain support for the “Zinc Road.”
Back in Fort Liard at the leadership meeting, Marie Lafferty, president of the Fort Simpson Metis Local and Chief Eric Betsaka of Nahanni Butte First Nations argued that INAC has ignored the pleas of DFN’s Annual Assemblies, and urgently asked DFN’s leadership to keep pressing the federal government to take immediate action on the cyanide, calling it “a pending environmental disaster.”
https://dehcho.org/prairie-creek-mine-cyanide-disaster-waiting-to-engulf-dehcho/
___________________________
How and why is Aquatic Quality Changing at Nahanni National Park Reserve, nwt, Canada?
October 2003
https://link.springer.com/article/10.1023/A:1025577325352
___________________________
Dene stories, environmental protection focus of new Nahanni National Park action plan
June 16, 2021
Original park reserve boundary received UNESCO World Heritage status in 1978
https://www.cbc.ca/news/canada/north/nahanni-national-park-action-plan-1.6066535
___________________________
Headless Valley: The Horrific Secrets of Nahanni National Park | Documentary
Aug 27, 2022
https://www.youtube.com/watch?v=AcYZ9rH_S9U
___________________________
The Valley of Headless men - Nahanni Valley National Park | Headless Valley
Mar 24, 2024
https://www.youtube.com/watch?v=MFaX1X4UAd4
___________________________
The Valley of Headless Men is a REAL PLACE!? (Season 2) | The UnBelievable with Dan Aykroyd
Dec 14, 2024
https://www.youtube.com/watch?v=fHoHsbG_uZI
___________________________
Did Something Stalk Miners in the Valley of Headless Men?
Feb 16, 2024
https://www.youtube.com/watch?v=hPQF7WwFpjQ
___________________________
Nahanni National Park Reserve
https://en.wikipedia.org/wiki/Nahanni_National_Park_Reserve
___________________________
Feds promise $53M to help protect Tuktoyaktuk, N.W.T., from shoreline erosion, climate change
July 28, 2023
https://www.cbc.ca/news/canada/north/tuktoyaktuk-erosion-infrastructure-funding-1.6920622
___________________________
Tuktoyaktuk Faces Crisis From Thawing Permafrost
04 December 2024
https://evrimagaci.org/tpg/tuktoyaktuk-faces-crisis-from-thawing-permafrost-75872
___________________________
Mysteries Hidden Under Alaskan Ice
Apr 10, 2025
https://www.youtube.com/watch?v=gSn4YoCn6Gg
___________________________
Inside The ‘Alaska Triangle’ Where More Than 20,000 People Have Disappeared Without a Trace
September 25, 2024
https://theheartysoul.com/inside-alaska-triangle/
___________________________
10 Mysterious Disappearances in the Alaska Triangle
July 13, 2022
https://listverse.com/2022/07/13/10-mysterious-disappearances-in-the-alaska-triangle/
___________________________
The Alaska Triangle – Disappearing Into Thin Air
https://www.legendsofamerica.com/alaska-triangle/
___________________________
Man went to Alaska to look for the Black Pyramid and went missing
Dec. 11, 2023
https://anomalien.com/man-went-to-alaska-to-look-for-the-black-pyramid-and-went-missing/
___________________________
Did the Alaskan Wilderness Hide a Giant Underground Pyramid?
Nov 4, 2023
https://www.puzzlingmysteries.com/mysteries/did-the-alaskan-wilderness-hide-a-giant-underground-pyramid/
___________________________
The Dark Pyramid of Alaska (Controversial)
May 4, 2024
https://www.youtube.com/watch?v=purPO8UE-9g
___________________________
Mysteries Hidden Under Alaskan Ice (Controversial)
Apr 10, 2025
https://www.youtube.com/watch?v=gSn4YoCn6Gg
___________________________
This State Has The Highest Rate of Deadly Plane Crashes in the Country
September 27, 2021
Alaska is plagued with 42% of fatal crashes involving commuter, air taxi, and charter flights. All of this in a state with less than 1% of the national population. But some experts argue that many of these deaths are preventable. Find out how...
https://www.motorbiscuit.com/highest-rate-deadly-plane-crashes/
___________________________
Rate of Alaska fatal plane crashes tops national average
November 4, 2019
https://www.adn.com/alaska-news/aviation/2019/11/04/rate-of-alaska-fatal-plane-crashes-tops-national-average/
___________________________
Occupational Aviation Fatalities --- Alaska, 2000--2010
July 1, 2011
https://www.cdc.gov/mmwr/preview/mmwrhtml/mm6025a1.htm
___________________________
Magnetic anomalies in Alaska
1933
https://ui.adsabs.harvard.edu/abs/1933TrAGU..14..116E/abstract
___________________________
A new magnetic view of Alaska
January 1, 1999
https://www.usgs.gov/publications/a-new-magnetic-view-alaska
___________________________
Tofty airborne magnetic and radiometric survey, Alaska
2025
https://dggs.alaska.gov/webpubs/metadata/GPR2025-4-v-2.faq.html
___________________________
Magnetic anomaly map of North America
January 1, 2002
https://www.usgs.gov/maps/magnetic-anomaly-map-north-america
___________________________
Study on co-seismic ionospheric disturbance of Alaska earthquake on July 29, 2021 based on GPS TEC
1 July 2023
https://www.nature.com/articles/s41598-023-37374-9
___________________________
Anomalous Geomagnetic Signal Emphasized before the Mw8.2 Coastal Alaska Earthquake, Occurred on 29 July 2021
2022
https://pmc.ncbi.nlm.nih.gov/articles/PMC8871241/
___________________________
Ionospheric TEC disturbances and Ne anomalies during the Mw 7.8 Alaska earthquake on July 22, 2020
2025
https://www.sciencedirect.com/science/article/abs/pii/S0273117725006738
___________________________
Magnetic North Pole Remains Elusive
February 06, 2003
https://www.gi.alaska.edu/alaska-science-forum/magnetic-north-pole-remains-elusive
___________________________
Shifting Distribution of Land Temperature Anomalies, 1964-2024
January 10, 2025
https://svs.gsfc.nasa.gov/5452
___________________________
Alaska’s Changing Vegetation Processes and Patterns: Plant Responses to Unprecedented Levels of Warming in the Far North
September 6, 2023
As wetlands dry, they will gradually be taken over by new assemblages of (non-wetland) plant species. The area shown here was once a shallow lake, which was colonized by a sedge wetland as it dried, and is now rapidly being colonized by trees and shrubs with further drying.
https://www.nps.gov/articles/000/aps-22-1-3.htm
___________________________
Mountain Permafrost, Climate Change, and Rock Avalanches in Glacier Bay National Park, Alaska
JUNE 18, 2018
https://www.usgs.gov/programs/landslide-hazards/science/mountain-permafrost-climate-change-and-rock-avalanches-glacier
___________________________
Glacier Change
https://dggs.alaska.gov/hazards/climate/glacier-change.html
___________________________
Migratory bird nest survival "decreased significantly" near fossil fuel extraction sites in Alaska's Prudhoe Bay, a study led by the Wildlife Conservation Society revealed Tuesday.
WCS analyzed 17 years of migratory bird nesting data in Prudhoe Bay and found that "nest survival decreased significantly near high-use oil and gas infrastructure and its related noise, dust, traffic, air pollution, and other disturbances."
https://www.commondreams.org/news/migratory-birds
___________________________
Prudhoe Bay Oilfield Influences on Atmospheric Particles on the North Slope of Alaska
06/27/2017
___________________________
What tiny particles blowing in North Slope air tell us about oil-field pollution
April 9, 2017
___________________________
List of rivers of Alaska
https://en.wikipedia.org/wiki/List_of_rivers_of_Alaska
___________________________
7 ugly facts about Prudhoe Bay, Alaska
___________________________
___________________________
___________________________
___________________________
Section 4: The Polar Ice Caps
___________________________
___________________________
___________________________
The following chapter can also be viewed in the book titled
Pollution Science X (Pollution Science 101) - The Antarctic.
PollutionScience101Antarctic.Blogspot.com
___________________________
Why is the Arctic melting faster than the Antarctic?
14.06.2017
A
recent report says the Arctic may be ice-free by 2040. The Antarctic is
also melting, albeit far slower, and in a less regular pattern. Why do
the two poles react so differently in the face of climate change?
https://www.dw.com/en/why-is-the-arctic-melting-faster-than-the-antarctic/a-38678700
___________________________
Is Antarctica Losing Ice or Gaining It?
November 5, 2015
Scientists are wary of new research showing more ice on frozen continent
https://www.scientificamerican.com/article/is-antarctica-losing-ice-or-gaining-it/
___________________________
Ice Gains In Some Parts Of Antarctica Aren't Offsetting Its Losses [Infographic]
2019
In
the past week or so I have been reading a few articles and social media
posts on the subject of Antarctica gaining ice mass. The articles are
talking about information from a study released by NASA in 2015 showing
that snowfall on the Eastern part of the continent is more than enough
to offset the melting of glaciers in the West. The social media posts
have been talking about how this proves that climate change was a hoax
all along. After all, how can sea levels be rising from glaciers melting
if Antarctica is gaining mass year after year? I took some time to
research the issue and read the actual study and today I thought I would
take some time and write a few paragraphs to help set the record
straight on this topic.
The study in question
In 2015 a
study was published by NASA, the lead author was Jay Zwally, a
glaciologist with NASA Goddard Space Flight Center. The study showed
evidence that Antarctica had experienced a net gain of 112 billion tons
of ice annually between 1992 and 2001 and a gain of 82 billion tons
annually between 2003 and 2008. This information was not at all in line
with previous findings on the subject which insisted that Antarctica has
been losing ice mass because of global warming.
These new
findings were based on data that came from studying changes in the
surface height of the Antarctic ice sheet using radar altimeters. The
data was collected using two European Space Agency European Remote
Sensing satellites and NASA’s Ice, Cloud, and land Elevation Satellite.
Basically,
the study shows that gains in snowfall in East Antarctica are more than
enough to offset the losses from melting glaciers on the West side of
the continent. These gains were not just in recent years but had been
the result of increased snowfall over the past 10,000 years or since the
last ice age. The study goes on to say that sea levels cannot be rising
because of glaciers melting in Antarctica because its actually gaining
ice.
Issues with the study
This information came as a bit
of a shock. After all the International Panel on Climate Change had been
releasing reports for a long time stating that Antarctica has been
losing mass and causing sea levels to rise. With this study saying the
opposite it’s clear that somebody had to be wrong. With that in mind,
the scientific community was cautious with this new information.
Since
2015 scientists have had a chance to look over the data and have had
time to do a few follow-up studies and the results are clear.
It
is agreed among scientists studying the situation that the Eastern area
is gaining a lot of ice due to thousands of years of continued snowfall.
However, measuring the size of that gain can be difficult at best. The
major issues with Zwally’s study are that it used altimeter data from
satellites, which is subject to systematic errors such as snowpack
penetration and telling the difference between snow that is on the
ground and snow that is still falling. Also, in order to calibrate their
measurements, Zwally’s team bounced lasers of the Southern Ocean which
may not have been reliable...
https://www.forbes.com/sites/kevinanderton/2019/02/21/ice-gains-in-some-parts-of-antarctica-arent-offsetting-its-losses-infographic/?sh=5dfca5cc7030
___________________________
NASA satellites show Antarctica has gained ice despite rising global temperatures. How is that possible?
May 13, 2025
An
abrupt change in Antarctica has caused the continent to gain ice. But
this increase, documented in NASA satellite data, is a temporary anomaly
rather than an indication that global warming has reversed, scientists
say.
https://www.livescience.com/planet-earth/antarctica/nasa-satellites-show-antarctica-has-gained-ice-despite-rising-global-temperatures-how-is-that-possible
___________________________
Is ice shifting from North to South Pole? Antarctica is gaining mass again, but Arctic tells a different story
May 5, 2025
https://www.wionews.com/web-stories/science-technology/is-ice-shifting-from-north-to-south-pole-antarctica-is-gaining-mass-again-but-arctic-tells-a-different-story-9036347
___________________________
Scientists Baffled by Sudden Antarctic Glacial Growth
June 22, 2025
https://climatecosmos.com/climate-science/scientists-baffled-by-sudden-antarctic-glacial-growth/
___________________________
Against all odds, Antarctic ice is growing again — here’s why
May 18, 2025
For the past 20 years, Antarctica’s ice sheet has been melting rapidly, but since 2021, it has started to grow again.
https://www.futura-sciences.com/en/against-all-odds-antarctic-ice-is-growing-again-heres-why_17702/
___________________________
Southern Ocean sea ice cover has gradually grown over the past 10,000 years
June 14, 2021

This
visualization shows the growth of Antarctic sea ice over the austral
winter of 2015. At its maximum extent in late winter, the sea ice covers
an average area of more than 18 million square kilometers, essentially
doubling the continent in size from summer to winter as the ice expands.
Salt
levels in an ice core drilled at the South Pole are telling scientists
what Antarctic sea ice conditions were like in ages past, information
crucial to understanding how the southernmost continent will fare in a
changing climate.
Antarctica is perpetually surrounded by a ring
of sea ice in the Southern Ocean, but the amount of ice changes with the
seasons. During a typical summer, the continent is surrounded by about 3
million square kilometers of ice, but that number can grow to more than
18 million square kilometers in the winter. The continent essentially
doubles in size during the cold season, but scientists want to know more
about how its sea ice extent has varied in centuries and millennia
past.
By analyzing levels of sea salt in an ice core from the
South Pole, researchers now have a record of how Antarctic sea ice has
ebbed and flowed every season for the past 11,000 years. Their findings
show the band of ice encircling the continent has gradually expanded
over the past 10,000 years, with one notable dip in sea ice extent
between 5,000 and 6,000 years ago.
The results help scientists
tease out the intricate connections between sea ice and climate,
according to the researchers, which could help them understand why
Antarctic sea ice has remained relatively constant over time while
Arctic sea ice has diminished by about 40 percent since the 1970s.
“This
work is a building block in our overall picture of Antarctic climate,”
said Dominic Winski, a climate scientist at the University of Maine and
lead author of a new study detailing the findings. “If we don't
understand the processes affecting sea ice, then I think we have little
hope of understanding where we're headed as a planet.”
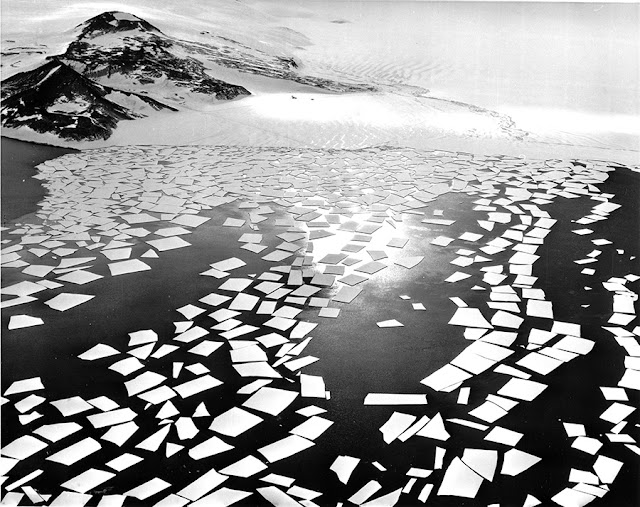
Sea ice floating around Ross Island in 1961. New research finds the extent of sea ice surrounding Antarctica has gradually grown over the past 10,000 years.
A Salty Past
Sea
ice is frozen ocean water that forms primarily at Earth's poles. This
ice is an integral part of Earth’s climate system – it reflects sunlight
back into space, helping to keep the planet cool, while also helping
regulate the flow of ocean water around the globe, including the
transport of heat and salt.
Scientists have only been able to
directly study sea ice extent since satellite records began in 1979. But
they can examine sea ice changes in the distant past by using levels of
sea salt found in ice cores as a proxy.
Sea salt makes its way
into ice cores in a few ways. In the Southern Ocean, salt from sea spray
gets blown by the wind, eventually settling on Antarctic ice hundreds,
or even thousands, of miles away. Additionally, sea ice is often covered
by a layer of snow that gets soaked by waves. Winds then blow that
salt-laden snow over Antarctica, where it settles and eventually gets
incorporated into the vast ice sheet covering the continent. Salty ice
also tends to form frost flowers – thin, flowerlike formations that grow
on top of newly-formed sea ice. Strong winds in the Southern Ocean blow
the delicate structures away, sending a puff of salt into the air,
where it can later settle on Antarctic ice.
In the new study,
Winski and his colleagues measured sea salt levels in the South Pole ice
core, which was drilled during expeditions to the South Pole from 2014
to 2016. It is the longest ice core ever drilled from the South Pole,
with the deepest part of the core being more than a mile below the
surface of the ice. Scientists have used this ice core to reconstruct a
record of Earth’s climate for the past 50,000 years.
At the South
Pole, more than 1,000 miles from the ocean, there is evidence that more
salt in an ice core layer means more sea ice was present at that time.
The salt concentrations are tiny, measuring in the parts per billion
range, but the levels are consistent and scientists can reliably measure
them.
Winski and his colleagues measured salt concentrations in
more than 70,000 samples of the South Pole ice core, which allowed them
to estimate how Antarctic sea ice has grown and shrunk over every summer
and winter for the past 11,000 years.
They found sea ice in the
Southern Ocean has been steadily increasing since about 10,000 years
ago. But they also discovered a major drop in salt concentrations – and
by extension, sea ice – between 5,000 and 6,000 years ago. Combining
their new data with previous climate records from this time, they
suspect this dip in sea ice was due to changes in ocean circulation in
the Atlantic Ocean that made the North Atlantic cooler but the South
Atlantic warmer.
“It’s a hint that something pretty interesting
might have been going on that links the North and South Atlantic during
this time,” Winski said.
Sea ice and climate
Sea ice is an
incredibly sensitive part of the climate system, so tracking how it
varies over time helps scientists better understand what they’ve
observed over the past several decades as the climate has changed,
according to the researchers.
“We know that sea ice extent can
change really rapidly from year to year, and at least in the Arctic,
it's diminished by incredible amounts in just decades,” Winski said.
“The more we learn about sea ice, the more we realize it can play a
critical role during episodes of climate change.”
One thing
scientists are just beginning to understand is why Arctic sea ice has
declined so much, but Antarctic sea ice has remained relatively stable.
The new results have given researchers more insight into the sea
ice-climate system as a whole, which can help them understand what may
happen in the coming decades.
“We have little chance of being
able to forecast or prepare for changes in Southern Ocean sea ice if we
do not fully understand the processes that influence these systems,”
Winski said. “Ice core studies like this one can provide a host of
information on past changes that may help us understand what is
happening today.”
This research was supported by the National
Science Foundation, which manages the U.S. Antarctic Program. NSF-funded
research in this story: Erich Osterberg, Dartmouth College, Award No.
1443336; Karl Kreutz, University of Maine, Award No. 1443397; Jihong
Cole-Dai, South Dakota State University, Award No. 1443663; Eric Steig,
University of Washington, Award No. 1443105 and Award No. 1141839; Becky
Alexander, University of Washington, Award No. 1702266
https://antarcticsun.usap.gov/science/4452/
___________________________
Study: Mass gains of Antarctic ice sheet greater than losses
Nov 05, 2015
A new NASA study says that an increase in Antarctic snow accumulation that began 10,000 years ago is currently adding enough ice to the continent to outweigh the increased losses from its thinning glaciers.
NOTE: The findings reported here conflict with over a decade of other measurements, including previous NASA studies. However, challenges to existing findings are an integral part of the scientific process and can help clarify and advance understanding. Additional scrutiny and follow-up research will be required before this study can be reconciled with the preponderance of evidence supporting the widely accepted model of a shrinking Antarctic ice sheet.
A new NASA study says that an increase in Antarctic snow accumulation that began 10,000 years ago is currently adding enough ice to the continent to outweigh the increased losses from its thinning glaciers.
The research challenges the conclusions of other studies, including the Intergovernmental Panel on Climate Change’s (IPCC) 2013 report, which says that Antarctica is overall losing land ice.
According to the new analysis of satellite data, the Antarctic ice sheet showed a net gain of 112 billion tons of ice a year from 1992 to 2001. That net gain slowed to 82 billion tons of ice per year between 2003 and 2008.
“We’re essentially in agreement with other studies that show an increase in ice discharge in the Antarctic Peninsula and the Thwaites and Pine Island region of West Antarctica,” said Jay Zwally, a glaciologist with NASA Goddard Space Flight Center in Greenbelt, Maryland, and lead author of the study, which was published on Oct. 30 in the Journal of Glaciology
. “Our main disagreement is for East Antarctica and the interior of West Antarctica – there, we see an ice gain that exceeds the losses in the other areas.” Zwally added that his team “measured small height changes over large areas, as well as the large changes observed over smaller areas.”
Scientists calculate how much the ice sheet is growing or shrinking from the changes in surface height that are measured by the satellite altimeters. In locations where the amount of new snowfall accumulating on an ice sheet is not equal to the ice flow downward and outward to the ocean, the surface height changes and the ice-sheet mass grows or shrinks.
But it might only take a few decades for Antarctica’s growth to reverse, according to Zwally. “If the losses of the Antarctic Peninsula and parts of West Antarctica continue to increase at the same rate they’ve been increasing for the last two decades, the losses will catch up with the long-term gain in East Antarctica in 20 or 30 years — I don’t think there will be enough snowfall increase to offset these losses.”
The study analyzed changes in the surface height of the Antarctic ice sheet measured by radar altimeters on two European Space Agency European Remote Sensing (ERS) satellites, spanning from 1992 to 2001, and by the laser altimeter on NASA’s Ice, Cloud, and land Elevation Satellite (ICESat) from 2003 to 2008.
Zwally said that while other scientists have assumed that the gains in elevation seen in East Antarctica are due to recent increases in snow accumulation, his team used meteorological data beginning in 1979 to show that the snowfall in East Antarctica actually decreased by 11 billion tons per year during both the ERS and ICESat periods. They also used information on snow accumulation for tens of thousands of years, derived by other scientists from ice cores, to conclude that East Antarctica has been thickening for a very long time.
“At the end of the last Ice Age, the air became warmer and carried more moisture across the continent, doubling the amount of snow dropped on the ice sheet,” Zwally said.
The extra snowfall that began 10,000 years ago has been slowly accumulating on the ice sheet and compacting into solid ice over millennia, thickening the ice in East Antarctica and the interior of West Antarctica by an average of 0.7 inches (1.7 centimeters) per year. This small thickening, sustained over thousands of years and spread over the vast expanse of these sectors of Antarctica, corresponds to a very large gain of ice – enough to outweigh the losses from fast-flowing glaciers in other parts of the continent and reduce global sea level rise.
Zwally’s team calculated that the mass gain from the thickening of East Antarctica remained steady from 1992 to 2008 at 200 billion tons per year, while the ice losses from the coastal regions of West Antarctica and the Antarctic Peninsula increased by 65 billion tons per year.
“The good news is that Antarctica is not currently contributing to sea level rise, but is taking 0.23 millimeters per year away,” Zwally said. “But this is also bad news. If the 0.27 millimeters per year of sea level rise attributed to Antarctica in the IPCC report is not really coming from Antarctica, there must be some other contribution to sea level rise that is not accounted for.”
“The new study highlights the difficulties of measuring the small changes in ice height happening in East Antarctica,” said Ben Smith, a glaciologist with the University of Washington in Seattle who was not involved in Zwally’s study.
"Doing altimetry accurately for very large areas is extraordinarily difficult, and there are measurements of snow accumulation that need to be done independently to understand what’s happening in these places,” Smith said.
To help accurately measure changes in Antarctica, NASA is developing the successor to the ICESat mission, ICESat-2, which is scheduled to launch in 2018. “ICESat-2 will measure changes in the ice sheet within the thickness of a No. 2 pencil,” said Tom Neumann, a glaciologist at Goddard and deputy project scientist for ICESat-2. “It will contribute to solving the problem of Antarctica’s mass balance by providing a long-term record of elevation changes.”
___________________________
New research shows growth of East Antarctic Ice Sheet was less than previously suggested
May 5, 2017
https://phys.org/news/2017-05-growth-east-antarctic-ice-sheet.html
___________________________
West Antarctic glacier observed stealing ice from neighbor
8 May, 2025
Scientists
have discovered a glacier in Antarctica committing “ice piracy” –
stealing ice from its neighbour in a phenomenon previously thought to
take hundreds or thousands of years.
Research led by the
University of Leeds has revealed that this dramatic glacial theft has
occurred over less than 18 years, challenging scientific understanding
of Antarctica’s ice dynamics and potential sea level rise contributions.
Dr Pierre Dutrieux, climate researcher at the British Antarctic
Survey (BAS) and study co-author, explained the significance of the
findings:
“This study provides an interesting demonstration
of ice piracy, where flow into one glacier gradually switches to flow
into another glacier, as the ocean melts the grounding zone and
re-configures ice flow...”
https://www.bas.ac.uk/media-post/west-antarctic-glacier-observed-stealing-ice-from-neighbour/
___________________________
“Antarctic Ice Cap Found Shrinking Toward Pole”
26 Feb 2025
“Tue, Jun 01, 1948 – Page 14
Antarctic Ice Cap Found Shrinking Toward Pole
OSLO, June 1 (UP).—A remarkable thinning out of the polar ice cap in
the Antarctic is reported by a Norwegian expedition which found bare
stretches of earth on an island thickly covered with ice only 20 years
ago.”
https://iowaclimate.org/2025/02/26/antarctic-ice-cap-found-shrinking-toward-pole/
___________________________
Retreat history of the East Antarctic Ice Sheet since the Last Glacial Maximum
2014
https://www.sciencedirect.com/science/article/pii/S0277379113002898
___________________________
An early defrost
August 16, 2013
Nature paper suggests last ice age in West Antarctica ended at least 20,000 years ago
New
research published online Aug. 14 in the prestigious journal Nature
suggests that the last ice age in West Antarctica ended several thousand
years earlier than previously thought.
The study is based on
analysis of an ice core extracted from the West Antarctic Ice Sheet by
U.S. researchers, a multi-year project primarily funded by the National
Science Foundation . Scientists spent the better part of a decade
drilling and extracting an ice core 3,400 meters long, representing a
climate history of about 68,000 years. Only the first 30,000 years have
been analyzed so far. [See previous article — The last core: WAIS Divide
deepens borehole for research into climate change.]
The data
from the ice core suggest changes in the amount of solar energy
triggered the warming of West Antarctica. The subsequent release of
carbon dioxide from the Southern Ocean amplified the effect and resulted
in warming on a global scale, eventually ending the ice age.
The
date for the end of the last ice age, or glacial period, had been
pegged at 20,000 years for the Northern Hemisphere and about 18,000
years ago for the Southern Hemisphere. The new analysis implies that
parts of Antarctica began warming between 2,000 and 4,000 years earlier
than previously thought.
"This deglaciation is the last big
climate change that that we're able to go back and investigate," said
T.J. Fudge , a University of Washington doctoral student in Earth and
space sciences and lead corresponding author of the Nature paper. "It
teaches us about how our climate system works."
For more information, see press releases from the University of Washington and Oregon State University .
https://antarcticsun.usap.gov/science/2886/
___________________________
Thinning Arctic sea ice influences the atmosphere — with spinoff effects for Eurasia, study says
May 25, 2018
https://www.arctictoday.com/thinning-arctic-sea-ice-influences-atmosphere-spinoff-effects-eurasia-study-says/
___________________________
Warm ocean water is eroding Thwaites Ice Shelf from below (West Antarctica)
August 09, 2021
A first peek from the ocean below shows water eating away at the ice shelf’s critical anchor points
Scientists got their first glimpse at the ocean conditions surrounding the Thwaites Ice Shelf in 2019, and recently published results are worrisome for the rapidly melting ice shelf and the glacier behind it.
The first foray of an underwater vehicle beneath the ice shelf found there are three bedrock channels funneling warm water from the open ocean toward the ice. That warm water is melting the ice shelf at an alarming rate. Researchers who analyzed the data estimate there is enough heat flowing through just one of those channels to melt 85 gigatons of ice per year – enough water to fill about 36,000 Great Pyramids of Giza.
“Warm water is reaching the underside of the ice and melting it rapidly as it goes afloat,” said Ted Scambos, a polar scientist at the University of Colorado Boulder and U.S. lead of the International Thwaites Glacier Collaboration’s Science Coordination Office. “The remaining ice shelf… looks like it won't survive for more than another 10 years or so. Loss of the ice shelf, and more melt from ocean water, will cause Thwaites glacier to accelerate even more.”
“It sort of dawned on us slowly as we worked with the data… that the heat flow was really larger than we expected,” said Anna Wåhlin, an oceanographer at the University of Gothenburg in Sweden and lead author of a recent study detailing the results.
What’s more, the results show warm water is hitting critical points anchoring the glacier to the seafloor. The researchers can’t say for sure whether what was observed in 2019 was an outlier, but if those ocean conditions persist, the ice shelf is in serious jeopardy.
“We think that means this probably is not sustainable,” Wåhlin said.
https://antarcticsun.usap.gov/science/4457/
___________________________
UW scientists suggest Pacific Ocean contributes to West Antarctic warming
April 22, 2011
New
research from scientists at the University of Washington (UW) suggests
that rising sea surface temperatures in the area of the Pacific Ocean
along the equator and near the International Date Line drive atmospheric
circulation that has caused some of the largest shifts in Antarctic
climate in recent decades.
The warmer water generates rising air
that creates a large wave structure in the atmosphere called a Rossby
wave train, which brings warmer temperatures to West Antarctica during
winter and spring.
While Antarctica is somewhat isolated by the
vast Southern Ocean, the new results “show that it is still affected by
climate changes elsewhere on the planet,” said Eric Steig , a professor
at UW and co-author of the study published this month in the journal
Nature Geoscience. The research was funded by the National Science
Foundation (NSF) .
The scientists used surface and satellite
temperature observations to show a strong statistical connection between
warmer temperatures in Antarctica, largely brought by westerly winds
associated with high pressure over the Amundsen Sea adjacent to West
Antarctica, and sea surface temperatures in the central tropical Pacific
Ocean.
They found a strong relationship between central Pacific
sea-surface readings and Antarctic temperatures during Southern
Hemisphere winter months, June through August. The effect also appeared
to a lesser degree in the spring months of September through November.
The
observed circulation changes are in the form of a series of high- and
low-pressure cells that follow an arcing path from the tropical Pacific
to West Antarctica. That is characteristic of a textbook Rossby wave
train pattern, said Qinghua Ding, lead author of the paper and a
postdoctoral researcher at UW. He added the same pattern is consistently
produced in climate models, at least during winter.
Using
observed changes in tropical sea surface temperatures, the researchers
found they could account for half to all of the observed winter
temperature changes in West Antarctica, depending on which observations
are used for comparison.
“This is distinct from El Niño ,” Steig
said. That climate phenomenon, which affects weather patterns worldwide,
primarily influences sea-surface temperatures farther east in the
Pacific, nearer to South America.
Steig noted that the influence
of Rossby waves on West Antarctic climate is not a new idea, but this is
the first time such waves have been shown to be associated with
long-term changes in Antarctic temperature.
The findings also
could have implications for understanding the causes behind the thinning
of the West Antarctic Ice Sheet, which contains about 10 percent of all
the ice in Antarctica, according to the study’s authors.
Steig
noted in a UW press release that the westerly winds created by the high
pressure over the Amundsen Sea pushes cold water away from the edge of
the ice sheet and out into the open ocean. It is then replaced by warmer
water from deeper in the ocean, which is melting the seaward edge of
the ice sheet from below.
A recent NASA -led study suggested that
the West Antarctic and Greenland ice sheets are now the primary
contributors to sea-level rise. The West Antarctic Ice Sheet could raise
sea level by about six meters if it collapsed entirely. [See previous
article: Meltdown.]
Other co-authors on the paper include David
Battisti, a UW atmospheric sciences professor, and Marcel Küttel, a
former UW postdoctoral researcher now working in Switzerland. Steig is
also a principal investigator on the NSF-funded WAIS Divide ice core
project in West Antarctica, which recently completed deep-coring
operations. [See previous article: Deep core complete.]
https://antarcticsun.usap.gov/science/2413/
___________________________
Garwood reveals layers of climate history from Last Glacial Maximum
March 16, 2012
A
cliff section of ancient ice capped by layers of sediment in Garwood
Valley stands more than 10 meters tall in most places. The ice was
deposited in the valley when the West Antarctic Ice Sheet grew thousands
of years ago.
https://antarcticsun.usap.gov/science/2626/
___________________________
Ancient Ice Levels
April 20, 2017
Scientists drill into Antarctic bedrock to see if the Icy Continent was once a bit less icy
Today, a massive sheet of ice covers nearly all of West Antarctica, but it likely hasn’t always been that way.
Over
the past few hundred thousand years, researchers think that the ice
sheets have waxed and waned, varying in size as the region’s climate
changed. As they fluctuated, the ice sheets would have captured so much
frozen water that sea levels around the world would have risen and
dropped accordingly.
The fate of the Antarctic ice sheets affects
all parts of the planet. For scientists modelling future climate, the
role the ice sheets play is one of the great unknowns, but it would
certainly be significant. They estimate that if the entire West
Antarctic Ice Sheet were to collapse, for example, it could raise global
sea level by up to 15 feet on average.
Counterintuitively,
because of the interactions between the ice sheet and the Earth’s crust,
the Northern Hemisphere would experience the biggest sea level rise
from melting Antarctic ice.
To gather hard geologic evidence of
how dynamic the ice cover has been in the past, and may be in the
future, John Stone of the University of Washington and his team traveled
to a remote region of the continent this past season.
“The aim
of this project is to determine whether the ice sheet in West Antarctica
has been thinner in the past,” Stone said. “Whether it has collapsed
and contracted to a much smaller version of its present self.”
They
flew deep into the barren landscape to drill down and collect a bedrock
sample buried under more than 100 meters of ice. By analyzing its
atomic properties, they’re able to test to see whether there was a time
when the ice sheets of West Antarctica were once just a shadow of what
they are today. The research was supported by the National Science
Foundation, which manages the U.S. Antarctic Program.
“There’s a
good deal of evidence from sea level change that ice sheets globally
were smaller during the last interglacial 125,000 years ago,” Stone
said. “So it’s widely presumed that West Antarctica participated in that
deglaciation that led to higher sea levels.”
The researchers
needed to get at the underlying bedrock beneath the ice that covers most
of the continent today. They’re looking for evidence that the rocks
once laid out on the surface, free of ice and totally exposed to cosmic
rays. While it’s common for glacial researchers to analyze rocks on the
surface to see how long they’ve been exposed, taking rock cores from
beneath the ice is new.
“The cosmic radiation interacts with… and
induces nuclear reactions inside the minerals of rocks, and changes
atoms from one chemical isotope to another,” Stone said. “When rocks
become exposed to cosmic rays they begin to build up quantities of
isotopes like beryllium-10, aluminum-26, chlorine-36, helium-3 and
neon-21, which are otherwise very rare isotopes.”
Many of these
atomic variants are radioisotopes that are unstable and break down into
other stable isotopes through radioactive decay. These radioisotopes
build up as long as the rocks are exposed, but when these rocks are
buried underneath multiple feet of cosmic-ray blocking ice, the
radioisotopes break down at predictable rates.
Different isotopes
have different rates of decay, or “half-lives,” which range from a few
microseconds, to billions of years. Stone and his team focused on
isotopes that have half-lives in the thousands and millions of years. By
looking at the ratios of these different isotopes, the researchers can
discern when the last time this rock had been exposed, and from that,
the history of the ice sheet over the last few hundred thousand years.
“We
will measure a whole family of isotopes which have different
radioactive half-lives,” Stone said. “By comparing the concentrations of
those isotopes, we’ll be able to tell whether the exposure was a long
time in the past, or whether it happened fairly recently.”
In
order to get to the rock still covered in ice, the team worked with a
drill designed by the U.S. Ice Drilling Program for subglacial bedrock
drilling known as the Agile Sub-Ice Geologic drill, or the ASIG drill.
It’s adapted from a commercially available drill used for mineral
exploration, but with a number of modifications to make it better at
drilling through ice rather than rock.
The team originally hoped
to take two cores during their field season. Unfortunately, just feet
away from finishing their first hole, there was a problem and it had to
be abandoned.
“That was a big disappointment, especially because it was the first of the two holes,” Stone said.
What
exactly happened is still unclear, but after several days of
troubleshooting, they made the decision to give up on their first
attempt. Despite the setback, they focused on making sure their second
attempt was successful...
https://antarcticsun.usap.gov/science/4305/
___________________________
The Arctic hasn’t been this warm for 3 million years – and that foreshadows big changes for the rest of the planet
October 5, 2020
https://www.arctictoday.com/the-arctic-hasnt-been-this-warm-for-3-million-years-and-that-foreshadows-big-changes-for-the-rest-of-the-planet/
___________________________
Arctic sea ice is on pace for a new record-low winter maximum
March 7, 2018
https://www.arctictoday.com/arctic-sea-ice-pace-new-record-low-winter-maximum/
___________________________
Bering Sea ice was the lowest in 150 years this winter
April 11, 2018
https://www.arctictoday.com/bering-sea-ice-lowest-150-years-winter/
___________________________
Russia confirms record high temperature in Arctic Siberia
June 30, 2020
https://www.arctictoday.com/russia-confirms-record-high-temperature-in-arctic-siberia/
___________________________
Siberia’s heat wave is a ‘warning cry’ from the Arctic, climate scientists say
June 25, 2020
https://www.arctictoday.com/siberias-heat-wave-is-a-warning-cry-from-the-arctic-climate-scientists-say/
___________________________
The 2016 Bering Sea heat wave was the warmest on record
December 27, 2017
https://www.arctictoday.com/the-2016-bering-sea-heat-wave-was-the-warmest-on-record/
___________________________
Arctic sea ice shrinks to its second-lowest annual minimum extent ever
September 21, 2020
https://www.arctictoday.com/arctic-sea-ice-shrinks-to-its-second-lowest-annual-minimum-extent-ever/
___________________________
Massive icebergs once roamed off coast of UK
24 April, 2025
A
new study reveals there was a time when massive icebergs, like the ones
we see in Antarctica today, were drifting less than 90 miles off the UK
coastline.
Scientists have for the first time discovered the
distinctive plough-marks these spectacular giants carved as their
undersides dragged across the floor of the North Sea, located off the
east coast of the UK, some 18,000 to 20,000 years ago.
https://www.bas.ac.uk/media-post/massive-icebergs-once-roamed-off-coast-of-uk/
___________________________
Arctic ice extent is unlikely to hit a record-low minimum, but lingering ice is ‘thin and porous’
August 21, 2020
https://www.arctictoday.com/arctic-ice-extent-is-unlikely-to-hit-a-record-low-minimum-but-lingering-ice-is-thin-and-porous/
___________________________
For the first time, scientists have seen the birth of an Arctic ice stream
January 2, 2020
“In the satellite images, it seems like the entire west wing of the ice cap is just dumping into the sea.”
https://www.arctictoday.com/for-the-first-time-scientists-have-seen-the-birth-of-an-arctic-ice-stream/
___________________________
Heavy summer rains speed permafrost thaw, a new study finds
August 3, 2020
https://www.arctictoday.com/heavy-summer-rains-speed-permafrost-thaw-a-new-study-finds/
___________________________
Arctic clouds are more vulnerable to pollution than once thought
February 6, 2018
https://www.arctictoday.com/arctic-clouds-vulnerable-pollution-thought/
___________________________
Is it snowing microplastics in Siberia? Russian scientists find airborne fibers in remote samples
March 19, 2021
https://www.arctictoday.com/is-it-snowing-microplastics-in-siberia-russian-scientists-find-airborne-fibers-in-remote-samples/
___________________________
Microplastics may affect how Arctic sea ice forms and melts
September 25, 2019
https://www.arctictoday.com/microplastics-may-affect-how-arctic-sea-ice-forms-and-melts/
___________________________
Microplastic hotspots mapped across the Southern Ocean reveal areas of potential ecological impact
30 December 2024
https://www.nature.com/articles/s41598-024-79816-y
___________________________
An unusually cool ‘blue blob’ in the North Atlantic is slowing glacier loss in Iceland
February 17, 2022
A
patch of unusually cold water in the North Atlantic Ocean, known as the
“blue blob,” could forestall some of Iceland’s glacier melt in the next
three decades, a new study says.
The cold water, south of
Iceland and Greenland, is creating more snowfall over Iceland,
replenishing the island’s glaciers as they melt and run off.

Fjallsarlon Glacier Lagoon with the Vatnajkull Glacier behind is seen on
Thursday August 12, 2021 in southeast Iceland within the vicinity of
Vatnajokull National Park, a UNESCO heritage site.
https://www.arctictoday.com/an-unusually-cool-blue-blob-in-the-north-atlantic-is-slowing-glacier-loss-in-iceland/
___________________________
How an underwater ‘heat blob’ could be contributing to Arctic sea ice loss
January 26, 2021
A complex global system of ocean currents is bringing more heat to the Arctic.
An
underwater “heat blob” from the Atlantic is exacerbating the warming of
the Arctic Ocean and contributing to the rapid disappearance of Arctic
sea ice, according to a study published in the journal Nature Climate
Change.
The study shows that the amount of heat transported to
the Nordic Seas and Arctic Ocean by ocean currents has increased
dramatically since 2001.
This poleward heat transport has been
implicated as one possible cause of the warming of the Arctic Ocean and
the rapid disappearance of Arctic sea ice.
As warm surface waters travel to regions further north, they lose heat and gain in salinity as freshwater evaporates.
[The Arctic Ocean is becoming more like the Atlantic and Pacific, studies say]
When
warm Atlantic water reaches the Arctic, it sinks to form a “heat blob”
because the cool, fresh water from the Arctic is less salty and thus
more buoyant.
This facilitates the formation of sea ice over the
ocean. However, the increased transmission of heat to northern latitudes
could hinder sea ice formation.
Scientists call this phenomenon “Atlantification.”
https://www.arctictoday.com/how-an-underwater-heat-blob-could-be-contributing-to-arctic-sea-ice-loss/
___________________________
Why winter sea ice re-growth in the Arctic has stalled — and what it means for the rest of the world
October 27, 2020
https://www.arctictoday.com/why-winter-sea-ice-re-growth-in-the-arctic-has-stalled-and-what-it-means-for-the-rest-of-the-world/
___________________________
Caves of Gas
April 26, 2017
Planet Earth is gassy.
All
over the world, plumes of gasses that formed deep under the planet’s
surface, pour out of active volcanoes and mix with the atmosphere.
Tobias Fischer, a volcanologist at the University of New Mexico, spent
two seasons exploring the frozen face of Antarctica’s Mount Erebus, the
world’s southernmost active volcano, to better understand these fumes
escaping from the depths of the Earth.
He and his team traveled
to Antarctica to take the closest look yet at the gasses seeping out of
the slopes of the volcano. Their project is supported by the National
Science Foundation, which manages the U.S. Antarctic Program.
Scientists
have been studying the fumes pouring out of the open crater at the peak
of the mountain for years, Fischer’s is the first major attempt to
understand the gasses coming off the sides, or the flank, of the
volcano. They want to get as complete a picture as possible of all the
emissions emanating from the mountain because they likely played a major
role in Earth’s prehistoric climate.
“The bigger question is to
understand what are the carbon-dioxide emissions from volcanoes
globally,” Fischer said. “If we want to understand how climate has been
influenced by carbon emissions from volcanoes, then we have to
understand how much carbon is actually coming out of volcanoes… Erebus
is a really good analogue, and so understanding that, we can use that
data, we can extrapolate back into Earth’s history to see how it might
have affected it.”
The gasses are the product of the Earth’s
solid outer crust melting deep below the surface. At depths of several
miles, the Earth’s rocky crust contacts the red-hot mantle. The
extremely high temperatures and pressures at those depths liquefy the
crust, releasing a range of gasses in the process.
What seeps out
is a mixture of carbon dioxide, sulfur, water, nitrogen and the noble
gases, some of which are common in normal air, but in very different
proportions. They flow up to the surface through the same magma tubes
that carry the molten rock up to crater of the volcano.
“Most of
the gas would come out through the crater. That’s the plume that you see
looking up at Erebus,” Fischer said. “But there’s also degassing going
on... this degassing happens much deeper and so the gas comes out on the
sides of the volcano.”
Measuring this flank degassing on
volcanos in other parts of the world is difficult because it’s hard to
spot where the invisible gasses leak out of the ground. However, because
a thick sheet of ice covers Mount Erebus, these warm gasses carve out
spectacular ice caves and ice towers that pinpoint exactly where these
seeps are located.
“Mount Erebus is the ideal laboratory volcano,” Fischer said.
As
the warm vapors rise out of the ground, they melt the overlying ice.
This can create the dramatic ice caves that pockmark the sides of Mount
Erebus. If the gasses are particularly hot, the water will evaporate and
then refreeze where it contacts the cold air, forming giant ice towers
called fumaroles.
Fischer and his team climbed into a number of these caves and fumaroles to sample the gasses that created them.
“Some
ice caves you can just walk in, they’re horizontal. Some of them you
have to climb up with rope and repel down into them,” Fischer said. “One
of the caves is called Sauna Cave, and you actually have to climb up
quite a bit then repel down 40 feet on a rope.”
Inside the caves,
the team looked for areas on the ground that were devoid of frost, the
surest sign that warm gasses were leaking out of the rocks at a
particular spot.
Evaluating the Effervescent Emissions of Mount Erebus
“In
the caves there are these areas that are warmer areas, but [the gasses]
are still really hard to collect because it’s very diffuse and to make
the measurements in the caves is challenging,” Fischer said.
When
they found a spot with seeping gas, they would insert a probe into the
ground connected to a pump. It drew in the emissions and pumped it into
the team’s sampling vials to bring back to their home institutions for
analysis.
“We don’t want to pump too fast because then we’re just
sucking in the ambient air, and we don’t want to pump too slow because
then there’ no gas coming through,” Fischer said. “Then we just leave it
for 12 hours or 24 hours or whatever works.”
They also brought
along an infrared spectrometer that they kept at camp. With it, they
could immediately analyze the carbon dioxide levels of the gasses they
collected.
“That’s extremely useful because you come all the way
here, and you collect these samples but you don’t know if you got
anything good,” Fischer said. “With that instrument that gives us really
good hints.”
Though he’s studying all of the gaseous emissions,
carbon dioxide is of particular interest to Fischer and his team. It’s a
way to better understand how this carbon dioxide emitted by volcanoes
affected Earth’s ancient climate.
Carbon dioxide is a greenhouse
gas that traps heat from the sun in Earth’s atmosphere. The more carbon
dioxide concentrated in the atmosphere, the more heat gets trapped and
the warmer the climate gets.
“We know that anthropogenic
emissions, what we put out by burning fossil fuels, are much higher than
what volcanoes put out, probably by a factor of 100,” Fischer said.
“But before anthropogenic emissions happened, volcanoes were the main
source of putting carbon into the atmosphere. And volcanic carbon
emissions in the past have very likely influenced climate.”
The team collected samples from ten different caves and is in the midst of processing and studying them.
Already
they encountered some surprising preliminary results. The team found
isotopic evidence that some the carbon dioxide they collected seems to
be coming from different sources below the surface. The main source is
likely directly from the magma deep underground, as expected. However,
in a few of the caves they found carbon dioxide with an isotope
signature that seems to hint that it was created by some other
underground process.
“It has implications for microbial life
below the surface,” Fischer said. “If there is an envelope of
hydrothermal water, perhaps the microbes live in that water. I don’t
know.”
The team is continuing to study and map where these
unusual samples came from on the mountain. It’s still too early to tell
for sure what’s casing these anomalous results, but the results are
tantalizing, and could lead to new directions for future research.
https://antarcticsun.usap.gov/science/4306/
___________________________
Oceans warming faster than expected, set heat record in 2018: scientists
January 16, 2019
https://www.arctictoday.com/oceans-warming-faster-than-expected-set-heat-record-in-2018-scientists/
___________________________
Warm water trapped in the Arctic could speed ice melt
September 4, 2018
Warm water is quickly accumulating about 50 meters below the surface of the Arctic Ocean, researchers found.
https://www.arctictoday.com/warm-water-trapped-arctic-waters-speed-ice-melt/
___________________________
A glacier that was once Greenland’s fastest melting is growing again — for now
March 27, 2019
Greenland’s
Jakobshavn Glacier, which for the past two decades had been rapidly
thinning and retreating, recently began advancing again, and has grown
in thickness, a new study from NASA scientists has found.
Jakobshavn,
which had been the single largest site of ice loss for the Greenland
ice sheet, shifted in 2016, according to the study, published Monday in
the journal Nature Geoscience.
[Greenland and the hunt for better climate science]
The
researchers, from NASA’s Oceans Melting Greenland project, attribute
that shift to locally cooler ocean waters — tied to a natural cycle in
the North Atlantic, explains National Geographic.
Jason Box, a
top Greenland ice expert who wasn’t part of the study team, told the
Associated Press that the findings came as a surprise, but that they
don’t mean a permanent reprieve for the glacier.
“The good news is that it’s a reminder that it’s not necessarily going that fast,” he said. “But it is going.”
The
study’s authors agree. One, OMG lead investigator Josh Willis, told USA
Today that the shift is a “temporary break,” and that “seeing the
oceans have such a huge impact on the glaciers is bad news for
Greenland’s ice sheet.”
Greenland’s ice continues to melt
rapidly, and a recent study found that it is the largest Arctic
contributor to global sea level rise.
But the new study
highlights the complexity of this melt and the difficulty scientists
face in measuring it — and it points the way toward future research
questions: “[P]rojections of Jakobshavn’s future contribution to
sea-level rise that are based on glacier geometry are insufficient, and
that accounting for external forcing is indispensable,” the study
authors wrote.
https://www.arctictoday.com/greenlands-fastest-melting-glacier-is-growing-again-for-now/
___________________________
Greenland glaciers melt five times faster than 20 years ago
November 13, 2023
https://www.arctictoday.com/greenland-glaciers-melt-five-times-faster-than-20-years-ago/
___________________________
A Greenland glacier is growing. That doesn't mean melting is over.
March 25, 2019
A
pulse of cooler water at its edge let part of the glacier gain some
mass. But overall, the melting across Greenland continues apace.
https://www.nationalgeographic.com/environment/article/one-part-of-greenland-ice-growing
___________________________
Greenland’s most critical glacier is suddenly gaining ice, but that might not be a good thing
March 28, 2019

A close-up of the Jakobshavn glacier.

A view of the Jakobshavn Glacier from the window of a NASA research plane.
https://www.cnn.com/2019/03/27/world/climate-change-greenland-glacier-growing-wxc-trnd/index.html
___________________________
Greenland and Antarctica are gaining ice inland, but still losing it overall
April 30, 2020

Antarctic ice shelves and Greenland glaciers (like the one pictured) on the coasts are melting faster than inland snow is accumulating, leading to overall ice loss.
https://www.sciencenews.org/article/greenland-antarctica-are-gaining-ice-inland-losing-melting-overall
___________________________
Major Greenland Glacier Is Growing
June 6, 2019

Jakobshavn Glacier in western Greenland is notorious for being the world’s fastest-moving glacier. It is also one of the most active, discharging a tremendous amount of ice from the Greenland Ice Sheet into Ilulissat Icefjord and adjacent Disko Bay—with implications for sea level rise. The image above, acquired on June 6, 2019, by the Operational Land Imager (OLI) on Landsat 8, shows a natural-color view of the glacier.
Jakobshavn has spent decades in retreat—that is, until scientists observed an unexpected advance between 2016 and 2017. In addition to growing toward the ocean, the glacier was found to be slowing and thickening. New data collected in March 2019 confirm that the glacier has grown for the third year in a row, and scientists attribute the change to cool ocean waters.
“The third straight year of thickening of Greenland’s biggest glacier supports our conclusion that the ocean is the culprit,” said Josh Willis, an ocean scientist at NASA’s Jet Propulsion Laboratory and principal investigator of the Oceans Melting Greenland (OMG) mission.

The maps above show how the glacier’s height changed between March 2016 and 2017 (top); March 2017 and 2018 (middle); and March 2018 and 2019 (bottom). The elevation data come from a radar altimeter that has been flown on research airplanes each spring as part of OMG. Blue areas represent where the glacier’s height has increased, in some areas by as much as 30 meters per year.
The change is particularly striking at the glacier’s front (solid blue area on the left) between 2016 and 2017. That’s when the glacier advanced the most, replacing open water and sea ice with towering glacial ice. The glacier has not advanced as much since then, but it continues to slow and thicken.
Willis compared the glacier’s behavior to silly putty. “Pull it from one end and it stretches and gets thinner, or squash it together and it gets thicker,” he said. The latter scenario is what is happening now as the glacier slows down: Notice that by the third year, thickening is occurring across an increasingly wide area.
Willis and colleagues think the glacier is reacting to a shift in a climate pattern called the North Atlantic Oscillation, which has brought cold water northward along Greenland’s west coast. Measurements of the temperatures collected by the OMG team show that the cold water has persisted.
“Even three years after the cold water arrived, the glacier is still reacting,” Willis said. “I’m really excited to go back this August and measure the temperature again. Is it still cold? Or has it warmed back up?”
https://earthobservatory.nasa.gov/images/145185/major-greenland-glacier-is-growing
___________________________
Ice Gains In Some Parts Of Antarctica Aren't Offsetting Its Losses [Infographic]
2019
In
the past week or so I have been reading a few articles and social media
posts on the subject of Antarctica gaining ice mass. The articles are
talking about information from a study released by NASA in 2015 showing
that snowfall on the Eastern part of the continent is more than enough
to offset the melting of glaciers in the West. The social media posts
have been talking about how this proves that climate change was a hoax
all along. After all, how can sea levels be rising from glaciers melting
if Antarctica is gaining mass year after year? I took some time to
research the issue and read the actual study and today I thought I would
take some time and write a few paragraphs to help set the record
straight on this topic.
The study in question
In 2015 a
study was published by NASA, the lead author was Jay Zwally, a
glaciologist with NASA Goddard Space Flight Center. The study showed
evidence that Antarctica had experienced a net gain of 112 billion tons
of ice annually between 1992 and 2001 and a gain of 82 billion tons
annually between 2003 and 2008. This information was not at all in line
with previous findings on the subject which insisted that Antarctica has
been losing ice mass because of global warming.
These new
findings were based on data that came from studying changes in the
surface height of the Antarctic ice sheet using radar altimeters. The
data was collected using two European Space Agency European Remote
Sensing satellites and NASA’s Ice, Cloud, and land Elevation Satellite.
Basically,
the study shows that gains in snowfall in East Antarctica are more than
enough to offset the losses from melting glaciers on the West side of
the continent. These gains were not just in recent years but had been
the result of increased snowfall over the past 10,000 years or since the
last ice age. The study goes on to say that sea levels cannot be rising
because of glaciers melting in Antarctica because its actually gaining
ice.
Issues with the study
This information came as a bit
of a shock. After all the International Panel on Climate Change had been
releasing reports for a long time stating that Antarctica has been
losing mass and causing sea levels to rise. With this study saying the
opposite it’s clear that somebody had to be wrong. With that in mind,
the scientific community was cautious with this new information.
Since
2015 scientists have had a chance to look over the data and have had
time to do a few follow-up studies and the results are clear.
It
is agreed among scientists studying the situation that the Eastern area
is gaining a lot of ice due to thousands of years of continued snowfall.
However, measuring the size of that gain can be difficult at best. The
major issues with Zwally’s study are that it used altimeter data from
satellites, which is subject to systematic errors such as snowpack
penetration and telling the difference between snow that is on the
ground and snow that is still falling. Also, in order to calibrate their
measurements, Zwally’s team bounced lasers of the Southern Ocean which
may not have been reliable...
https://www.forbes.com/sites/kevinanderton/2019/02/21/ice-gains-in-some-parts-of-antarctica-arent-offsetting-its-losses-infographic/?sh=5dfca5cc7030
___________________________
Synchronous Retreat of Southeast Greenland's Peripheral Glaciers
2022
https://agupubs.onlinelibrary.wiley.com/doi/epdf/10.1029/2022GL097756
___________________________
Climate change: For 25th year in a row, Greenland ice sheet shrinks
7 January 2022
https://news.un.org/en/story/2022/01/1109352
___________________________
New observations from ICESat-2 show remarkable Arctic sea ice thinning in just three years
10 March 2022
https://news.agu.org/press-release/new-observations-from-icesat-2-show-remarkable-arctic-sea-ice-thinning-in-just-three-years/
___________________________
Nunavik is gaining ground while other coastlines erode
November 1, 2019
If
you stand on the beach in Kuujjuaraapik on the Hudson Bay coast, your
feet are firmly planted in Nunavik and, furthermore, Quebec.
But if you dip your toes in the frigid water, they are now in Nunavut.
The
strange circumstances of Quebec’s northern border are a source of
contention for the provincial government, which has sought to extend its
jurisdiction into these waters.
But in the meantime, as a result of geomorphological changes, Nunavik is literally gaining ground.
While
some other Arctic shorelines are eroding due to permafrost thaw or
diminishing sea ice — take Tuktoyaktuk, Northwest Territories, for
example — Nunavik’s shoreline is seeing the opposite.
What’s
happening is a process called glacial isostatic adjustment, or glacial
rebound. That’s when land once compressed by the weight of glaciers some
10,000 years ago is still slowly bouncing back to its natural height.
It’s rising at a rate of between five and 13 millimeters per year, according to a recent study.
“There
are very few places in the world where we can see sea level fall,” said
Antoine Boisson, who completed his PhD by taking an inventory of the
Nunavik coastline, its unique features and evolution.
His thesis
hasn’t yet been validated by Environment Canada, but that process is
underway through its eSPACE program on Arctic coastal ecosystems.
Boisson’s
work, under the supervision of Laval University’s Michel Allard, was in
partnership with Quebec’s Ministry of Sustainable Development,
Environment and Fight Against Climate Change, and will be used by the
Kativik Regional Government in developing community emergency responses
and land-use plans.
Up until now only a few studies have been done on portions of the Nunavik coastline, and in varying detail.
“Research on coastal processes and landforms in Nunavik is scattered,” Boisson said.
He
said his work is the first comprehensive look at the entire
10,000-kilometer stretch of the coastline from Kuujjuaraapik to the
eastern tip of Ungava Bay.
This included a survey by helicopter
where researchers captured 47 hours of video and 40,000 photographs of
Nunavik’s three coastal regions: Hudson Bay, Hudson Strait and Ungava
Bay.
In all three regions, glacial rebound is mitigating the impacts of climate change and coastal risks affecting most other areas.
“In Kuujjuaraapik, the emergence rate is 1.3 meters per century. The land is emerging at a huge rate,” said Boisson.
Surpassing
sea level rise, this emergence of the land is creating coastal features
like raised beaches and boulder barricades — various rows of boulders
up the sloping shore, as Boisson documented in Ungava Bay.
There
are also areas where, unlike in most Arctic regions, the permafrost has
been increasing in thickness since 2010 due to lower temperatures —
though this isn’t the norm across Nunavik.
“When I speak at
international conferences, I’m maybe the only one that sees sea level
fall, the emergence of land and almost no erosion,” said Boisson.
But,
he added, coastal risks shouldn’t be underestimated, because an
increase in storm surges, which is when the sea level rises during a
storm, and other variables could still threaten communities.
And
there are outliers among the formations he’s studied, including a sand
cliff in Umiujaq that has eroded at a rate of one meter per year for the
past five years.
Areas like this, with little protection from
islands off the coast, are more vulnerable to coastal erosion. That’s
because the wind has a greater distance to pick up speed, creating big
waves, as well as storm surges.
In the future, events like surges
and permafrost thaw could be a particular risk for communities on sandy
grounds, like Umiujaq, Inukjuak, Akulivik and Salluit, which lack the
stability of a rocky coastline.
“Coastal erosion is considered low compared to other regions, like Tuktoyaktuk, but it should not be overlooked,” said Boisson.
Global
sea level rise is expected to continue to exceed the rate of land
elevation, but on the Nunavik coast, the sea level will still fall for
the next hundred years, only at a gradually lower rate, according to his
research.
But more study is needed in this area, Boisson said, to capture the dynamic nature of the coast and where risks could exist.
https://www.arctictoday.com/nunavik-gaining-ground-where-other-coastlines-erode/
___________________________
Study: Erosion has made the Bering Strait a meter deeper on the Alaska side than it used to be
June 26, 2023
https://www.arctictoday.com/study-erosion-has-made-the-bering-strait-a-meter-deeper-on-the-alaska-side-than-it-used-to-be/
___________________________
We built an AI model that analysed millions of images of retreating glaciers – what it found is alarming
January 21, 2025
https://www.arctictoday.com/we-built-an-ai-model-that-analysed-millions-of-images-of-retreating-glaciers-what-it-found-is-alarming/
___________________________
This year’s Arctic sea ice minimum extent is tied for tenth lowest on record
September 23, 2022
https://www.arctictoday.com/this-years-arctic-sea-ice-minimum-extent-is-tied-for-tenth-lowest-on-record/
___________________________
Arctic has not been as warm as today in over 7,500 years, study says
August 25, 2022
https://www.arctictoday.com/arctic-has-not-been-as-warm-as-today-in-over-7500-years-study-says/
___________________________
Record-smashing heatwaves are hitting Antarctica and the Arctic simultaneously
March 25, 2022
https://www.arctictoday.com/record-smashing-heatwaves-are-hitting-antarctica-and-the-arctic-simultaneously/
___________________________
Across the Arctic, lake ice is melting out earlier in the spring
January 3, 2017
https://www.arctictoday.com/across-the-arctic-lake-ice-is-melting-out-earlier-in-the-spring/
___________________________
A melting glacier keeps shrinking Sweden’s highest mountain
August 24, 2020
The glacier that tops what was once the country’s highest summit has shrunk by a meter each year this century.
https://www.arctictoday.com/a-melting-glacier-keeps-shrinking-swedens-highest-mountain/
___________________________
Tectonic evolution
April 29, 2011
Geologists study ancient Antarctic landscape as possible influence on climate
The
Earth went into a deep freeze that lasted from about 350 to 275 million
years ago when the climate passed into a greenhouse world that
persisted until about 40 million years ago, the beginning of the present
ice age...
https://antarcticsun.usap.gov/science/2415/
___________________________
Ocean acidification
February 8, 2008
Calcifying sea critters may pay the price for increasing levels of carbon dioxide in the atmosphere
Victoria Fabry and Brad Seibel study what’s come to be known as “the other CO2 problem.”
Most
of us are familiar with the first problem: The copious discharge of
carbon dioxide, the primary greenhouse gas, into the atmosphere is
forcing the Earth’s temperature to rise, causing a wide range of
disruptions and changes to the world’s climate.
The oceans play
an integral role in mitigating some of that CO2 by absorbing about a
third of it as what scientists call a “carbon sink.” But that benefit
comes at a cost to marine critters and ecosystems, as the carbon dioxide
begins to change the seawater chemistry of the oceans.
A leading
expert in ocean acidification from California State University San
Marcos, Fabry is the principal investigator for a team of scientists in
Antarctica studying how Southern Ocean pteropods, small gastropod
mollusks (sea snails and slugs), may respond to higher acidic levels of
seawater predicted for the next century.
These animals may be
particularly vulnerable to seawater chemistry change because, as the
oceans become more acidified and the pH level decreases, their ability
to calcify and form shells and skeletons may be severely affected.
“Ocean
acidification is going to impact many organisms that calcify,” Fabry
said from her office at the Albert P. Crary Engineering and Science
Center in McMurdo Station. “It’s going to happen in our lifetimes. It’s
not far away.”
The pH level, measured in units, is a calculation
of the balance of a liquid’s acidity and alkalinity. The lower a
liquid’s pH number, the higher its acidity. The pH level for the world’s
oceans was stable for tens of thousands of years, but has dropped
one-tenth of a unit since the Industrial Revolution in the 1800s.
That
represents a significant decrease, Fabry said, and current models
predict the pH level may drop by as much as four-tenths of a unit by
2100 relative to the pre-industrial value. That could mean big trouble
for calcifying organisms, particularly in the higher latitudes of the
Arctic and Antarctic.
The reason: Most pteropods and other
calcifiers, like corals, use the calcium carbonate minerals of calcite
or aragonite to construct their shell coverings or skeletons. Normally,
surface seawater is not corrosive to calcite and aragonite because the
carbonate ion is at supersaturating concentrations. However, as ocean pH
falls, so does the concentration of the carbonate ion.
Higher
latitude waters are naturally less saturated, so the change in chemistry
would affect these areas first. By 2040, under some CO2 emissions
scenarios, surface waters of some regions may become undersaturated of
aragonite, making those calcium carbonate structures constructed of
aragonite vulnerable to dissolution.
At the end of the century,
projections say most of the Southern Ocean and some regions of the
subarctic Pacific will become undersaturated with respect to aragonite
if CO2 emissions continue in a business-as-usual scenario. Data on the
Arctic Ocean are pending.
“The high latitudes are the first areas
that will have large expanses of surface waters that will be
undersaturated with respect to aragonite. It’s not looking good,” Fabry
said. “With increasing oceanic uptake of atmospheric CO2, we see CO2
increasing in the water and pH declining at time series stations at
Bermuda, Hawaii and the Canary Islands. … And in high latitudes such as
the Southern Ocean, what we’re going to have in the coming decades is
surface seawater that is corrosive to aragonite. ”
https://antarcticsun.usap.gov/science/1343/
___________________________
The magnetic North Pole is moving fast enough to worry scientists
January 24, 2019
And the U.S. government shutdown means NOAA scientists, who would normally be monitoring the movement, are furloughed.
The magnetic North Pole is moving at an alarming rate and forcing researchers to update a navigational model.
According
to The Washington Post, almost half of the employees from the National
Oceanic and Atmospheric Administration, which is responsible for
updating the World Magnetic Model, are on furlough due to the government
shutdown, as the Democrat-controlled House of Representatives refuses
to fund U.S. President Donald Trump’s $5 billion border wall.
[A shifting north magnetic pole forces an unprecedented navigation fix]
Earth’s
poles naturally shift and change due to unpredictable flows of molten
liquid iron at the Earth’s core caused by the planet’s rotation. This
liquid’s movement creates the Earth’s magnetic field.
However, an
article posted in the journal Nature shows that the Earth’s magnetic
North Pole has been moving at an unprecedented rate. The movement began
in the mid-1990s and it is now headed towards Siberia at roughly 55
kilometers per year.
Scientists from the NOAA and the British Geological Survey study and update the World Magnetic Model every five years.
However,
due to the dramatic movement, the model needs to be updated earlier
than scheduled. The current government shutdown has forced the NOAA to
postpone the update from January 15 to January 30.
This model is
necessary for accurate civilian and military navigation. According to
the report, the abrupt changes may be due to a geomagnetic pulse that
occurred beneath South America in 2016.
In 2017, Phil Livermore a
geophysicist from the University of Leeds detected a high-speed jet of
liquid iron beneath Canada that seemed to be weakening the magnetic
field in that area. Livermore believes this could be linked to the
current changes in the earth’s magnetic field.
https://www.arctictoday.com/the-magnetic-north-pole-is-moving-fast-enough-to-worry-scientists/
___________________________
Scientists keep increasing their projections for how much the oceans will rise this century
April 27, 2017
https://www.arctictoday.com/scientists-keep-increasing-their-projections-for-how-much-the-oceans-will-rise-this-century/
___________________________
Submarine glide blocks from the Lower Cretaceous of the Antarctic Peninsula
1985
https://www.deepdyve.com/lp/wiley/submarine-glide-blocks-from-the-lower-cretaceous-of-the-antarctic-qvWV1qcJQR
___________________________
In-depth Q&A: The IPCC’s special report on the ocean and cryosphere
25 September 2019
Earlier today in Monaco, the Intergovernmental Panel on Climate Change (IPCC) published its special report on the ocean and cryosphere in a changing climate – or “SROCC” for short.
“All people on Earth depend directly or indirectly on the ocean and cryosphere,” the report warns, noting that “human communities in close connection with coastal environments, small islands, polar areas and high mountains are particularly exposed” to changes, such as sea level rise and melting glaciers.
It is “virtually certain” that the global ocean has warmed unabated since 1970, the report stresses, while “global warming has led to widespread shrinking of the cryosphere”.
These changes are increasingly pushing adaptation responses “to their limits”, with the most vulnerable people having “the lowest capacity” to respond. Sustainable development and climate change resilience depend “critically on urgent and ambitious emissions reductions coupled with coordinated sustained and increasingly ambitious adaptation actions”.
In this detailed Q&A, Carbon Brief unpacks what the report says about how climate change is affecting the Earth’s ice and oceans – and the wider impacts that is having on sea levels, marine life and human society, as well as extreme events and potential “tipping points”.
Each section below (click on hyperlinks to jump down) explains, in turn, all of the report’s key findings. They include…
- The need for this report:“Pervasive ocean and cryosphere changes…are already being caused by human-induced climate change.”
- High mountain areas: Glaciers could lose a fifth of their mass this century if emissions are low, and more than 80% in regions such as Central Europe.
- Sea ice: There is “very high confidence” that Arctic sea ice has declined in all months of the year and around half the summer loss is due to human-caused warming.
- Ice sheets: Greenland melt is unprecedented in at least 350 years. With rising Antarctic loss, ice sheets are now contributing 700% more to sea levels than two decades ago.
- Implications of polar warming: Polar bears are travelling further due to less ice, while Arctic peoples and marine life face rising negative impacts due to warming.
- Abrupt changes and ‘tipping points’: The AMOC ocean current that brings warm water to Europe may already have weakened by 15%, but is “very unlikely to collapse” this century.
- Permafrost: Arctic near-surface permafrost faces “widespread disappearance”, with a 30-99% decrease in area if emissions are very high, releasing 10s to 100s of billions of tonnes of CO2.
- Sea level rise: The rate is accelerating and is “unprecedented” over the past century. Worst-case projections are higher than thought and a 2m rise by 2100 “cannot be ruled out”.
- Impacts for coasts and islands: Warming could “drastically alter” migration flows. If emissions are high, some island nations are “likely” to become “uninhabitable” this century.
- Marine life: Marine mammals could decline by 15% and fisheries by a quarter this century, if emissions are very high, while “almost all coral reefs will degrade” even if emissions are low.
- Extreme events: Cyclones, marine heatwaves and other extremes are becoming more severe and will exceed the limits of adaptation, causing “unavoidable loss and damage”.
- Socioeconomic implications: Changes to oceans and the cryosphere will impede the UN’s sustainable development goals and could expand the range of disease threats.
https://www.carbonbrief.org/in-depth-qa-the-ipccs-special-report-on-the-ocean-and-cryosphere/
___________________________
Earth's cryosphere shrinking by 87,000 square kilometers per year
July 1, 2021
Summary:
A new study reports the first global assessment of the extent of snow
and ice cover on Earth's surface -- a critical factor cooling the planet
through reflected sunlight -- and its response to warming temperatures.
The
global cryosphere -- all of the areas with frozen water on Earth --
shrank by about 87,000 square kilometers (about 33,000 square miles), a
area about the size of Lake Superior, per year on average, between 1979
and 2016 as a result of climate change, according to a new study. This
research is the first to make a global estimate of the surface area of
the Earth covered by sea ice, snow cover and frozen ground.
https://www.sciencedaily.com/releases/2021/07/210701195242.htm
___________________________
Sea Ice Can Control Antarctic Ice Sheet Stability, New Research Finds
2022
https://wattsupwiththat.com/2022/05/14/sea-ice-can-control-antarctic-ice-sheet-stability-new-research-finds/
___________________________
Evolution of global temperature over the past two million years
2016
https://climate.fas.harvard.edu/files/climate/files/snyder_2016.pdf
___________________________
Ocean Cooling and Global Warming
April 1, 2008
https://archive.nytimes.com/dotearth.blogs.nytimes.com/2008/04/01/ocean-cooling-and-global-warming/
___________________________
Antarctic and Southern Ocean influences on Late Pliocene global cooling
https://dspace.library.uu.nl/handle/1874/252854
___________________________
Beetle study finds diversity in the sub-Antarctic linked to global cooling
June 10, 2021
https://phys.org/news/2021-06-beetle-diversity-sub-antarctic-linked-global.html
___________________________
Adaptation to Extreme Conditions: Thermal Water Biofilm Studies Could Help Understand Ancient Ecosystems
March 7, 2025
https://astrobiology.com/2025/03/adaptation-to-extreme-conditions-thermal-water-biofilm-studies-could-help-understand-ancient-ecosystems.html
___________________________
Global cooling yielded modern ecosystems 7 million years ago
Sept. 27, 2016
PROVIDENCE, R.I., Sept. 27 (UPI) -- Many of Earth's ecosystems got their start some 7 million years ago, as global temperatures began to plummet.
According to new research by scientists at Brown University, a prolonged period of global cooling at the end of the Miocene epoch ushered in the expansion of grasslands across Africa and Asia, as well as North and South America.
___________________________
Mackenzie River caused global cooling 13,000 years ago, study suggests
July 13, 2018
'It's something very active, and it's happening today,' says scientist
https://www.cbc.ca/news/canada/north/mackenzie-river-global-cooling-1.4742707
___________________________
Impact of global cooling on Early Cretaceous high pCO2 world during the Weissert Event
13 September 2021
https://www.nature.com/articles/s41467-021-25706-0
___________________________
Study debunks 'global cooling' concern of '70s
February 23, 2008
The supposed "global cooling" consensus among scientists in the 1970s — frequently offered by global-warming skeptics as proof that climatologists can't make up their minds — is a myth, according to a survey of the scientific literature of the era.
The '70s was an unusually cold decade. Newsweek, Time, The New York Times and National Geographic published articles at the time speculating on the causes of the unusual cold and about the possibility of a new ice age.
But Thomas Peterson of the National Climatic Data Center surveyed dozens of peer-reviewed scientific articles from 1965 to 1979 and found that only seven supported global cooling, while 44 predicted warming. Peterson says 20 others were neutral in their assessments of climate trends.
The study reports, "There was no scientific consensus in the 1970s that the Earth was headed into an imminent ice age.
"A review of the literature suggests that, to the contrary, greenhouse warming even then dominated scientists' thinking about the most important forces shaping Earth's climate on human time scales."
"I was surprised that global warming was so dominant in the peer-reviewed literature of the time," says Peterson, who was also a contributor to the United Nations' Intergovernmental Panel on Climate Change 2007 report.
Scientific reports in the past decade, most notably the U.N. panel's Nobel Prize-winning efforts, have warned that human activities are warming the planet by increasing the release of heat-trapping "greenhouse" gases into the atmosphere.
Skeptics have argued that climate change is cyclical, not fueled by the burning of fossil fuels — coal, oil and natural gas. Peterson notes in the study that concerns over the frigid 1970s subsequently became representative of scientific division over global warming.
That was an unusually cold decade, especially the later years, across the Northern Hemisphere. In the USA, the winters of 1977-79 were three of the 11 coldest since the recording of temperatures began in the 1890s, according to climate center data. The winter of 1978-79 remains the coldest on record in the USA.
https://abcnews.go.com/Technology/story?id=4335191&page=1
___________________________
Antarctic and Southern Ocean influences on Late Pliocene global cooling
April 11, 2012
Abstract
https://ccoc.stanford.edu/publications/antarctic-and-southern-ocean-influences-late-pliocene-global-cooling
___________________________
Increasing Antarctic Sea Ice under Warming Atmospheric and Oceanic Conditions
2006
http://psc.apl.washington.edu/zhang/Pubs/Zhang_Antarctic_20-11-2515.pdf
___________________________
Forcing of the Wintertime Antarctic Boundary Layer Winds from the NCEP–NCAR Global Reanalysis
2000
http://polarmet.osu.edu/PMG_publications/parish_cassano_jam_2001.pdf
___________________________
Driving force behind global cooling in the Cenozoic: an ongoing mystery
23 December 2015
Abstract
The stepwise cooling marks the long-time global climate change during the Cenozoic, particularly since the Oligocene/Eocene boundary. This climatic evolution has been punctuated by several warming such as the peak Cenozoic warmth at 52 Ma, the late Oligocene warming at ~25 Ma and the Mid-Miocene Climatic Optimum at 17–14 Ma. Concurring with the global temperature changes, the Asian paleoenvironment has been modulated by the global cooling and the tectonic uplift during the Cenozoic, but what have driven the global climatic changes remains unresolved. In this review paper, I hypothesize that a threshold CO2 level in combination with favorable orbital configuration, ocean circulation, enhanced ice albedo and possible roles of silicate mineral and basalt weathering together facilitated the development of glaciations in the Cenozoic and the past temperature change. The synchronous variations between Earth’s surface temperature and atmospheric CO2 level may indicate that the atmospheric CO2 content is the direct driving force for the global climatic cooling, but this hypothesis needs testing by using high-resolution geological record and paleoclimatic modeling.
https://link.springer.com/article/10.1007/s11434-015-0973-y
___________________________
Sharks that hunted near Antarctica millions of years ago recorded Earth’s climate history in their teeth
July 12, 2021
https://theconversation.com/sharks-that-hunted-near-antarctica-millions-of-years-ago-recorded-earths-climate-history-in-their-teeth-164056
___________________________
Shark teeth found in Antarctica unlock mystery of Earth’s ancient climate cooling
July 15, 2021
Some 50 million years ago, the Earth shifted to a cooler climate. Here’s why
https://www.zmescience.com/science/shark-teeth-found-in-antarctica-unlock-mystery-of-earths-ancient-climate-cooling/
___________________________
Global Cooling Hiatus Driven by an AMOC Overshoot in a Carbon Dioxide Removal Scenario
08 July 2021
https://agupubs.onlinelibrary.wiley.com/doi/10.1029/2021EF002165
___________________________
A permafrost warming in a cooling Antarctica?
30 June 2011
Abstract
The magnitude and even direction of recent Antarctic climate change is still debated because the paucity of long and complete instrumental data records. While along Antarctic Peninsula a strong warming coupled with large retreat of glaciers occurred, in continental Antarctica a cooling was recently detected. Here, the first existing permafrost data set longer than 10 years recorded in continental Antarctica is presented. Since 1997 summer ground surface temperature showed a strong warming trend (0.31°C per year) although the air temperature was almost stable. The summer ground surface temperature increase seemed to be influenced mainly by the increase of the total summer radiation as confirmed also by the increase of the summer thawing degree days. In the same period the active layer exhibited a thickening trend (1 cm per year) comparable with the thickening rates observed in several Arctic locations where air warming occurred. At all the investigated depths permafrost exhibited an increase of mean annual temperature of approximately 0.1°C per year. The dichotomy between active layer thickness and air temperature trends can produce large unexepected and unmodelled impacts on ecosystems and CO2 balance.
https://link.springer.com/article/10.1007/s10584-011-0137-2
___________________________
CO2 Snow Deposition in Antarctica to Curtail Anthropogenic Global Warming
01 Feb 2013
Abstract
A scientific plan is presented that proposes the construction of carbon dioxide (CO2) deposition plants in the Antarctic for removing CO2 gas from Earth’s atmosphere. The Antarctic continent offers the best environment on Earth for CO2 deposition at 1 bar of pressure and temperatures closest to that required for terrestrial air CO2 “snow” deposition—133 K. This plan consists of several components, including 1) air chemistry and CO2 snow deposition, 2) the deposition plant and a closed-loop liquid nitrogen refrigeration cycle, 3) the mass storage landfill, 4) power plant requirements, 5) prevention of dry ice sublimation, and 6) disposal (or use) of thermal waste. Calculations demonstrate that this project is worthy of consideration, whereby 446 deposition plants supported by sixteen 1200-MW wind farms can remove 1 billion tons (1012 kg) of carbon (1 GtC) annually (a reduction of 0.5 ppmv), which can be stored in an equivalent “landfill” volume of 2 km × 2 km × 160 m (insulated to prevent dry ice sublimation). The individual deposition plant, with a 100 m × 100 m × 100 m refrigeration chamber, would produce approximately 0.4 m of CO2 snow per day. The solid CO2 would be excavated into a 380 m × 380 m × 10 m insulated landfill, which would allow 1 yr of storage amounting to 2.24 × 10⁻³ GtC. Demonstrated success of a prototype system in the Antarctic would be followed by a complete installation of all 446 plants for CO2 snow deposition and storage (amounting to 1 billion tons annually), with wind farms positioned in favorable coastal regions with katabatic wind currents.
https://journals.ametsoc.org/view/journals/apme/52/2/jamc-d-12-0110.1.xml
___________________________
Misleading posts claim record Antarctica cold disproves global warming
October 22, 2021
https://factcheck.afp.com/http%253A%252F%252Fdoc.afp.com%252F9Q68LD-1
___________________________
Drop in Greenhouse Gas Caused Global Cooling 34 Million Years Ago, Study Finds
August 6, 2021
https://www.smithsonianmag.com/blogs/national-museum-of-natural-history/2021/08/06/greenhouse-gas-caused-global-cooling-34-million-years-ago-study-finds/
___________________________
Global cooling linked to increased glacial carbon storage via changes in Antarctic sea ice
14 October 2019
Abstract
Palaeo-oceanographic reconstructions indicate that the distribution of global ocean water masses has undergone major glacial–interglacial rearrangements over the past ~2.5 million years. Given that the ocean is the largest carbon reservoir, such circulation changes were probably key in driving the variations in atmospheric CO2 concentrations observed in the ice-core record. However, we still lack a mechanistic understanding of the ocean’s role in regulating CO2 on these timescales. Here, we show that glacial ocean–sea ice numerical simulations with a single-basin general circulation model, forced solely by atmospheric cooling, can predict ocean circulation patterns associated with increased atmospheric carbon sequestration in the deep ocean. Under such conditions, Antarctic bottom water becomes more isolated from the sea surface as a result of two connected factors: reduced air–sea gas exchange under sea ice around Antarctica and weaker mixing with North Atlantic Deep Water due to a shallower interface between southern- and northern-sourced water masses. These physical changes alone are sufficient to explain ~40 ppm atmospheric CO2 drawdown—about half of the glacial–interglacial variation. Our results highlight that atmospheric cooling could have directly caused the reorganization of deep ocean water masses and, thus, glacial CO2 drawdown. This provides an important step towards a consistent picture of glacial climates.
https://www.nature.com/articles/s41561-019-0466-8
___________________________
Fact Check: Six months of record cold temperatures at the South Pole Amundsen-Scott station does not discredit climate change
November 8, 2021
https://www.reuters.com/article/factcheck-antarctica-cold-idUSL1N2RZ1X4
___________________________
Plate tectonics as a driver for cooling around Antarctica during global climate transition from greenhouse to icehouse
9 November 2021
High-resolution simulations of ocean circulations 34 million years ago
are shedding a new light on the 50-year-old question about how and why
the Antarctic ice sheets formed. The simulations show that the tectonic
opening of Southern Ocean seaways caused a fundamental reorganisation
of ocean currents, heat transport and initiated a strong Antarctic
surface water cooling of 5 °C. The new study conducted by an
international team of researchers has been published in the November 9th issue of Nature Communications.
https://www.uu.nl/en/news/plate-tectonics-cooling-antarctica
___________________________
GLOBAL WARMING? NASA says Antarctic has been COOLING for past SIX years
Nov 28, 2015
https://www.express.co.uk/news/science/622043/GLOBAL-WARMING-NASA-Antarctic-COOLING-six-years-Arctic-north-pole-climate-change
___________________________
50 years ago, scientists puzzled over a slight global cooling
Sulfate pollution turned out to be the culprit
November 21, 2019
https://www.sciencenews.org/article/50-years-ago-scientists-puzzled-over-slight-global-cooling
___________________________
Climate paradox: Warming is cooling parts of Antarctica
06/24/2021
https://www.eenews.net/articles/climate-paradox-warming-is-cooling-parts-of-antarctica/
___________________________
One part of Antarctica has been cooling since 1998 – here’s why
2016
https://www.newscientist.com/article/2098187-one-part-of-antarctica-has-been-cooling-since-1998-heres-why/
___________________________
Prehistoric global cooling caused by CO2, research finds
February 26, 2009
https://www.purdue.edu/uns/x/2009a/090226HuberPete.html
___________________________
Response of the Pacific inter-tropical convergence zone to global cooling and initiation of Antarctic glaciation across the Eocene Oligocene Transition
2016
https://pubmed.ncbi.nlm.nih.gov/27507793/
___________________________
Antarctica is colder than the Arctic, but it’s still losing ice
https://www.climate.gov/news-features/features/antarctica-colder-arctic-it%E2%80%99s-still-losing-ice
___________________________
Far-Drifting Antarctic Icebergs Are Trigger of Ice Ages, Scientists Say
January 13, 2021
https://news.climate.columbia.edu/2021/01/13/far-drifting-antarctic-icebergs-trigger-ice-ages/
___________________________
Antarctic sea ice reaches new record-low in February 2022
2022-03-13
https://cryo.met.no/en/antarctic-seaice-minimum-2022
___________________________
Southern Ocean cooling in a warming world
https://news.mit.edu/2016/southern-ocean-cooling-in-a-warming-world-0624
___________________________
Societal importance of Antarctic negative feedbacks on climate change: blue carbon gains from sea ice, ice shelf and glacier losses
2021
https://www.ncbi.nlm.nih.gov/pmc/articles/PMC8423686/
___________________________
Colossal volcano behind 'mystery' global cooling Finally Found
2019
https://www.nationalgeographic.com/science/article/colossal-volcano-behind-mystery-global-cooling-found
___________________________
East Antarctic Summer Cooling Trends Caused by Tropical Rainfall Clusters
https://www.enn.com/articles/68119-east-antarctic-summer-cooling-trends-caused-by-tropical-rainfall-clusters
___________________________
Unusually strong cold weather outbreak spreads from Antarctica into central South America, bringing early winter temperature records and first snowfall after decades
04/07/2021
https://www.severe-weather.eu/global-weather/south-hemisphere-america-cold-winter-outbreak-fa/
___________________________
Water vapor in cold and clean atmosphere: a 3-year data set in the boundary layer of Dome C, East Antarctic Plateau
2022
https://essd.copernicus.org/articles/14/1571/2022/
___________________________
Simulations show Antarctica's only insect is at risk due to global warming
2022
https://phys.org/news/2022-07-simulations-antarctica-insect-due-global.html
___________________________
Antarctica is warming, not cooling: study
January 22, 2009
https://www.reuters.com/article/us-antarctica-warming-idUSTRE50K5BM20090121
___________________________
Antarctic icebergs reduce effects of global warming in Southern Hemisphere
Aug. 13, 2019
Antarctic icebergs can temper or delay the impacts of global warming in the Southern Hemisphere, according to a new study.
The big picture is simple: as the concentration of greenhouse gases in the atmosphere grows, the planet gets warmer. Reality is more complicated. Hundreds of feedback mechanisms and thousands of variables can influence how quickly the planet warms.
https://www.upi.com/Science_News/2019/08/13/Antarctic-icebergs-reduce-effects-of-global-warming-in-Southern-Hemisphere/8461565695062/
___________________________
Why Is the South Pole Warming So Quickly? It's Complicated
2020
https://www.scientificamerican.com/article/why-is-the-south-pole-warming-so-quickly-its-complicated/
___________________________
Parts of Antarctica have been 40°C warmer than their March average
But a lesser heatwave in the Arctic may be of more concern
Mar 24th 2022
https://www.economist.com/graphic-detail/2022/03/24/parts-of-antarctica-have-been-40degc-warmer-than-their-march-average
___________________________
Atmospheric boundary layer fluxes in the Antarctic Sea ice zone
2016
http://polarmet.osu.edu/AMOMFW_2016/0608_1100_Weiss.pdf
___________________________
Natural ocean fluctuations could help explain Antarctic sea ice changes
https://www.carbonbrief.org/natural-ocean-fluctuations-help-explain-antarctic-sea-ice-changes/
___________________________
A high-end sea level rise probabilistic projection including rapid Antarctic ice sheet mass loss
2017
https://iopscience.iop.org/article/10.1088/1748-9326/aa6512
___________________________
West Antarctic Ice Sheet retreat in the Amundsen Sea driven by decadal oceanic variability
13 August 2018
https://www.nature.com/articles/s41561-018-0207-4
___________________________
Seasonal sea ice changes in the Amundsen Sea, Antarctica, over the period of 1979–2014
June 2015
https://www.researchgate.net/publication/281266345_Seasonal_sea_ice_changes_in_the_Amundsen_Sea_Antarctica_over_the_period_of_1979-2014
___________________________
Sea ice algal biomass and physiology in the Amundsen Sea, Antarctica
July 15 2014
https://online.ucpress.edu/elementa/article/doi/10.12952/journal.elementa.000028/112943/Sea-ice-algal-biomass-and-physiology-in-the
___________________________
Modeling the Impact of Wind Intensification on Antarctic Sea Ice Volume
2013
http://psc.apl.washington.edu/zhang/Pubs/Zhang_Antarctic_2013.pdf
___________________________
Seabird hotspots on icebergs in the Amundsen Sea, Antarctica
06 July 2017
https://link.springer.com/article/10.1007/s00300-017-2174-4
___________________________
Video: Antarctic Ice Mass Loss 2002-2023
August 23, 2023
https://climate.nasa.gov/climate_resources/265/video-antarctic-ice-mass-loss-2002-2020/
___________________________
Pervasive Ice Retreat in West Antarctica
June 22, 2016
https://www.earthobservatory.nasa.gov/images/88241/pervasive-ice-retreat-in-west-antarctica
___________________________
The Characteristics of Surface Albedo Change Trends over the Antarctic Sea Ice Region during Recent Decades
5 April 2019
https://www.mdpi.com/2072-4292/11/7/821/htm
___________________________
Global Cooling During the Eocene-Oligocene Climate Transition
27 Feb 2009
https://www.science.org/doi/10.1126/science.1166368
___________________________
Antarctic sea ice reaches all-time low, according to new scientific report
April 19th 2022
https://en.mercopress.com/2022/04/19/antarctic-sea-ice-reaches-all-time-low-according-to-new-scientific-report
___________________________
Impact of global cooling on Early Cretaceous high pCO2 world during the Weissert Event
13 September 2021
https://www.nature.com/articles/s41467-021-25706-0
___________________________
Global cooling
https://en.wikipedia.org/wiki/Global_cooling
___________________________
The World Is Warming But the Antarctic Is Getting Colder
2016
https://www.bloomberg.com/news/articles/2016-07-20/antarctic-peninsula-cooled-in-past-two-decades-as-world-warmed#xj4y7vzkg
___________________________
Antarctica Is Gaining Ice, So Why Is the Earth Still Warming?
November 19, 2015

A view of glaciers and mountains covering West Antarctica, as captured from above on Oct. 29, 2014.
https://www.livescience.com/52831-antarctica-gains-ice-but-still-warming.html
___________________________
NASA satellites show Antarctica has gained ice despite rising global temperatures. How is that possible?

___________________________
NASA’s ICESat-2 Measures Arctic Ocean’s Sea Ice Thickness, Snow Cover
May 14, 2020
___________________________
Snow-ice contribution to the structure of sea ice in the Amundsen Sea, Antarctica
23 July 2020
https://www.cambridge.org/core/journals/annals-of-glaciology/article/snowice-contribution-to-the-structure-of-sea-ice-in-the-amundsen-sea-antarctica/DD59C59BE13F453C6309BEDFB4B57C43
___________________________
Characteristics of methanesulfonic acid, non-sea-salt sulfate and organic carbon aerosols over the Amundsen Sea, Antarctica
2020
https://acp.copernicus.org/articles/20/5405/2020/
___________________________
Morphology and sedimentary processes on the continental slope off Pine Island Bay, Amundsen Sea, West Antarctica
May 01, 2006
https://pubs.geoscienceworld.org/gsa/gsabulletin/article-abstract/118/5-6/606/125305/Morphology-and-sedimentary-processes-on-the
___________________________
Abbot Ice Shelf, structure of the Amundsen Sea continental margin and the southern boundary of the Bellingshausen Plate seaward of West Antarctica
2015
https://www.ncbi.nlm.nih.gov/pmc/articles/PMC4681458/
___________________________
Modelling Circumpolar Deep Water intrusions on the Amundsen Sea continental shelf, Antarctica
2008
https://nyuscholars.nyu.edu/en/publications/modelling-circumpolar-deep-water-intrusions-on-the-amundsen-sea-c
___________________________
Mass loss of the Amundsen Sea Embayment of West Antarctica from four independent techniques
2014
Abstract
We compare four independent estimates of the mass balance of the Amundsen Sea Embayment of West Antarctica, an area experiencing rapid retreat and mass loss to the sea. We use ICESat and Operation IceBridge laser altimetry, Envisat radar altimetry, GRACE time-variable gravity, RACMO2.3 surface mass balance, ice velocity from imaging radars, and ice thickness from radar sounders. The four methods agree in terms of mass loss and acceleration in loss at the regional scale. Over 1992-2013, the mass loss is 83 ± 5 Gt/yr with an acceleration of 6.1 ± 0.7 Gt/yr2. During the common period 2003-2009, the mass loss is 84 ± 10 Gt/yr with an acceleration of 16.3 ± 5.6 Gt/yr2, nearly 3 times the acceleration over 1992-2013. Over 2003-2011, the mass loss is 102 ± 10 Gt/yr with an acceleration of 15.7 ± 4.0 Gt/yr2. The results reconcile independent mass balance estimates in a setting dominated by change in ice dynamics with significant variability in surface mass balance.
https://escholarship.org/uc/item/4qz1s1mn
___________________________
Accelerated Sea-Level Rise from West Antarctica
Abstract
https://www.science.org/doi/10.1126/science.1099650
___________________________
Collection of large benthic invertebrates in sediment traps in the Amundsen Sea, Antarctica
2019
https://bg.copernicus.org/articles/16/2683/2019/
___________________________
Damage accelerates ice shelf instability and mass loss in Amundsen Sea Embayment
July 29, 2019
https://www.pnas.org/doi/10.1073/pnas.1912890117
___________________________
The Formation and Late Quaternary Palaeoenvironmental History of Sediment Mounds in the Amundsen Sea, West Antarctica
2018
This thesis presents the first high-resolution palaeoceanographic study of environmental changes in the Amundsen Sea sector of the West Antarctic continental margin during the Late Quaternary. This part of the West Antarctic Ice Sheet (WAIS) is currently experiencing rapid mass loss and longer-term records can provide important context for these changes.
Four piston cores, covering the last c. 375 kyrs, have
been studied from two of the five large sediment mounds which stand on
the continental rise of the eastern Amundsen Sea. Four of the mounds
have been previously been identified in the literature as sediment
drifts. The cores were analysed for sedimentology (grain size, physical
properties, spectrophotometry), mineralogy (clay minerals, sand fraction
composition) and geochemistry (XRF, biogenic silica content, TOC,
CaCO3). These data were used to infer the supply of terrigenous material
from the West Antarctic Ice Sheet, the amount of biological
productivity and the nature of the bottom current. Age constraints for
the ≤375 kyr records are derived from relative palaeomagnetic intensity,
diatom biostratigraphy, AMS 14C dates, tephrochronology and
lithostratigraphy.
Analysis of the sediments together with new
geophysical and bathymetric data suggests the mounds are mixed
contourite-turbidite drifts. Turbidity currents were initiated at the
margins of, and between, the mouths of Pine Island Trough East and West
and Abbot Trough. The turbidity currents eroded channels in the slope,
some of which connect to the deeply incised, maximum 20 km wide and 400
km long channels separating the drifts. The fine-grained fraction of the
turbidity currents was pirated and deposited on the drift crests by the
weak, eastwards-flowing bottom current, which may be Antarctic Bottom
Water or Lower Circumpolar Deep Water. The coarse-grained component of
the turbidity currents was largely constrained to the channels, with
occasional spill-over depositing sand and sandy muds on the drift
flanks. The drifts are long (250-433 km), narrow (38-130 km), stand up
to 900 m above the sea floor and are asymmetric, with a gently-sloping
western flank and steeper eastern flank resulting from sediment
interaction with the bottom current.
The sediments exhibit strong
cyclicity corresponding to glacial-interglacial cycles. During glacial
periods, deposition was mostly of grey, terrigenous, typically laminated
contourites with dispersed ice rafted debris and locally-sourced
kaolinite and illite. Sedimentation rates ranging from 0.1 to 17.2
cm/kyr reflect WAIS advance and retreat across the shelf. Bottom
currents captured the fine grained fraction of turbidity currents and
deposited laminated sediments, similar to those reported in the drifts
west of the Antarctic Peninsula, attributed to a steady bottom current
and the absence of bioturbation under perennial sea-ice. Manganese
contents suggest suboxic conditions during glacial periods. A laminated
sand and sandy mud turbidite deposit is present in a drift flank core.
Olive-brown,
bioturbated, diatom-bearing and often calcareous-foraminifera-bearing,
mixed contourite and hemi-pelagic muds were deposited in interglacial
periods. Sedimentation rates range from 0.2 to ≥3.7 cm/kyr reflecting
changes in productivity that were mostly controlled by sea-ice coverage.
The smectite content of surface samples from the drifts are larger than
any other known sample from the Amundsen Sea shelf or rise and suggest
that the bottom current also deposits far-travelled clay.
There
are no major depositional anomalies or thick IRD layers in the drift
cores that might indicate collapse of the WAIS. However,
millennial-scale cyclical variations in the provenance of terrigenous
material in PS58/255-2 during mid-late MIS 6 may reflect changes in ice
dynamics.
http://etheses.dur.ac.uk/12659/
___________________________
Geophysical survey reveals tectonic structures in the Amundsen Sea embayment, West Antarctica
2007
Abstract
The Amundsen Sea embayment of West Antarctica is in a prominent
location for a series of tectonic and magmatic events from Paleozoic to
Cenozoic times. Seismic, magnetic and gravity data from the embayment
and Pine Island Bay (PIB) reveal the crustal thickness and some tectonic
features. The Moho is 24-22 km deep on the shelf. NE-SW trending
magnetic and gravity anomalies and the thin crust indicate a former rift
zone that was active during or in the run-up to breakup between Chatham
Rise and West Antarctica before or at 90 Ma. NW-SE trending gravity and
magnetic anomalies, following a prolongation of Peacock Sound, indicate
the extensional southern boundary to the
Bellingshausen Plate which was active between 79 and 61 Ma.
https://pubs.usgs.gov/of/2007/1047/srp/srp047/of2007-1047srp047.pdf
___________________________
Shear-wave velocity and attenuation structure beneath Antarctica determined from surface waves
1994
https://www.academia.edu/es/76678869/Shear_wave_velocity_and_attenuation_structure_beneath_Antarctica_determined_from_surface_waves
___________________________
Guest post: Deciphering the rise and fall of Antarctic sea ice extent
29 June 2021
https://www.carbonbrief.org/guest-post-deciphering-the-rise-and-fall-of-antarctic-sea-ice-extent/
___________________________
Subglacial bedforms reveal complex basal regime in a zone of paleo–ice stream convergence, Amundsen Sea embayment, West Antarctica
___________________________
Modelling the freshwater balance and influence of icebergs in the Amundsen Sea, Antarctica
2021
https://eprints.soton.ac.uk/447348/
___________________________
The macro- and megabenthic fauna on the continental shelf of the eastern Amundsen Sea, Antarctica.
2013
https://hal.archives-ouvertes.fr/hal-00867552
___________________________
Photographic survey of benthos provides insights into the Antarctic fish fauna from the Marguerite Bay slope and the Amundsen Sea
2013
https://eprints.soton.ac.uk/341126/
___________________________
New Links Between Greenhouse Gases and Sea Level Rise Found in the Amundsen Sea, West Antarctica
Apr 07 2022
https://www.natureworldnews.com/articles/50297/20220407/new-links-between-greenhouse-gases-sea-level-rise-found-amundsen.htm
___________________________
Antarctic sea ice experiences record low extent for the second time in 5 years
April 19, 2022
https://phys.org/news/2022-04-antarctic-sea-ice-extent-years.html
___________________________
The Role of Large-Scale Drivers in the Amundsen Sea Low Variability and Associated Changes in Water Isotopes From the Roosevelt Island Ice Core, Antarctica
2022
https://www.researchsquare.com/article/rs-1215704/v1
___________________________
Amundsen Sea

Large B-22 iceberg breaking off from Thwaites Glacier and remnants of the B-21 iceberg from Pine Island Glacier in Pine Island Bay to the right of the image

A proposed "underwater sill" blocking 50% of warm water flows heading
for the glacier could have the potential to delay its collapse and the
resultant sea level rise by many centuries.
https://en.wikipedia.org/wiki/Amundsen_Sea
___________________________
Partial Mitigation of global warming through Antarctic Meltwater Anomalies
2020
http://oceans.mit.edu/JohnMarshall/wp-content/uploads/2020/11/MeltPaper210.29.2020.pdf
___________________________
Ocean heat flux under Antarctic sea ice in the Bellingshausen and Amundsen Seas: two case studies
26 July 2017
https://www.cambridge.org/core/journals/annals-of-glaciology/article/ocean-heat-flux-under-antarctic-sea-ice-in-the-bellingshausen-and-amundsen-seas-two-case-studies/BB2AA43A0C1E994C2F832CE71144A79E
___________________________
Ice and ocean processes in the Bellingshausen Sea, Antarctica
21 May 2010
https://agupubs.onlinelibrary.wiley.com/doi/full/10.1029/2008JC005219
___________________________
Sources, variability and fate of freshwater in the Bellingshausen Sea, Antarctica
2018
https://www.sciencedirect.com/science/article/pii/S0967063717300420
___________________________
An improved bathymetry compilation for the Bellingshausen Sea, Antarctica, to inform ice-sheet and ocean models
2011
https://tc.copernicus.org/articles/5/95/2011/tc-5-95-2011.pdf
___________________________
Quaternary Tephrochronology of the Scotia Sea and Bellingshausen Sea, Antarctica
1999
https://eprints.glos.ac.uk/4865/
___________________________
An improved bathymetry compilation for the Bellingshausen Sea, Antarctica, to inform ice-sheet and ocean models
October 2010
https://www.researchgate.net/publication/49608882_An_improved_bathymetry_compilation_for_the_Bellingshausen_Sea_Antarctica_to_inform_ice-sheet_and_ocean_models
___________________________
The terrestrial biota of Charcot Island, eastern Bellingshausen Sea, Antarctica: an example of extreme isolation
06 May 2004
https://www.cambridge.org/core/journals/antarctic-science/article/abs/terrestrial-biota-of-charcot-island-eastern-bellingshausen-sea-antarctica-an-example-of-extreme-isolation/9963099BA5191B65EBFBB3041B546B96
___________________________
Sphaerodoridae (Annelida: Polychaeta) from the Bellingshausen Sea (Antarctica) with the description of two new species
https://link.springer.com/article/10.1007/s00300-010-0869-x
___________________________
The Shelf Circulation of the Bellingshausen Sea
May 2021
https://www.researchgate.net/publication/351212544_The_Shelf_Circulation_of_the_Bellingshausen_Sea
___________________________
Hydroid assemblages from the Bellingshausen Sea (Antarctica): environmental factors behind their spatial distribution
___________________________
Antarctic Peaks Reveal Sea Rise Threat
2016
https://floodlist.com/protection/antarctic-peaks-reveal-sea-rise-threat
___________________________
High geothermal heat beneath West Antarctica glacier responsible for its melting
Aug 21, 2021
https://strangesounds.org/2021/08/high-geothermal-heat-beneath-antarctica-ice-melting.html
___________________________
Antarctic Tunnels: 820-foot-high Mystery Channels Discovered Under Antarctica Ice Cap
Aug 22, 2014
https://strangesounds.org/2014/08/antarctic-tunnels-820-foot-high-mystery-channels-discovered-antarctica-ice-cap.html
___________________________
Evidence of Recent Volcanic Eruptions Under the Western Antarctic Ice Sheet
2017
https://wattsupwiththat.com/2017/09/14/evidence-of-recent-volcanic-eruptions-under-the-western-antarctic-ice-sheet/
___________________________
Volcano discovered smoldering under a kilometer of ice in West Antarctica
2013
https://wattsupwiththat.com/2013/11/17/volcano-discovered-smoldering-under-a-kilometer-of-ice-in-west-antarctica/
___________________________
Underwater volcano in Antarctica triggers 85,000 earthquakes
April 27, 2022
The swarm of 85,000 earthquakes was the strongest seismic outburst ever recorded in Antarctica.
A long-dormant underwater volcano near Antarctica has woken up, triggering a swarm of 85,000 earthquakes.
The swarm, which began in August 2020 and subsided by November of that year, is the strongest earthquake activity ever recorded in the region. And the quakes were likely caused by a "finger" of hot magma poking into the crust, new research finds.
"There have been similar intrusions in other places on Earth, but this is the first time we have observed it there," study co-author Simone Cesca, a seismologist at the GFZ German Research Centre for Geosciences in Potsdam, told Live Science. "Normally, these processes occur over geologic time scales," as opposed to over the course of a human life span, Cesca said. "So in a way, we are lucky to see this."
https://www.livescience.com/earthquake-swarm-antarctica-underwater-volcano
___________________________
Giant volcanoes lurk beneath Antarctic ice
January 5, 2018
The expanse of buried volcanoes raises questions about the future of the ice sheet

Mount Erebus, the world’s southernmost active volcano, rises 3,794 meters (12,477 feet) above the ice in Antarctica. It’s in the same region as the newly discovered buried volcanoes.
https://www.sciencenewsforstudents.org/article/giant-volcanoes-lurk-beneath-antarctic-ice
___________________________
91 volcanoes discovered under Antarctic ice sheet
September 26, 2017
https://www.foxnews.com/science/91-volcanoes-discovered-under-antarctic-ice-sheet
___________________________
Hidden Volcanoes Melt Antarctic Glaciers from Below
June 09, 2014

The edge of the Thwaites glacier, shown here
in an image taken during Operation Icebridge, a NASA-led study of
Antarctic and Greenland glaciers. The blue along the glacier front is
dense, compressed ice.
https://www.livescience.com/46194-volcanoes-melt-antarctic-glaciers.html
___________________________
A 40-y record reveals gradual Antarctic sea ice increases followed by decreases at rates far exceeding the rates seen in the Arctic
July 1, 2019
https://www.pnas.org/doi/10.1073/pnas.1906556116
___________________________
New paper finds West Antarctic glacier likely melting from geothermal heat below
2014
https://wattsupwiththat.com/2014/10/12/new-paper-finds-west-antarctic-glacier-likely-melting-from-geothermal-heat-below/
___________________________
Ice core tells 11,000-year history of explosive volcanic eruptions
June 30, 2021
First-of-its-kind record sheds light on ancient eruptions and climate conditions
An
ice core from West Antarctica is giving scientists insight into some
intriguing climate anomalies of ages past and deepening the mystery of a
volcanic eruption that destroyed a Greek island some 3,600 years ago.
Scientists
studying an ice core drilled at the West Antarctic Ice Sheet Divide, or
WAIS Divide, are using volcanic ash deposits embedded within the layers
of ice to tally the number of explosive volcanic eruptions that
occurred over the past 11,000 years and to pin down exactly when those
eruptions happened.
The researchers counted deposits from 426
large eruptions during the 11,000-year period that occurred in the
Southern Hemisphere and in the Northern Hemisphere near the equator.
Analyzing the deposits will shed light on how clouds of ash and gas from
volcanic eruptions travel through the atmosphere and affect Earth’s
climate. Explosive eruptions, like the one at Mount Saint Helens in
1980, spew hot ash and gas into the atmosphere that block or reflect
sunlight, typically causing temperatures to drop.
Studying the
deposits from these eruptions will help researchers better understand
how Earth’s climate has varied throughout the Holocene, the modern
period since the most recent ice age ended roughly 11,000 years ago.
“Ice
cores happen to be one of the best ways we can get a very good handle
on both the records of past eruptions and how the climate interacts with
that or responds to that,” said Jihong Cole-Dai, an atmospheric chemist
at South Dakota State University and lead author of a new study
detailing the findings. “That was one of the goals of the WAIS Divide
project...”
https://antarcticsun.usap.gov/science/4453/
___________________________
Bransfield Strait
https://en.wikipedia.org/wiki/Bransfield_Strait
___________________________
Bransfield Basin
Glacial processes
Glacial processes have deposited a subglacial deformation till. The sediment that makes up this unit is derived from pressure melting of the glacier and from the substrate the glacier passed over. The subglacial deformation till unit is composed of a matrix-supported diamicton.[10]
Glacial marine processes
Glacial marine processes have deposited two different units within the region. One of the units comprises proglacial debris flows have deposited a matrix-supported diamicton with interbeds of laminated mud on the lower portion of the continental slope. The other depositional process is a mixture of rain out from the ice from either melting or instantaneous dumping from the surface of an overturned portion of ice, and from marine rain out. The terrigenous and biogenic material compounds together to form sandy muds with sparse clasts.[10]
Open marine processes
Open marine processes have deposited three units within the region. One of the units is a fining-upwards turbidity current deposit can be observed within the lower slope of the basin. Layers of volcanic ash around 1 to 4 centimetres (1⁄3 to 1+2⁄3 inches) thick are within the deposit. Another unit is a contorted/disturbed mud that makes up a slide unit. This unit is distinct because its angular contacts and disturbed structures that form from sediment reworking and plastic deformation from sliding. The third unit is a stratified mud with clast layers at the lower slope's foot. This unit is deposited from contour currents, and differences in clast size is attributed to shifting current conditions.[10]
Magmatism
The subduction event between the Phoenix plate and the Antarctic plate have built a volcanic arc consisting of low potassium to medium potassium content along the Antarctic Peninsula and South Shetland Islands. Volcanism occurred in multiple events during 130–110, 90–70, 60–40, and 30–20 million years ago. The paucity can be interpreted as subducting younger crust or subsidence the post 20 million years arc after the basin formed.[8] Volcanism is widespread within the Quaternary which created a series of submarine volcanoes. The submarine volcanoes produce glassy lavas ranging in compositions similar to what would be expected in arcs higher in large-ion lithophile elements to enriched mid-ocean ridge basalts.[8]
The Bransfield Basin is abnormal when it comes to the style of volcanism that can be observed within the basin. Undersea volcanoes experience what is called bimodal volcanism.[11] Igneous rocks within the basin are andesite and basalt. The closer to the center of the undersea volcanoes the composition of the rocks shifts towards more felsic rock types such as rhyolite, rhyodacite, and dacite.[11] The source of this phenomenon is interpreted as a result from indicate formation from partial melting or fractional crystallization. This type of volcanism is commonly observed in Phanerozoic volcanic massive sulfide systems, and is not commonly observed in modern back-arc basins. Examples of where bimodal volcanism can be observed are the Okinawa Trough and the Sumizu Rift.[11]
The occurrence of incipient seafloor spreading in the basin is under controversy. Some researchers suggest that it does not occur within the basin because of the crustal thickness, magnetic anomaly patterns, and intracrustal diapirism.[2] Other geoscientists suggest that it is occurring and is related to seamount volcanism and normal faulting within the basin.[1][2]
Seismic swarm of 2020-2021
https://en.wikipedia.org/wiki/Bransfield_Basin
___________________________
New data on underwater volcanoes in Bransfield Strait, Antarctica
May 16, 2019
https://phys.org/news/2019-05-underwater-volcanoes-bransfield-strait-antarctica.html
___________________________
Tectonomagmatic activity and ice dynamics in the Bransfield Strait back-arc basin, Antarctica
22 January 2010
Abstract
[1] An array of moored hydrophones was used to monitor the spatiotemporal distribution of small- to moderate-sized earthquakes and ice-generated sounds within the Bransfield Strait, Antarctica. During a 2 year period, a total of 3900 earthquakes, 5925 icequakes and numerous ice tremor events were located throughout the region. The seismic activity included eight space-time earthquake clusters, positioned along the central neovolcanic rift zone of the young Bransfield back-arc basin. These sequences of small magnitude earthquakes, or swarms, suggest ongoing magmatic activity that becomes localized along isolated volcanic features and fissure-like ridges in the southwest portion of the basin. A total of 122 earthquakes were located along the South Shetland trench, indicating continued deformation and possibly ongoing subduction along this margin. The large number of icequakes observed show a temporal pattern related to seasonal freeze-thaw cycles and a spatial distribution consistent with channeling of sea ice along submarine canyons from glacier fronts. Several harmonic tremor episodes were sourced from a large (∼30 km2) iceberg that entered northeast portion of the basin. The spectral character of these signals suggests they were produced by either resonance of a small chamber of fluid within the iceberg, or more likely, due to periodicity of discrete stick-slip events caused by contact of the moving iceberg with the seafloor. These pressure waves appear to have been excited by abrasion of the iceberg along the seafloor as it passed Clarence and Elephant Islands.
https://agupubs.onlinelibrary.wiley.com/doi/full/10.1029/2009JB006295
___________________________
Massive earthquake swarm driven by magmatic intrusion at the Bransfield Strait, Antarctica
11 April 2022
Abstract
An earthquake swarm affected the Bransfield Strait, Antarctica, a unique rift basin in transition from intra-arc rifting to ocean spreading. The swarm, counting ~85,000 volcano-tectonic earthquakes since August 2020, is located close to the Orca submarine volcano, previously considered inactive. Simultaneously, geodetic data reported up to ~11 cm northwestward displacement over King George Island. We use a broad variety of geophysical data and methods to reveal the complex migration of seismicity, accompanying the intrusion of 0.26–0.56 km3 of magma. Strike-slip earthquakes mark the intrusion at depth, while shallower normal faulting the ~20 km long lateral growth of a dike. Seismicity abruptly decreased after a Mw 6.0 earthquake, suggesting the magmatic dike lost pressure with the slipping of a large fault. A seafloor eruption is likely, but not confirmed by sea surface temperature anomalies. The unrest documents episodic magmatic intrusion in the Bransfield Strait, providing unique insights into active continental rifting.
https://www.nature.com/articles/s43247-022-00418-5
___________________________
Mid-Late Holocene climate variabilities in the Bransfield Strait, Antarctic Peninsula driven by insolation and ENSO activities
2022
https://www.sciencedirect.com/science/article/abs/pii/S0031018222003108
___________________________
Crustal model of the Bransfield Rift, West Antarctica, from detailed OBS refraction experiments
01 August 1997
https://academic.oup.com/gji/article/130/2/506/760647?login=false
___________________________
Geotectonic evolution of the Bransfield Basin, Antarctic Peninsula: Insights from analogue models
April 2008
https://www.researchgate.net/publication/231825207_Geotectonic_evolution_of_the_Bransfield_Basin_Antarctic_Peninsula_Insights_from_analogue_models
___________________________
BRAVOSEIS: Geophysical investigation of rifting and volcanism in the Bransfield strait, Antarctica
2020
https://www.sciencedirect.com/science/article/abs/pii/S0895981120303771
___________________________
Astrolabe Island and Iceberg A57a, Bransfield Strait, Antarctica, 2/21/2019, National Geographic Orion
21 Feb 2019
https://www.expeditions.com/expedition-stories/daily-expedition-reports/astrolabe-island-and-iceberg-a57a-bransfield-strait-antarctica/
___________________________
Lithospheric
structure of an incipient rift basin: Results from receiver function
analysis of Bransfield Strait, NW Antarctic Peninsula
2018
https://cdr.lib.unc.edu/downloads/vt150t70z?locale=en
___________________________
Crustal diapirism in Bransfield Strait, West Antarctica: Evidence for distributed extension in marginal-basin formation
July 1994
https://pubs.geoscienceworld.org/gsa/geology/article-abstract/22/7/657/206150/Crustal-diapirism-in-Bransfield-Strait-West
___________________________
Invertebrates from the ANTARXXVII Leg1 expedition to the Bransfield Strait, Antarctica - data
July 1, 2021
https://www.gbif.org/dataset/25bf34e6-48ef-41aa-9b62-876ca0c66a2a
___________________________
Surface currents in the Bransfield and Gerlache Straits, Antarctica
February 2002
https://www.researchgate.net/publication/222694220_Surface_currents_in_the_Bransfield_and_Gerlache_Straits_Antarctica
___________________________
Deep structure and new experimental data of the Bransfield Strait volcanoes (West Antarctica)
2021
http://uaj.uac.gov.ua/index.php/uaj/article/download/661/576/
___________________________
Upper crustal structure of Deception Island area (Bransfield Strait, Antarctica) from gravity and magnetic modelling
06 June 2005
Abstract
Deception Island is a young, active volcano located in the south-western part of Bransfield Strait, between the Antarctic Peninsula and the South Shetland archipelago. New gravity and magnetic data, from a marine geophysical cruise (DECVOL-99), were analysed. Forty-eight survey lines were processed and mapped around Deception Island to obtain Bouguer and magnetic anomaly maps. These maps show well- defined groups of gravity and magnetic anomalies, as well as their gradients. To constrain the upper crustal structure, we have performed 2+1/2D forward modelling on three profiles perpendicular to the main anomalies of the area, and taking into account previously published seismic information. From the gravity and magnetic models, two types of crust were identified. These were interpreted as continental crust (located north of Deception Island) and more basic crust (south of Deception Island). The transition between these crustal types is evident in the Bouguer anomaly map as a high gradient area trending NE–SW. Both magnetic and gravity data show a wide minimum at the eastern part of Deception Island, which suggests a very low bulk susceptibility and low density intrusive body. With historical recorded eruptions and thermal and fumarolic fields, we interpret this anomaly as a partially melted intrusive body. Its top has been estimated to be at 1.7 km depth using Euler deconvolution techniques.
https://www.cambridge.org/core/journals/antarctic-science/article/abs/upper-crustal-structure-of-deception-island-area-bransfield-strait-antarctica-from-gravity-and-magnetic-modelling/5451EA064985C6BCDE8B531B4E5D7BE9
___________________________
Electron microprobe characterization of ash layers in sediments from the central Bransfield basin (Antarctic Peninsula): evidence for at least two volcanic sources
28 January 2003
___________________________
Seismic crustal structure of the Bransfield Strait, West Antarctica
1997
https://journals.pan.pl/Content/110908/PDF/1997-3-4_171-225.pdf?handler=pdf
___________________________
Highly branched isoprenoids for Southern Ocean sea ice reconstructions: a pilot study from the Western Antarctic Peninsula
2019
https://bg.copernicus.org/articles/16/2961/2019/
___________________________
Recent Seismic Activity at Bransfield Strait, Antarctica
2021
http://ijeska.com/index.php/ijeska/article/view/91
___________________________
Benthic carbon fixation and cycling in diffuse hydrothermal and background sediments in the Bransfield Strait, Antarctica
2020
Sedimented hydrothermal vents are likely to be widespread compared to hard substrate hot vents. They host chemosynthetic microbial communities which fix inorganic carbon (C) at the seafloor, as well as a wide range of macroinfauna, including vent-obligate and background non-vent taxa. There are no previous direct observations of carbon cycling at a sedimented hydrothermal vent. We conducted 13C isotope tracing experiments at three sedimented sites in the Bransfield Strait, Antarctica, which showed different degrees of hydrothermalism. Two experimental treatments were applied, with 13C added as either algal detritus (photosynthetic C), or as bicarbonate (substrate for benthic C fixation). Algal 13C was taken up by both bacteria and metazoan macrofaunal, but its dominant fate was respiration, as observed at deeper and more food-limited sites elsewhere. Rates of 13C uptake and respiration suggested that the diffuse hydrothermal site was not the hot spot of benthic C cycling that we hypothesised it would be. Fixation of inorganic C into bacterial biomass was observed at all sites, and was measurable at two out of three sites. At all sites, newly fixed C was transferred to metazoan macrofauna. Fixation rates were relatively low compared with similar experiments elsewhere; thus, C fixed at the seafloor was a minor C source for the benthic ecosystem. However, as the greatest amount of benthic C fixation occurred at the “Off Vent” (non-hydrothermal) site (0.077±0.034 mg C m−2 fixed during 60 h), we suggest that benthic fixation of inorganic C is more widespread than previously thought, and warrants further study.
https://bg.copernicus.org/articles/17/1/2020/
___________________________
Preliminary Results from a Marine Geophysics Survey of Orca Volcano in the Bransfield Strait, Antarctica
Dec 2019
https://ui.adsabs.harvard.edu/abs/2019AGUFM.T33F0422S/abstract
___________________________
What's Under Antarctica? Quake Waves Give First Look
April 6, 2012

Mount Sidley, the highest volcano in Antarctica, may have a lot of company lurking out of sight. Scientists are using seismographs to hunt for hidden volcanoes in Antarctica.
https://www.livescience.com/19546-antarctica-seismic-image-geology.html
___________________________
Huge Earthquake Swarm Detected in Antarctica as Inactive Volcano Awakens
Apr 29, 2022
While it may seem like Antarctica is totally devoid of volcanic activity, there is substantial evidence of volcanoes below the Antarctic Ice Sheet, according to NASA's Climate Change and Global Warming website. Some of these are currently active or have been in the recent geologic past.
The exact number of volcanoes in Antarctica remains a mystery but one recent study identified 138 of them in West Antarctica alone. Despite this, it appears from the available evidence that there have been no dramatic volcanic eruptions in the region in the recent geologic past.
It is important to note, however, there is a lack of data regarding volcanism in many parts of Antarctica because the continent is covered in ice and the remoteness of many of the volcanoes makes studying them a challenge.
The international team of researchers taking part in the study come from the GFZ German Research Centre for Geosciences Potsdam in Germany, the Italian National Institute of Oceanography and Applied Geophysics, the Polish Academy of Sciences' Institute of Geophysics, the Missouri University of Science and Technology, and the German Aerospace Center.
___________________________
Volcanic pipe
Volcanic pipes or volcanic conduits are subterranean geological structures formed by the violent, supersonic eruption of deep-origin volcanoes. They are considered to be a type of diatreme. Volcanic pipes are composed of a deep, narrow cone of solidified magma (described as "carrot-shaped"), and are usually largely composed of one of two characteristic rock types — kimberlite or lamproite. These rocks reflect the composition of the volcanoes' deep magma sources, where the Earth is rich in magnesium. They are well known as the primary source of diamonds, and are mined for this purpose. Volcanic pipes are relatively rare by this definition based on minerals and depth of the magma source, but on the other hand volcanic diatremes are common, indeed the second commonest form of volcanic extrusion (that is magma that reaches the surface).
Formation
Volcanic pipes form as the result of violent eruptions of deep-origin volcanoes.[1] These volcanoes originate at least three times as deep as most other volcanoes, and the resulting magma that is pushed toward the surface is high in magnesium and volatile compounds such as water and carbon dioxide. As the body of magma rises toward the surface, the volatile compounds transform to gaseous phase as pressure is reduced with decreasing depth. This sudden expansion propels the magma upward at rapid speeds, resulting in a supersonic Plinian eruption.
Kimberlite pipes
In kimberlite pipes, the eruption ejects a column of overlying material directly over the magma column, and does not form a large above-ground elevation as typical volcanoes do; instead, a low ring of ejecta known as a tuff ring forms around a bowl-shaped depression over the subterranean column of magma. Over time, the tuff ring may erode back into the bowl, leveling out the depression by filling it with washed-back ejecta. Kimberlite pipes are the source of most of the world's commercial diamond production, and also contain other precious gemstones and semi-precious stones, such as garnets, spinels, and peridot.
Lamproite pipes
Lamproite pipes operate similarly to kimberlite pipes, except that the boiling water and volatile compounds contained in the magma act corrosively on the overlying rock, resulting in a broader cone of eviscerated rock (the ejection of this rock also forms a tuff ring, like kimberlite eruptions). This broad cone is then filled with volcanic ash and materials. Finally, the degassed magma is pushed upward, filling the cone. The result is a funnel shaped deposit of volcanic material (both solidified magma, and ejecta) which appears mostly flat from the surface.

Volcanic Pipe
https://en.wikipedia.org/wiki/Volcanic_pipe
___________________________
Volcanic and igneous plumbing systems
Volcanic and igneous plumbing systems (VIPS) consist of interconnected magma channels and chambers through which magma flows and is stored within Earth's crust.[1] Volcanic plumbing systems can be found in all active tectonic settings, such as mid-oceanic ridges, subduction zones, and mantle plumes, when magmas generated in continental lithosphere, oceanic lithosphere, and in the sub-lithospheric mantle are transported. Magma is first generated by partial melting, followed by segregation and extraction from the source rock to separate the melt from the solid.[1] As magma propagates upwards, a self-organised network of magma channels develops, transporting the melt from lower crust to upper regions.[1] Channelled ascent mechanisms include the formation of dykes[3] and ductile fractures that transport the melt in conduits.[4] For bulk transportation, diapirs carry a large volume of melt and ascent through the crust.[5] When magma stops ascending, or when magma supply stops, magma emplacement occurs.[2] Different mechanisms of emplacement result in different structures, including plutons, sills, laccoliths and lopoliths.

Schematic sketch of the volcanic and igneous plumbing systems (after Burchardt, 2018).
https://en.wikipedia.org/wiki/Volcanic_and_igneous_plumbing_systems
___________________________
Ice cores reveal multiple major volcanic eruptions in the 13th century
February 25, 2025
https://phys.org/news/2025-02-ice-cores-reveal-multiple-major.html
___________________________
A series of fortunate events—Antarctic zircons tell story of early volcanism
November 27, 2017
https://phys.org/news/2017-11-series-fortunate-eventsantarctic-zircons-story.html
___________________________
Heat-loving bacteria from an Antarctic volcano could help tackle oil contamination
October 3, 2022
https://phys.org/news/2022-10-heat-loving-bacteria-antarctic-volcano-tackle.html
___________________________
Scientists investigate how oil affects smallest organisms in Antarctic waters
September 21, 2017
https://phys.org/news/2017-09-scientists-oil-affects-smallest-antarctic.html
___________________________
Antarctic ice melt may fuel eruptions of hidden volcanoes
January 6, 2025

New research finds that ice melt in Antarctica could lead to more subglacial eruptions, affecting volcanoes such as Mount Erebus, seen here.
The movement of molten metals in Earth's outer core generates a vast
magnetic field that protects the planet from potentially harmful space
weather. Throughout Earth's history, the structure of the magnetic field
has fluctuated. However, data suggest that averaged over sufficient
time, the field may be accurately approximated by a geocentric axial
dipole (GAD) field—the magnetic field that would result from a bar
magnet centered within Earth and aligned along its axis of rotation...
https://phys.org/news/2025-01-antarctic-ice-fuel-eruptions-hidden.html
___________________________
Volcanic eruptions trigger ice formation in clouds
May 21, 2025

Schematic illustrating how volcanic ash particles affect cirrus clouds.
When a volcano erupts, it can spew ash high into the atmosphere—inserting aerosols right where clouds typically form. How exactly these aerosols impact cloud formation has long been a mystery to atmospheric scientists.
In a study published in Science Advances, researchers from Lawrence Livermore National Laboratory (LLNL) analyzed 10 years of satellite data to determine that volcanic ash particles can trigger cloud formation by providing a surface for ice to coalesce.
"Our research helps close a significant knowledge gap about whether and how volcanic eruptions influence cloud formation," said LLNL scientist and author Lin Lin. "We show that volcanic ash particles can trigger ice cloud formation by acting as sites for ice nucleation."
Clouds reflect sunlight and trap heat, and because they cover about 70% of Earth's surface at any given time, they play a critical role in the planet's energy balance. For accurate atmospheric models, researchers must understand clouds and the aerosols that affect them. Volcanic eruptions offer a unique, real-world opportunity to observe how particles influence cloud properties.
The scientists examined radar and lidar data from two NASA missions, CloudSat and CALIPSO. By drawing from multiple datasets and instruments, they were able to piece together a coherent picture.
After ash-rich volcanic eruptions, the team saw clear and consistent changes in the satellite data. Clouds hosted fewer but larger ice crystals, and cirrus clouds—high, wispy clouds made mostly of ice—were more frequent. The same was not the case for ash-poor eruptions...
https://phys.org/news/2025-05-volcanic-eruptions-trigger-ice-formation.html
___________________________
Antarctic lava yields clues to Earth's past magnetic field
February 4, 2021

Rock samples collected near the Antarctic volcano Mount Erebus, seen here in the distance, harbor fingerprints of Earth’s ancient magnetic field. A new analysis delves into discrepancies between these fingerprints and predictions from a long-standing approximation of the field.
https://phys.org/news/2021-02-antarctic-lava-yields-clues-earth.html
___________________________
Coseismic piezoelectric effects due to a dislocation: 1. An analytic far and early-time field solution in a homogeneous whole space
2000
https://www.sciencedirect.com/science/article/abs/pii/S0031920100001771
___________________________
Drilling Mechanisms Using Piezoelectric Actuators Developed at Jet Propulsion Laboratory
___________________________

Earthquake lights resembling bluish flames or lightning apparently originate from charges in stressed rocks
Spooky lights heralding the onset of earthquakes have been tied to divine portents or UFO sightings in the past. But the true culprit may be certain rocks that release electric charges when stressed by the Earth's seismic shifts, researchers say.
https://spectrum.ieee.org/mystery-of-earthquake-lights-traced-to-electrical-charges-in-rocks
___________________________
Gold nugget formation from earthquake-induced piezoelectricity in quartz
02 September 2024
https://www.nature.com/articles/s41561-024-01514-1
___________________________
Earthquakes can trigger quartz into forming giant gold nuggets, study finds
September 2, 2024

Gold nuggets form inside quartz veins, which are cracks in the rock infilled with mineral-rich hydrothermal fluids.

In quartz veins, gold preferentially solidifies onto existing gold deposits, forming large clusters of nuggets.
___________________________
Gold Dust Spews Out Of The World's Most Southern Active Volcano In Antarctica
April 25, 2025

Mount Erebus on Antarctica’s Ross Island looking majestic and mysterious.

A satellite image of Mount Erebus breaking through the clouds of Antarctica on November 25, 2023.
If you look closely at satellite images of this geological giant, you'll notice slight hints of red in its summit crater. Remarkably, this is a searingly hot lava lake that's been bubbling since at least 1972. The volcano regularly pumps out plumes of gas and steam. In past bouts of volcanic activity, it has been known to eject boulders of partially molten rock known as “volcanic bombs”.
Strangest of all, scientists have found that its gusts of gas are loaded with tiny crystals of metallic gold, no larger than 20 micrometers. Over the course of a single day, it's estimated that the volcano spews out around 80 grams of gold – that's worth around $6000.
The gold dust travels far and wide. Antarctic researchers have detected traces of the gold in ambient air up to 1,000 kilometers (621 miles) from the volcano.
The volcano is perhaps most notorious, however, for the Mount Erebus disaster. On November 28, 1979, Air New Zealand Flight 901 flew head-on into the side of the volcano, killing all 257 people onboard.
___________________________
The Seasonal Variation of the Direct Current Global Electric Circuit: 1. A New Analysis Based on Long-Term Measurements in Antarctica
11 March 2025
Abstract
It has long been noted that the seasonal behavior of the global electric circuit (GEC) is difficult to reliably determine from measurements of atmospheric electrical parameters, largely owing to prominent annual cycles of aerosols affecting the conductivity in most continental locations. Here we discuss earlier studies in this direction and present further analysis of this problem using the results of potential gradient (PG) measurements at the Vostok station in Antarctica during 2006–2020. Collected at the high and remote Antarctic Plateau, Vostok PG values form a unique continuous data set indicating the variation of atmospheric electricity on different timescales; on the annual timescale the uniformity and consistency of the data turn out to be especially important (in particular, seasonal behavior of GEC parameters at specific UTC hours may be substantially different from the respective diurnal mean variation). PG measurements at Vostok indicate the highest and lowest values of the diurnal mean GEC intensity during the Northern Hemisphere summer and winter, respectively; this variation generally agrees with the available results of air—Earth current measurements. The seasonal variation of the GEC has been previously linked to the annual cycle of insolation; our findings further support this relationship, as it can provide a physical explanation not only for the summer PG maximum observed at Vostok but also for a small local minimum inside this maximum. The dominance of the Northern Hemisphere in the resulting variation is apparently related to the latitudinally asymmetrical distribution of land over the Earth's surface.
https://agupubs.onlinelibrary.wiley.com/doi/10.1029/2024JD042633
___________________________
Stratospheric electric fields and currents measured at Syowa Station, Antarctica—1. The vertical component
1977
https://www.sciencedirect.com/science/article/abs/pii/0021916977901611
___________________________
Atmospheric Global Circuit Variations from Vostok and Concordia Electric Field Measurements
01 Mar 2017
https://journals.ametsoc.org/view/journals/atsc/74/3/jas-d-16-0159.1.xml
___________________________
Atmospheric circuit influences on ground-level pressure in the Antarctic and Arctic
2008
https://agupubs.onlinelibrary.wiley.com/doi/epdf/10.1029/2007JD009618
___________________________
Antarctic Atmospheric Electricity and Ionospheric Convection
Proposal Summary
https://www.uh.edu/research/spg/ago96sum.html
___________________________
The global atmospheric electric circuit, solar activity and climate change
2000
Abstract
https://www.sciencedirect.com/science/article/abs/pii/S1364682600001127
___________________________
Electric Field Measurements in the Antarctic Reveal Patterns Related to the El Niño—Southern Oscillation
21 October 2021
https://agupubs.onlinelibrary.wiley.com/doi/full/10.1029/2021GL095389
___________________________
On the connection between the atmospheric electric field measured at the surface and the ionospheric electric field in the Central Antarctica
2010
https://www.sciencedirect.com/science/article/abs/pii/S1364682609003277
___________________________
Earth electricity: A review of mechanisms which cause telluric currents in the lithosphere
January 2014
___________________________
The Global Representativeness of Fair-Weather Atmospheric Electricity Parameters From the Coastal Station Maitri, Antarctica
Abstract
Atmospheric electricity parameters (AEP) measurements from Antarctica predominantly feature either the potential gradient (PG) and/or air-Earth current (AEC) density. We report for the first time simultaneous measurements of the bipolar ions concentration/conductivity, PG, and AEC density. AEP measurements were carried out at Maitri (70.8°S, 11.8°E) from December 2018 to November 2019. We formulated a few criteria, irrespective of the weather conditions, to select the electrically quiet days and some additional criteria based on the conductivity measurements to discern globally representative data (GRD) from such days. The measurements of the PG and AEC density over the Antarctic plateau demonstrated the diurnal curves similar to the Carnegie pattern, which represents the global thunderstorms and electrified shower clouds (ESCs) occurring on different continents and oceans, we regard the data having such trend as GRD. We found significant variability in the concentration of small bipolar ions/conductivity in the austral summer which in turn affects GRD. However, the concentration of bipolar ions is nearly consistent at ∼250 negative ions cm−3 and ∼300 positive ions cm−3 in winter and enhances the probability of GRD. Such differences can arise out of the prevalent planetary boundary layer processes in the two seasons. When the PG varied between ∼50 Vm−1 and ∼150 Vm−1 and the maximum range of conductivity variations was ∼0.2 × 10⁻¹⁴ ℧ m−1, the AEPs represented the signatures of the global thunderstorm and ESC activities.
Key Points
-
Atmospheric electrical conductivity is the key parameter to discern globally representative data (GRD) over the Maitri, Antarctica
-
GRD is discernible on a day when conductivity is consistent, and such days are most common in local winter
-
In the austral summer, the planetary boundary layer (PBL) processes produce local electrical signals that interfere with the global signals
Plain Language Summary
Monitoring of the atmospheric electricity parameters is a simple technique to monitor global thunderstorm activity and electrified shower clouds. For this, the data need to be free from local disturbances. Obtaining such data in Antarctic Plateau was found to be successful. On the other hand, the coastal Antarctic stations, experience local or regional contributions in it. This paper attempts to provide some techniques to obtain globally representative data (GRD). This paper suggests that the diurnal variation of the concentration of bipolar small ions strongly impacts the GRD. Therefore a day free from the diurnal variation of the concentration of bipolar ions is essential to discern the global signals. The winter season appears to be a better season for this as the summer season experiences mild convection activity that causes local and regional electrical signals that contaminate the data.

Figure 1
The geographical location of Maitri and the sites of measurement of potential gradient and air-Earth current. The inserted wind rose shows the predominant wind direction on the days free from the circumpolar low-pressure system. The barren land seen in the figure is part of Schirmacher Oasis.
https://agupubs.onlinelibrary.wiley.com/doi/10.1029/2022JD037696
___________________________
Antarctica is covered in volcanoes, could they erupt?
April 7, 2024
___________________________
List of volcanoes in Antarctica
Table
A 2017 study claimed to have found 138 volcanoes, of which 91 were previously unknown. Some volcanoes are entirely under the ice sheet.[1][2] Unconfirmed volcanoes are not included in the table below.

https://en.wikipedia.org/wiki/List_of_volcanoes_in_Antarctica
___________________________
Massive Antarctic volcanic eruptions linked to abrupt Southern hemisphere climate changes
September 4, 2017
New findings published today in the Proceedings of the National Academy of Sciences of the United States of America (PNAS) by Desert Research Institute (DRI) Professor Joseph R. McConnell, Ph.D., and colleagues document a 192-year series of volcanic eruptions in Antarctica that coincided with accelerated deglaciation about 17,700 years ago.

A 15-meter pan-sharpened Landsat 8 image of the Mount Takahe volcano rising more than 2,000 meters (1.2 miles) above the surrounding West Antarctic ice sheet in Marie Byrd Land, West Antarctica.
https://phys.org/news/2017-09-massive-antarctic-volcanic-eruptions-linked.html
___________________________
Geophysical evidence of a large occurrence of mud volcanoes associated with gas plumbing system in the Ross Sea (Antarctica)
2023
https://www.sciencedirect.com/science/article/pii/S1674987123001949
___________________________
Kimberlite
Kimberlite is an igneous rock and a rare variant of peridotite. It is most commonly known as the main host matrix for diamonds. It is named after the town of Kimberley in South Africa, where the discovery of an 83.5-carat (16.70 g) diamond called the Star of South Africa in 1869 spawned a diamond rush and led to the excavation of the open-pit mine called the Big Hole. Previously, the term kimberlite has been applied to olivine lamproites as Kimberlite II, however this has been in error.
Kimberlite occurs in the Earth's crust in vertical structures known as kimberlite pipes, as well as igneous dykes and can also occur as horizontal sills. Kimberlite pipes are the most important source of mined diamonds today. The consensus on kimberlites is that they are formed deep within Earth's mantle. Formation occurs at depths between 150 and 450 kilometres (93 and 280 mi), potentially from anomalously enriched exotic mantle compositions, and they are erupted rapidly and violently, often with considerable carbon dioxide and other volatile components. It is this depth of melting and generation that makes kimberlites prone to hosting diamond xenocrysts.
Despite its relative rarity, kimberlite has attracted attention because it serves as a carrier of diamonds and garnet peridotite mantle xenoliths to the Earth's surface. Its probable derivation from depths greater than any other igneous rock type, and the extreme magma composition that it reflects in terms of low silica content and high levels of incompatible trace-element enrichment, make an understanding of kimberlite petrogenesis important. In this regard, the study of kimberlite has the potential to provide information about the composition of the deep mantle and melting processes occurring at or near the interface between the cratonic continental lithosphere and the underlying convecting asthenospheric mantle.
https://en.wikipedia.org/wiki/Kimberlite
____________________________
Amundsen's Attainment of the South Pole
1912
https://www.jstor.org/stable/26010352
___________________________
Antarctic Stations - Bases - Currently Occupied
https://www.coolantarctica.com/Community/antarctic_bases.php
___________________________
Features of Extreme Precipitation at Progress Station, Antarctica
September 2018
https://www.researchgate.net/publication/327657397_Features_of_Extreme_Precipitation_at_Progress_Station_Antarctica
___________________________
Future progress in Antarctic science: improving data care, sharing and collaboration
22 July 2013
https://www.cambridge.org/core/journals/earth-and-environmental-science-transactions-of-royal-society-of-edinburgh/article/abs/future-progress-in-antarctic-science-improving-data-care-sharing-and-collaboration/C127C3A6E30C1BC1195F926A1E95A2D5
___________________________
Antarctic ozone hole is 13th largest on record and expected to persist into November
October 27, 2021
The 2021 Antarctic ozone hole reached its maximum area on October 7 and ranks 13th largest since 1979, scientists from NOAA and NASA reported today. This year’s ozone hole developed similarly to last year's: A colder than usual Southern Hemisphere winter lead to a deep and larger-than-average hole that will likely persist into November or early December.
“This is a large ozone hole because of the colder than average 2021 stratospheric conditions, and without a Montreal Protocol offsite link, it would have been much larger,” said Paul Newman, chief scientist for Earth Sciences at NASA’s Goddard Space Flight Center.
What we call the ozone hole is a thinning of the protective ozone layer in the stratosphere (the upper layer of Earth’s atmosphere) above Antarctica that begins every September. Chlorine and bromine derived from human-produced compounds are released from reactions on high-altitude polar clouds. The chemical reactions then begin to destroy the ozone layer as the sun rises in the Antarctic at the end of winter.
https://www.noaa.gov/news/antarctic-ozone-hole-is-13th-largest-on-record-and-expected-to-persist-into-november
___________________________
A decade of progress in observing and modelling Antarctic subglacial water systems
28 January 2016
https://royalsocietypublishing.org/doi/10.1098/rsta.2014.0294
___________________________
Circulation, mixing, and production of Antarctic Bottom Water
1999
https://www.sciencedirect.com/science/article/abs/pii/S007966119900004X
___________________________
Biogeochemistry and limnology in Antarctic subglacial weathering: molecular evidence of the linkage between subglacial silica input and primary producers in a perennially ice-covered lake
15 April 2015
https://progearthplanetsci.springeropen.com/articles/10.1186/s40645-015-0036-7
___________________________
Heatwaves and snow: What's really happening to the Antarctic climate?
18/04/2022
Last month Antarctica experienced a record-breaking heatwave, and unusually high amounts of snowfall in some places. Climate Now asks experts on the ice to explain what's really happening on the frozen continent.
Last month, Antarctica experienced a record-breaking heatwave and unusually high amounts of snowfall in some places, leaving scientists puzzled.
In this special episode of Climate Now, we explore the latest data from the frozen continent and explore how this extreme environment is changing as the planet warms.
Sea ice extent 26% below average
The latest Copernicus data shows the Antarctic sea ice extent was 26 per cent below average last month - the second lowest on record.
Conger ice shelf collapse
In the wake of the record temperatures, another dramatic image from Antarctica made the headlines in March. The Sentinel-2 spacecraft took 'before and after' photos of the 1.2 square kilometer Conger ice shelf - an area the size of Rome - which collapsed after years of instability.
It is premature to link the collapse of Conger to the March heatwave. However AWI scientist Hartmut Helmer told Euronews that the satellite images are consistent with a known effect of rainfall on glaciers - the liquid water will penetrate into existing cracks in the ice, and then freeze.
"So when you freeze this fresh water in the cracks, then you actually crack the whole ice shelf, and then that causes these little sugar cubes", as can be seen in the image on the right.
"Such heatwaves might cause in certain areas this kind of disintegration," Helmer concludes.
___________________________
Antarctic Treaty signatories make marine protection progress
May 8, 2014
https://phys.org/news/2014-05-antarctic-treaty-signatories-marine.html
___________________________
Death of a Treaty: The Decline and Fall of the Antarctic Minerals Convention
1989
https://scholarship.law.vanderbilt.edu/vjtl/vol22/iss3/4/
___________________________
Progress update on Antarctic toothfish inter-connectivity project
https://meetings.ccamlr.org/en/wg-fsa-18/64
___________________________
Unexplored Antarctic meteorite collection sites revealed through machine learning
26 Jan 2022
https://www.science.org/doi/10.1126/sciadv.abj8138
___________________________
Falklands - South Georgia - Antarctic Peninsula
https://www.aqua-firma.com/experiences/falklands-south-georgia-antarctic-peninsula
___________________________
An ancient, Antarctic-specific species complex: large divergences between multiple Antarctic lineages of the tardigrade genus Mesobiotus
2022
https://www.sciencedirect.com/science/article/pii/S1055790322000422
___________________________
Scientists create new map showing ice-free Antarctica in more detail than ever before

___________________________
Integrated provenance characteristics of glacial-marine sediment from East and West Antarctica
2007
https://pubs.usgs.gov/of/2007/1047/ea/of2007-1047ea060.pdf
___________________________
1.5 million-year-old Antarctic ice is helping scientists predict the future of climate change
03/12/2021
https://www.euronews.com/green/2021/12/02/how-can-1-5-million-year-old-antarctic-ice-help-us-to-predict-the-future-of-climate-change
___________________________
700-year-old Antarctic ice cores reveal unexpected impact on Earth's atmosphere
Oct. 6, 2021
Humans have been affecting the atmosphere longer than previously thought and at more significant levels.
https://www.cnet.com/science/700-year-old-antarctic-ice-cores-reveal-unexpected-impact-on-earths-atmosphere/
___________________________
Past Antarctic Warming Linked to Greenhouse Gas
February 28, 2013
https://www.livescience.com/27549-carbon-dioxide-caused-antarctica-warming.html
___________________________
Sudden Disappearance of Giant Antarctic Lake Leaves Massive Crater – 200 Billion Gallons of Water Gone
June 29, 2021

Landsat 8 image of the Antarctic doline with summer meltwater
https://scitechdaily.com/sudden-disappearance-of-giant-antarctic-lake-leaves-massive-crater-200-billion-gallons-of-water-gone/
___________________________
Talking about Iceberg Melt Rates and Glacier Frontal Ablation: Seller and Heim Glacier, Antarctica
May 18, 2020
https://blogs.agu.org/fromaglaciersperspective/2020/05/18/talking-about-iceberg-melt-seller-and-heim-glacier-antarctica/
___________________________
The variety and distribution of submarine glacial landforms and implications for ice-sheet reconstruction
30 November 2016
https://mem.lyellcollection.org/content/46/1/519
___________________________
New Research Details the Net Retreat of Antarctic Glacier Grounding Lines
April 2, 2018
https://scitechdaily.com/research-details-net-retreat-of-antarctic-glacier-grounding-lines/
___________________________
Natural Hazards of the Antarctic Tectonic Region
https://antarctic-plate-tectonics.weebly.com/natural-hazards-of-the-antarctic-tectonic-region.html
___________________________
Active leak of sea-bed methane discovered in Antarctica for first time
July 22, 2020
https://phys.org/news/2020-07-leak-sea-bed-methane-antarctica.html
___________________________
Emissions of nitrous oxide and methane from Antarctic Tundra: role of penguin dropping deposition
2020
https://www.sciencedirect.com/science/article/abs/pii/S1352231002003400
___________________________
Methanogens in the Antarctic Dry Valley permafrost
05 June 2018
https://pubmed.ncbi.nlm.nih.gov/29878114/
___________________________
'Waterfall' of microbes in Antarctic sea floor leads to discovery of methane leak
July 22, 2020
https://www.reuters.com/article/us-climate-change-antarctica-methane-idUSKCN24N31U
___________________________
Billions of Tons of Methane Lurk Beneath Antarctic Ice
August 29, 2012
https://www.livescience.com/22793-methane-antarctic-ice.html
___________________________
Potential methane reservoirs beneath Antarctica
August 29, 2012
https://www.sciencedaily.com/releases/2012/08/120829131628.htm
___________________________
Antarctic Methane: A New Factor in the Climate Equation
August 29, 2012
https://www.climatecentral.org/news/antarctic-methane-a-new-factor-in-the-climate-equation-14913
___________________________
First evidence of widespread active methane seepage in the Southern Ocean, off the sub-Antarctic island of South Georgia
2014
https://www.sciencedirect.com/science/article/abs/pii/S0012821X1400421X
___________________________
Scientists studied microbes feeding on Antarctica’s first methane leak – here’s what they found
Aug 20, 2020
Antarctica holds up to a quarter of the planet’s marine methane.
The first known methane leak in Antarctica could be a worrying sign of more to come.
Ocean-dwelling microorganisms eat methane, preventing it from being released into the atmosphere.
https://www.weforum.org/agenda/2020/08/antarctica-methane-leak-microorganisms/
___________________________
Methane-Eating Bacteria Discovered Under The Antarctic Shelf
Aug 3, 2017
Deep
beneath the ice of the South Pole exists a lifeform that could help us
manage greenhouse gas emissions. The bacteria that live there survive by
digesting methane, acting as a phenomenal biofilter between the frozen
environment and the rest of the planet.
In 2013, an international
and interdisciplinary team of scientists drilled 800 meters (2,600
feet) into the West Antarctic Ice Sheet, where they reached Lake
Whillans. The researchers collected samples of water and sediments that
had been isolated from the atmosphere for many thousands of years. Their
results are published in Nature Geoscience.
"Not only is this
important for the global climate, but methane oxidation could be a
widespread means of life for microbes in the deep, permanently cold
biosphere beneath the West Antarctic Ice Sheet," lead author Alexander
Michaud, from Montana State University, said in a statement.
The
team looked at the genome of the bacteria and at the concentration of
methane in the sample. They believe there is a large reservoir of
methane under the West Antarctic Ice Sheet and, if their findings are
correct, the bacteria may be helping to prevent the gas from releasing
into the atmosphere.
While there’s less methane than carbon
dioxide, it’s actually a much more potent greenhouse gas. Over a period
of 20 years, it has warmed the planet 86 times as much as CO2. This
means that if there are indeed methane deposits, it’s better to keep
them from getting into the atmosphere.
Through methane oxidation,
these bacteria living in Lake Whillans may be able to consume more than
99 percent of the methane, representing a significant carbon sink.
The
presence of this complex environment also raises the intriguing
possibility of life on the icy moons of Saturn and Jupiter, although
this is still early on all fronts. We have no concrete evidence of life
outside Earth and we have barely started to study what lies beneath the
Antarctic ice.
"It took more than a decade of scientific and
logistical planning to collect the first clean samples from an Antarctic
subglacial environment, but the results have transformed the way we
view the Antarctic continent," added co-author John Priscu of Montana
State University.
Understanding potential sources of methane and
where methane can “sink” might help us refine our climate models and
maybe even find ways to improve the capture of greenhouse gases.
https://www.iflscience.com/methane-eating-bacteria-discovered-under-the-antarctic-shelf-43094
___________________________
Methane-eating microbes may reduce release of gases as Antarctic ice sheets melt
July 31, 2017
https://phys.org/news/2017-07-methane-eating-microbes-gases-antarctic-ice.html
___________________________
Bacteria ate up all the methane that spilled from the Deepwater Horizon well
January 6, 2011
https://www.nationalgeographic.com/science/article/bacteria-ate-up-all-the-methane-that-spilled-from-the-deepwater-horizon-well
___________________________
Hidden Lake Formation
The Hidden Lake Formation is a Late Cretaceous geologic formation in Antarctica. The sandstones and siltstones of the formation were deposited in a deltaic environment.
Indeterminate megalosaur remains have been recovered from it.[2] Also many plant fossils and ichnofossils of Planolites sp. and Palaeophycus sp. have been found in the formation.
https://en.wikipedia.org/wiki/Hidden_Lake_Formation
___________________________
Combating ecosystem collapse from the tropics to the Antarctic
25 February 2021
https://onlinelibrary.wiley.com/doi/10.1111/gcb.15539
___________________________
Rapid radiation of Southern Ocean shags in response to receding sea ice
27 March 2022
Abstract
Aim
Understanding how natural populations respond to climatic shifts is a fundamental goal of biological research in a fast-changing world. The Southern Ocean represents a fascinating system for assessing large-scale climate-driven biological change, as it contains extremely isolated island groups within a predominantly westerly, circumpolar wind and current system. Blue-eyed shags represent a paradoxical seabird radiation—a circumpolar distribution implies strong dispersal capacity yet their species-rich nature suggests local adaptation and isolation. Here we attempt to resolve this paradox in light of the history of repeated cycles of climate change in the Southern Ocean.
https://onlinelibrary.wiley.com/doi/10.1111/jbi.14360
___________________________
Magnetospheric Substorms: Introduction
1977
https://link.springer.com/chapter/10.1007/978-94-010-1164-8_6
___________________________
Relationship Between Geomagnetic Storms and Auroral/Magnetospheric Substorms: Early Studies
09 December 2020
https://www.frontiersin.org/articles/10.3389/fspas.2020.604755/full
___________________________
Effect of magnetic storms and substorms on the low- latitude/ equatorial ionosphere
2006
https://cdaw.gsfc.nasa.gov/publications/ilws_goa2006/361_Sastri.pdf
___________________________
A Review of Studies of Geomagnetic Storms and Auroral/Magnetospheric Substorms Based on the Electric Current Approach
08 January 2021
https://www.frontiersin.org/articles/10.3389/fspas.2020.604750/full
___________________________
The evolving concept of a magnetospheric substorm
1999
https://www.sciencedirect.com/science/article/abs/pii/S1364682698001199
___________________________
A MECHANISM FOR MAGNETOSPHERIC SUBSTORMS
https://ntrs.nasa.gov/api/citations/19960000800/downloads/19960000800.pdf
___________________________
Near-Earth magnetic signature of magnetospheric substorms and an improved substorm current model
2008
https://angeo.copernicus.org/articles/26/2781/2008/angeo-26-2781-2008.pdf
___________________________
Energy Flux in the Earth’s Magnetosphere: Storm-Substorm Relationship
https://link.springer.com/chapter/10.1007/978-94-007-1069-6_15/cover/
___________________________
Accelerated thinning of the near-Earth plasma sheet caused by a bubble-blob pair
2011
https://www.academia.edu/es/62706584/Accelerated_thinning_of_the_near_Earth_plasma_sheet_caused_by_a_bubble_blob_pair
___________________________
Auroral Arcs
https://www.sciencedirect.com/topics/earth-and-planetary-sciences/auroral-arcs
___________________________
Aurora
https://en.wikipedia.org/wiki/Aurora
___________________________
GPS scintillation in the high arctic associated with an auroral arc
27 March 2008
https://agupubs.onlinelibrary.wiley.com/doi/full/10.1029/2007SW000349
___________________________
Multiple transpolar auroral arcs reveal insight about coupling processes in the Earth's magnetotail
2020 Jun 29
https://pubmed.ncbi.nlm.nih.gov/32601186/
___________________________
Measuring the Thicknesses of Auroral Curtains
1991
https://pubs.aina.ucalgary.ca/arctic/Arctic44-3-231.pdf
___________________________
Active auroral arc powered by accelerated electrons from very high altitudes
18 January 2021
https://www.nature.com/articles/s41598-020-79665-5
___________________________
Solar wind dependence of the occurrence and motion of polar auroral arcs: A statistical study
2002
https://people.kth.se/~kullen/finaltpapaper.pdf
___________________________
Discrete Auroral Arcs and Nonlinear Dispersive Field Line Resonances
1999
https://www.academia.edu/4089502/Discrete_Auroral_Arcs_and_Nonlinear_Dispersive_Field_Line_Resonances
___________________________
Narrowing of the discrete auroral arc by the ionosphere
1 October 2007
We
investigate the role of the ionosphere in the development of intense,
narrow discrete auroral arcs. Our study shows that interactions between a
pair of downward and upward magnetic field-aligned currents (FACs) and
the ionosphere can lead to the narrowing of the upward current channel
and broadening of the downward current channel such that the total width
of the initial current pair remains the same. In this case the
intensity of the upward current increases, and the intensity of the
large-scale downward current decreases. Conditions promoting this
asymmetry between the upward and downward FACs include low ionospheric
conductivity (≤1 mho) and a moderate magnitude of the current density
(<5 μA/m 2 ). Simulations show that the ionosphere causes significant
asymmetry not only in the structure and amplitude of the currents but
also in the structure and amplitude of the corresponding parallel
electric fields. The dynamics of the parallel electric field in the
upward current channel is similar to the dynamics of the current itself,
but the dynamics of the field in the downward current channel differs
from the dynamics of the current. The major difference is that the width
of the downward current channel becomes broader with time but the scale
size of the parallel electric field becomes smaller inside the channel.
This effect is quite important for understanding the parallel electron
acceleration in the auroral zone. In particular, it may explain why the
so-called "black" auroral arcs, which are produced by the electrons
flowing along the magnetic field lines from the ionosphere, always
appear in the form of very narrow, discrete dark lines.
https://www.semanticscholar.org/paper/Narrowing-of-the-discrete-auroral-arc-by-the-Streltsov/8e1d758f78f79fae1fed77a2797fd4914b3936be
___________________________
North-South Asymmetry in the Geographic Location of Auroral Substorms correlated with Ionospheric Effects
22 November 2018
https://www.nature.com/articles/s41598-018-35091-2
___________________________
A
comparative study of auroral morphology distribution between the
Northern and Southern Hemisphere based on automatic classification
20 Mar 2018
https://gi.copernicus.org/articles/7/113/2018/
___________________________
Multiple transpolar auroral arcs reveal insight about coupling processes in the Earth’s magnetotail
June 2020
https://www.researchgate.net/publication/342552808_Multiple_transpolar_auroral_arcs_reveal_insight_about_coupling_processes_in_the_Earth's_magnetotail
___________________________
Quiescent Discrete Auroral Arcs: A Review of Magnetospheric Generator Mechanisms
2019
https://par.nsf.gov/servlets/purl/10188751
___________________________
Relation of polar auroral arcs to magnetotail twisting and IMF rotation: a systematic MHD simulation study
2004
https://angeo.copernicus.org/articles/22/951/2004/angeo-22-951-2004.pdf
___________________________
Observation of electron density in the auroral ionosphere-Results of the Antarctic rockets S-310JA-11 and -12
31 January 1988
https://core.ac.uk/display/51483477
___________________________
It’s No Waltz Across Texas but the Northern Lights do in Fact Dance Across the Night Sky
February 3, 2017
https://texashillcountry.com/northern-lights-dance-across-night-sky/
___________________________
'Cannibal' solar flare brings rare aurora borealis to Colorado
March 31, 2022
The northern lights were seen in Colorado on Wednesday; more chances to see the aurora are on the way.
https://www.9news.com/article/weather/cannibal-solar-flare-brings-rare-aurora-borealis-colorado/73-da2585c7-a360-49cc-96a5-7d5e04f6779d
___________________________
Aurora: Illuminating the Sun-Earth Connection
https://www.nasa.gov/aurora
___________________________
Aurora
https://pwg.gsfc.nasa.gov/polar/EPO/auroral_poster/aurora_all.pdf
___________________________
The Northern Lights and other auroras are disappearing from some parts of Earth — but scientists predict a big comeback
Dec 10, 2017
https://www.businessinsider.com/how-auroras-solar-cycle-minimum-maximum-related-2017-12?op=1
___________________________
10 Things No One Ever Tells You About the Northern Lights
https://luxeadventuretraveler.com/northern-lights/
___________________________
Where to see the southern lights
Travelling in Tasmania? Keep your eyes peeled for one of nature’s most magnificent shows.
___________________________
Antarctica's Sunrise, Sunset & The Green Flash Phenomenon
May 23rd, 2024
The Green Flash at Sunset (or Sunrise)
Speaking of mirages: Among the most famous and elusive optical phenomena that can be observed in Antarctica’s pristine skies is the rarely observed and much-coveted green flash. The green flash describes a generally very fleeting smudge, disc, or rim of emerald—or, sometimes, blue—flaring out above the Sun when it’s nearly or entirely below the horizon.
Clear, clean, still air and a very level horizon provide the best conditions for observing the green flash. The White Continent’s icy seascapes and high, flat (and little-visited) Polar Plateau offer a prime setup, even if the odds of spotting the green flash during any given Antarctica sunset are low.
Indeed, so uncommon and unpredictable is the green flash that over the centuries it’s sometimes been passed off as a mariner’s myth. Yet photographs exist that prove its existence, and some Antarctic tourists have indeed lucked out with a once-in-a-lifetime glimpse.
The 1929 Green Flash Observation at Little America in Antarctica
On October 16, 1929, members of Admiral Richard Byrd’s first Antarctic expedition enjoyed one heck of a green-flash spectacle—perhaps the most impressive ever recorded by human observers—from the Little America base on the Ross Ice Shelf.
They saw the green flash on and off for more than a half-hour, much longer than the usual momentary, don’t-blink-or-you’ll-miss-it firing. An academic analysis in 2015 suggested that a combination of factors likely accounted for this extended show. These included “strong atmospheric refraction” facilitating a so-called Novaya Zemyla-style mirage—which can produce a distorted image of the Sun when it’s actually several degrees below the horizon—as well as the expedition members effectively landing themselves two sunsets by climbing up Little America’s radio towers during the event.
https://www.antarcticacruises.com/guide/antarctica-sunrise-sunset-and-the-green-flash
___________________________
Someone Detonated a Nuclear Weapon And We Don't Know Who
Jun 20, 2025
https://www.youtube.com/watch?v=ijaeqm7pHzc&t=9s
___________________________
Nuclear Explosion seen from New Zealand!
2022
https://www.youtube.com/shorts/2kU-OzhexUk
___________________________
Record-breaking winter winds have blown old Arctic sea ice into the melt zone
August 10, 2021
https://www.arctictoday.com/record-breaking-winter-winds-have-blown-old-arctic-sea-ice-into-the-melt-zone/
___________________________
Africa: A Geomagnetic Storm Has Hit Earth - a Space Scientist Explains What Causes Them
8 October 2024
https://allafrica.com/stories/202410080323.html
___________________________
Solar Storm Threat Is Back as Giant Sunspot Cluster Reappears
It’s back! After unleashing the strongest geomagnetic storm in more than 20 years, the notorious sunspot cluster AR3664 is once again visible and still spewing copious amounts of radiation into space.
The National Oceanic and Atmospheric Administration’s (NOAA) Space Weather Prediction Center recorded a solar flare erupting from the southeast limb of the Sun on Monday. Sunspot AR3664 is likely responsible for the flare, which was classified as a strong X2.8.
https://gizmodo.com/sunspot-cluster-returns-auroras-repeat-possible-sun-1851503363
___________________________
Magnetospheric substorm (Recently Published Documents)
2021
https://www.sciencegate.app/keyword/215451
___________________________
Magnetospheric substorms and discrete arcs of the polar aurora
November 2013
https://www.researchgate.net/publication/257911031_Magnetospheric_substorms_and_discrete_arcs_of_the_polar_aurora
___________________________
The earth's magnetosphere under continued forcing - Substorm activity during the passage of an interplanetary magnetic cloud
1993
https://ntrs.nasa.gov/citations/19930053284
___________________________
Polar and Magnetospheric Substorms
1968
https://link.springer.com/book/10.1007/978-94-010-3461-6
___________________________
Scintillation producing ionospheric structures over Antarctic plateau during substorm events
December 2019
https://ui.adsabs.harvard.edu/abs/2019AGUFMSM41A..07D/abstract
___________________________
Substorm
2021
1. Introduction
Substorms are the fundamental process of magnetospheric dynamics [Akasofu, 1968; McPherron, 1995]. Although significant progress has been made in understanding the physics of substorms, there is serious controversy on a number of important issues. One of the issues is what process is responsible for the onset of substorms. Magnetic reconnection at a near-Earth neutral line (NENL) is a widely accepted mechanism [Hones, 1984; Baker et al., 1996, 1999]. In the NENL model, magnetic reconnection onset occurs in the near tail on the closed field lines of the plasma sheet between -20 and -30 RE. The reconnection causes the formation of plasmoids and the release of the energy stored in the tail into the ionosphere. A statistical study of Geotail measurements provides evidence of the reconnection location and support for the NENL model [Nagai et al., 1998]. The current disruption, which occurs in the near-Earth magnetosphere, is another candidate mechanism [Lui, 1991, 1996]. In the current disruption model, the substorm onset location is near the boundary between the tail-like and the dipolar-like field regions, and rarefaction waves launched in the disruption region propagate antisunward and lead to the X-line reconnection. Both models recognize the existence of the magnetic reconnection in the near tail. The dispute is whether the reconnection is a cause or a consequence of the substorm onset.
Another issue is what triggers substorm onsets. It is found that substorm onsets are often coincident with a northward turning of the IMF or a solar wind pressure impulse after a few hours of southward IMF [Cann et al., 1975, 1977; Kokubun et al., 1977; Rostoker, 1983; Petrinec and Russell, 1996]. Such a correlation results in the conjecture that the substorm onset might be triggered by a sudden change in the solar wind. On the other hand, it is observed that substorm onsets can also occur when there is no obvious triggers from the solar wind
https://www.sciencedirect.com/topics/earth-and-planetary-sciences/substorm
___________________________
North-South Asymmetry in the Geographic Location of Auroral Substorms correlated with Ionospheric Effects
2018
https://pubmed.ncbi.nlm.nih.gov/30467409/
___________________________
Common solar wind drivers behind magnetic storm–magnetospheric substorm dependency
19 November 2018
https://www.nature.com/articles/s41598-018-35250-5
___________________________
Magnetospheric substorms.
1972
https://ntrs.nasa.gov/citations/19720050237
___________________________
Substorms
https://pwg.gsfc.nasa.gov/Education/wsubstrm.html
___________________________
A magnetospheric substorm observed at Sanae, Antarctica
March 1987
https://ui.adsabs.harvard.edu/abs/1987JGR....92.2461G/abstract
___________________________
On magnetic storms and substorms
2006
https://cdaw.gsfc.nasa.gov/publications/ilws_goa2006/320_Lakhina.pdf
___________________________
Geomagnetic storm and substorm aurora observed from Spitsbergen
27 October 2009
https://www.cambridge.org/core/journals/polar-record/article/abs/geomagnetic-storm-and-substorm-aurora-observed-from-spitsbergen/87DDB80D2E08FCC805228D8F8FDB7EAE
___________________________
Effects of Magnetospheric Plasma on Auroral Substorm (Reports of the Japanese Antarctic Research Expedition)
1972
https://core.ac.uk/display/201412109
___________________________
Correction to “Interchange instability in the inner magnetosphere associated with geosynchronous particle flux decreases”
2004
https://www.academia.edu/es/53004496/Correction_to_Interchange_instability_in_the_inner_magnetosphere_associated_with_geosynchronous_particle_flux_decreases_
___________________________
What is Aurora Borealis and what are Aurora Borealis colors
January 2, 2023
https://worldwidetravel.tips/northern-lights/what-is-aurora-borealis-colors/
___________________________
Aurora Throughout Our Solar System
Jun 3, 2021
https://www.discovermagazine.com/the-sciences/aurora-throughout-our-solar-system
___________________________
Aurora Borealis Facts: How the Northern Lights Work
May 12, 2022
https://earthhow.com/aurora-borealis-northern-lights/
___________________________
20 Aurora Borealis Facts You will Love to Know
https://hello-aurora.com/news/20-aurora-facts
___________________________
Auroras: The Northern and Southern Lights
https://www.nationalgeographic.com/science/article/auroras
___________________________
Scientist From NASA Makes The Aurora Borealis In A Big Glass Jar
2016
https://bitrebels.com/technology/scientist-nasa-aurora-borealis-glass/
___________________________
Newfound Martian Aurora Actually the Most Common; Sheds Light on Mars’ Changing Climate
2019
https://www.nasa.gov/press-release/goddard/2019/mars-proton-aurora-common
___________________________
Auroras on Mars
May 11, 2015
https://science.nasa.gov/science-news/science-at-nasa/2015/11may_aurorasonmars/
___________________________
Aurora on Mars
https://en.wikipedia.org/wiki/Aurora_on_Mars
___________________________
NASA Spacecraft Detects Aurora and Mysterious Dust Cloud around Mars
2015
https://www.nasa.gov/press/2015/march/nasa-spacecraft-detects-aurora-and-mysterious-dust-cloud-around-mars
___________________________
Auroras on Mars
May 11, 2015
https://mars.nasa.gov/news/auroras-on-mars/
___________________________
New Type of Aurora on Mars Stunned Scientists
28.04.2022
https://universemagazine.com/en/new-type-of-aurora-on-mars-stunned-scientists/
___________________________
Why Auroras Are Red on Mars
NASA’s MAVEN spacecraft picked up on a dazzling light display on the Red Planet.
2015
https://www.theatlantic.com/technology/archive/2015/03/why-auroras-are-red-on-mars/388493/
___________________________
Strong Solar Storm Sparked Planet-Wide Aurora on Mars
October 11, 2017
https://www.space.com/38416-solar-storm-mars-auroras-nasa-maven.html
___________________________
Regolith
https://en.wikipedia.org/wiki/Regolith
Regolith (/ˈrɛɡəlɪθ/)[1][2] is a blanket of unconsolidated, loose, heterogeneous superficial deposits covering solid rock. It includes dust, broken rocks, and other related materials and is present on Earth, the Moon, Mars, some asteroids, and other terrestrial planets and moons.
___________________________
Nemesis (The Death Star) - Solomon's Temple Investigation Marathon #1119
April 27. 2025
https://archive.org/details/solomons-temple-1119
___________________________
REMOTE SENSING SPACE WEATHER EVENTS THROUGH IONOSPHERIC RADIO: THE AARDD
2011
https://www.ursi.org/proceedings/procGA11/ursi/H11-4.pdf
___________________________
What's Causing Those Mysterious 'Bursts' From Deep Space?
___________________________
Crumbling planets might trigger repeating fast radio bursts
April 18, 2022
It’s one more hypothesis among many for the source of these flares
Fragmenting planets sweeping extremely close to their stars might be the cause of mysterious cosmic blasts of radio waves.
https://www.sciencenews.org/article/fast-radio-burst-planet-neutron-star-cosmic
___________________________
We Caught Something Moving in Deep Space
2022
https://www.youtube.com/shorts/VFDOQgv8oMY
___________________________
What’s a pulsar? Why does it pulse?
July 15, 2022
https://earthsky.org/space/what-is-a-pulsar/
___________________________
Pulsar
A
pulsar (pulsating star, on the model of quasar)[1] is a highly
magnetized rotating neutron star that emits beams of electromagnetic
radiation out of its magnetic poles.[2] This radiation can be observed
only when a beam of emission is pointing toward Earth (similar to the
way a lighthouse can be seen only when the light is pointed in the
direction of an observer), and is responsible for the pulsed appearance
of emission. Neutron stars are very dense and have short, regular
rotational periods. This produces a very precise interval between pulses
that ranges from milliseconds to seconds for an individual pulsar.
Pulsars are one of the candidates for the source of ultra-high-energy
cosmic rays (see also centrifugal mechanism of acceleration).
https://en.wikipedia.org/wiki/Pulsar
___________________________
What are pulsars?
January 24, 2023
https://www.space.com/32661-pulsars.html
___________________________
Why Are Magnetars So Scary?
Our
knowledge of the universe is always expanding, much like the universe
itself. This means that we occasionally discover something new, or come
up with a new model to explain data we didn't quite understand before.
One such astronomical phenomena is the magnetar, a powerful type of
neutron star that was first proposed in 1979. That year, astronomers
suggested that certain blasts of gamma and X-ray radiation and radio
pulses might be explained by stars with exceptionally powerful magnetic
fields.
Since then, astronomers have identified dozens of
magnetars in and around the Milky Way. If you're curious what a magnetar
is, how they come to exist in the galaxy, and why astronomers consider
them among the scariest objects in the universe, read on...
https://science.howstuffworks.com/magnetars.htm
___________________________
Magnetar
A magnetar is a type of neutron star with an extremely powerful magnetic field (~109 to 1011 T, ~1013 to 1015 G).[1] The magnetic-field decay powers the emission of high-energy electromagnetic radiation, particularly X-rays and gamma rays.[2]
The existence of magnetars was proposed in 1992 by Robert Duncan and Christopher Thompson[3] following earlier work by Katz[4] on the Soft Gamma Repeater SGR 0525-66, then called a gamma-ray burst.
Their proposal sought to explain the properties of transient sources of gamma rays, now known as soft gamma repeaters (SGRs).[5][6] Over the following decade, the magnetar hypothesis became widely accepted, and was extended to explain anomalous X-ray pulsars (AXPs). As of July 2021, 24 magnetars have been confirmed.[7]
It has been suggested that magnetars are the source of fast radio bursts (FRB), in particular as a result of findings in 2020 by scientists using the Australian Square Kilometre Array Pathfinder (ASKAP) radio telescope.
https://en.wikipedia.org/wiki/Magnetar
___________________________
Magnetars: The Strongest Magnetic Fields in the Universe
March 23, 2025
https://www.sciencenewstoday.org/magnetars-the-strongest-magnetic-fields-in-the-universe
___________________________
Most distant quasar with powerful radio jets discovered
8 March 2021
With the help of the European Southern Observatory’s Very Large Telescope (ESO’s VLT), astronomers have discovered and studied in detail the most distant source of radio emission known to date. The source is a “radio-loud” quasar — a bright object with powerful jets emitting at radio wavelengths — that is so far away its light has taken 13 billion years to reach us. The discovery could provide important clues to help astronomers understand the early Universe.
Quasars are very bright objects that lie at the centre of some galaxies and are powered by supermassive black holes. As the black hole consumes the surrounding gas, energy is released, allowing astronomers to spot them even when they are very far away.
The newly discovered quasar, nicknamed P172+18, is so distant that light from it has travelled for about 13 billion years to reach us: we see it as it was when the Universe was just around 780 million years old. While more distant quasars have been discovered, this is the first time astronomers have been able to identify the telltale signatures of radio jets in a quasar this early on in the history of the Universe. Only about 10% of quasars — which astronomers classify as “radio-loud” — have jets, which shine brightly at radio frequencies [1].
P172+18 is powered by a black hole about 300 million times more massive than our Sun that is consuming gas at a stunning rate. “The black hole is eating up matter very rapidly, growing in mass at one of the highest rates ever observed,” explains astronomer Chiara Mazzucchelli, Fellow at ESO in Chile, who led the discovery together with Eduardo Bañados of the Max Planck Institute for Astronomy in Germany.
The astronomers think that there’s a link between the rapid growth of supermassive black holes and the powerful radio jets spotted in quasars like P172+18. The jets are thought to be capable of disturbing the gas around the black hole, increasing the rate at which gas falls in. Therefore, studying radio-loud quasars can provide important insights into how black holes in the early Universe grew to their supermassive sizes so quickly after the Big Bang.
“I find it very exciting to discover ‘new’ black holes for the first time, and to provide one more building block to understand the primordial Universe, where we come from, and ultimately ourselves,” says Mazzucchelli.
https://www.eso.org/public/news/eso2103/
___________________________
We Finally Know What Creates These Eerie Whistling Sounds in Space
16 November 2017
Using data from two different satellites, astronomers have linked an eerie-sounding phenomenon called a whistler mode chorus to sudden bursts of electrons in the magnetosphere.
Every now and then, the drizzle of charged particles that seeps through Earth's protective magnetic shell erupts into a sudden downpour. Researchers have had their suspicions as to the cause, and now they think they've finally nailed it.
Researchers from the University of Minnesota have combined information collected by NASA's Van Allen Probes mission and the FIREBIRD II CubeSat to show microbursts of electrons hitting our atmosphere timed almost perfectly with a common plasma wave surrounding our planet.
It's a small discovery, but could have big implications, since having charged particles showering down into our atmosphere has more important effects than just pretty polar auroras.
Virtual hurricanes of charged particles ripping through space put our delicate web of satellite and surface technology at significant risk.
Knowing how we can predict and prepare for such inevitable plasma storms is high on the list of priorities for astronomers, making research like this invaluable.
Waves of charged particles – or plasma – pulse through Earth's magnetic field at various speeds and frequencies that can be detected and re-interpreted as audible sounds. Plasma waves can produce a variety of 'songs', depending on where they're located and how they're moving.
One of the stranger sounding plasma wave soundtracks is known as a whistler mode chorus, which you can experience in the track below.
While electrons constantly slip free from their electromagnetic channels to sprinkle down onto our atmosphere, we've known for some time that they can occasionally turn into a solid downpour called a microburst.
Astronomers have speculated that these electron bursts could be the source of the chorus, but until now they have never been sure.
"Observing the detailed chain of events between chorus waves and electrons requires a conjunction between two or more satellites," says lead author Aaron Breneman, a physicist from the University of Minnesota.
"There are certain things you can't learn by having only one satellite – you need simultaneous observations at different locations."
One of those locations was roughly 500 kilometres (310 miles) up, where a small satellite called FIREBIRD II collects data on electrons hitting the ionosphere.
The second was from higher up, where a pair of probes loop in a wide, elliptical orbit that takes them more than 21,000 kilometres (over 13,000 miles) from the surface as they study the rings of radiation called Van Allen belts.
Analysing the combined data, the team found chorus waves out in the Van Allen belts began chirping immediately before FIREBIRD II detected microbursts.
Again, it's one small piece of a puzzle, but with each piece that is locked in place we'll be better able to monitor and manage our response to the delicacy of our Earth's magnetic fields - and their influence on the high tech instruments we use around the globe every day.
https://www.sciencealert.com/plasma-wave-origins-of-space-electron-microbursts-confirmed
___________________________
Electron Microbursts Induced by Nonducted Chorus Waves
2021
Microbursts, short-lived but intense electron precipitation observed by low-Earth-orbiting satellites, may contribute significantly to the losses of energetic electrons in the outer radiation belt. Their origin is likely due to whistler mode chorus waves, as evidenced by a strong overlap in spatial correlation of the two. Despite previous efforts on modeling bursty electron precipitation induced by chorus waves, most, if not all, rely on the assumption that chorus waves are ducted along the field line with zero wave normal angle. Such ducting is limited to cases when fine-scale plasma density irregularities are present. In contrast, chorus waves propagate in a nonducted way in plasmas with smoothly varying density, allowing wave normals to gradually refract away from the magnetic field line. In this study, the interaction of ducted and nonducted chorus waves with energetic electrons is investigated using test particle simulation. Substantial differences in electron transport are found between the two different scenarios, and resultant electron precipitation patterns are compared. Such a comparison is valuable for interpreting low Earth-orbiting satellite observations of electron flux variation in response to the interaction with magnetospheric chorus waves.
___________________________
Mysterious Pulsating Auroras Exist, And Scientists Might Have Figured Out What Causes Them
16 February 2018
Researchers have directly observed the scattering electrons behind the shifting patterns of light called pulsating auroras, confirming models of how charged solar winds interact with our planet's magnetic field.
With those same winds posing a threat to technology, it's comforting to know we've got a sound understanding of what's going on up there.
The international team of astronomers used the state-of-the-art Arase Geospace probe as part of the Exploration of energization and Radiation in Geospace (ERG) project to observe how high energy electrons behave high above the surface of our planet.
Dazzling curtains of light that shimmer over Earth's poles have captured our imagination since prehistoric times, and the fundamental processes behind the eerie glow of the aurora borealis and aurora australis – the northern and southern lights – are fairly well known.
Charged particles, spat out of the Sun by coronal mass ejections and other solar phenomena, wash over our planet in waves. As they hit Earth's magnetic field, most of the particles are deflected around the globe. Some are funnelled down towards the poles, where they smash into the gases making up our atmosphere and cause them to glow in sheets of dazzling greens, blues, and reds.
Those are typically called active auroras, and are often photographed to make up the gorgeous curtains we put onto calendars and desktop wallpapers.
But pulsating auroras are a little different.
Rather than shimmer as a curtain of light, they grow and fade over tens of seconds like slow lightning. They also tend to form higher up than their active cousins at the poles and closer to the equator, making them harder to study.
This kind of aurora is thought to be caused by sudden rearrangements in the magnetic field lines releasing their stored solar energy, sending showers of electrons crashing into the atmosphere in cycles of brightening called aurora substorms.
"They are characterised by auroral brightening from dusk to midnight, followed by violent motions of distinct auroral arcs that eventually break up, and emerge as diffuse, pulsating auroral patches at dawn," lead author Satoshi Kasahara from the University of Tokyo explains in their report.
Confirming specific changes in magnetic field are truly responsible for these waves of electrons isn't easy. For one thing, mapping the magnetic field lines with precision requires putting equipment into the right place at the right time in order to track charged particles trapped within them.
While the rearrangements of the magnetic field seem likely, there's still the question of whether there's enough electrons in these surges to account for the pulsating auroras.
This latest study has now put that question to rest.
The researchers directly observed the scattering of electrons produced by shifts in channelled currents of charged particles, or plasma, called chorus waves.
Electron bursts have been linked with chorus waves before, with previous research spotting electron showers that coincide with the 'whistling' tunes of these shifting plasma currents. But now they knew the resulting eruption of charged particles could do the trick.
"The precipitating electron flux was sufficiently intense to generate pulsating aurora," says Kasahara.
The clip below does a nice job of explaining the research using neat visuals. Complete with a wicked thumping dance beat.
The next step for the researchers is to use the ERG spacecraft to comprehensively analyse the nature of these electron bursts in conjunction with phenomena such as auroras.
These amazing light shows are spectacular to watch, but they also have a darker side.
Those light showers of particles can turn into storms under the right conditions. While they're harmless enough high overhead, a sufficiently powerful solar storm can cause charged particles to disrupt electronics in satellites and devices closer to the surface.
Just last year the largest flare to erupt from the Sun in over a decade temporarily knocked out high frequency radio and disrupted low-frequency navigation technology.
Getting a grip on what's between us and the Sun might help us plan better when even bigger storms strike.
This research was published in Nature.
https://www.sciencealert.com/pulsating-aurora-northern-lights-electron-microbursts
___________________________
Torsion: The Key to the Theory of Everything
March 5, 2012
https://blog.world-mysteries.com/science/torsion-the-key-to-theory-of-everything/
___________________________
Relativistic Electron Microbursts as High-Energy Tail of Pulsating Aurora Electrons
23 APR 2021
Abstract
In this study, by simulating the wave-particle interactions, we show that subrelativistic/relativistic electron microbursts form the high-energy tail of pulsating aurora (PsA). Whistler-mode chorus waves that propagate along the magnetic field lines at high latitudes cause precipitation bursts of electrons with a wide energy range from a few kiloelectron volts (PsA) to several megaelectron volts (relativistic microbursts). The rising tone elements of chorus waves cause individual microbursts of subrelativistic/relativistic electrons and the internal modulation of PsA with a frequency of a few hertz. The chorus bursts for a few seconds cause the microburst trains of subrelativistic/relativistic electrons and the main pulsations of PsA. Our simulation studies demonstrate that both PsA and relativistic electron microbursts originate simultaneously from pitch angle scattering by chorus wave-particle interactions along the field line.
Key Points
- We demonstrate that subrelativistic/relativistic electron microbursts are the high-energy tail of pulsating aurora electrons
- Our simulation studies demonstrate that both pulsating aurora and relativistic electron microbursts originate simultaneously
- Pulsating aurora electron and relativistic electron microbursts are the same product of chorus wave-particle interactions
Plain Language Summary
Pulsating aurora electron and relativistic electron microbursts are precipitation bursts of electrons from the magnetosphere to the thermosphere and the mesosphere with energies ranging from a few kiloelectron volts to tens of kiloelectron volts and subrelativistic/relativistic, respectively. Our computer simulation shows that pulsating aurora electron (low energy) and relativistic electron microbursts (relativistic energy) are the same product of chorus wave-particle interactions, and relativistic electron microbursts are high-energy tail of pulsating aurora electrons. The relativistic electron microbursts contribute to significant loss of the outer belt electrons, and our results suggest that the pulsating aurora activity can be often used as a proxy of the radiation belt flux variations.
https://agupubs.onlinelibrary.wiley.com/doi/full/10.1029/2020GL090360
___________________________
Microbursts of the UV atmospheric emission in the auroral zone
2024
___________________________
7 Things You Should Know About Microbursts
05/11/2024
1) Microbursts start with a cumulonimbus cloud
While microbursts can form from airmass storms and squall lines, single-cell storms seem to produce most of them.
2) Next up, heavy precipitation
Microbursts start when heavy precipitation falls from a cloud. As the rain falls, it starts pulling air down with it. At the same time, the air starts evaporating the rain, which cools the air even more. Since the cooler air is more dense than the warm air around it, it descends even faster, forming a microburst.

3) There are two types: dry and wet microbursts
Dry microbursts are the most common type. With a dry microburst, all of the precipitation evaporates before the column of descending air reaches the ground. This makes them particularly dangerous, because they can be hard to see.
Wet microbursts, as you probably guessed, contain liquid precip when they hit the ground.
4) When they hit the ground, look out
When a microburst hits the ground (at up to 6,000 FPM, by the way), it spreads out, creating a vortex ring around the outside of the microburst.

5) Next comes the low level wind shear
This is where microbursts are really dangerous. If you fly through one, you'll initially have increased performance. But as you enter the microburst, your headwind rapidly switches to a tailwind, causing you to sink. If you're close to the ground, you may not have enough climb performance to fly out of the microburst before you hit the ground. And that would make for a very bad day.

6) Rule of thumb: the total shear is double the peak wind
If the outflow speed of a microburst is 30 knots, you'll experience 60 knots of shear as you cross the microburst. And it all can happen in a very short period of time. Think about what would happen to your Cessna 172 if you went from 100 knots to 40 knots in the matter of a few seconds...
7) So how do you avoid them?
How do you avoid a microburst? Don't fly underneath storms, visible virga shafts, or rain shafts. Microbursts don't last long, but they can be extremely dangerous, even while they're dissipating. The best option is always to steer clear and divert around them.
https://www.boldmethod.com/blog/lists/2024/05/7-things-you-need-to-know-about-microbursts/
___________________________
Discovery of Microbursts Leads to Safer Air Travel
During a storm, powerful downdrafts of air can form, blasting towards the Earth with explosive force. Microbursts--drafts only several hundred yards wide--can gust at speeds approaching 150 miles per hour, and can be particularly dangerous for aircraft that are taking off or landing. Before the introduction of Doppler radar weather-detection systems at airports, scientists estimate that microbursts caused as many as 20 major airline accidents, resulting in over 500 deaths.
https://www.nsf.gov/news/discovery-microbursts-leads-safer-air-travel
___________________________
Meteorology: Understanding Microbursts
11 November, 2015
https://xcmag.com/magazine-articles/understanding-microbursts-meteorology-column-from-issue-163/
___________________________
Microbursts & Gliding, Part V
September 15, 2022
https://wingsandwheels.com/blog/post/microbursts-and-gliding-part-v
___________________________
Why Don’t Planes Fly over Antarctica?
1. Weather Conditions
2. A Lack of Visibility
3. A Lack of Infrastructure
4. Navigation and Other Concerns
https://aerocorner.com/blog/planes-over-antarctica/
___________________________
Flying Over Antarctica: Why Planes Avoid the Region
February 28, 2025
https://thevistavoice.com/flying-over-antarctica-why-planes-avoid-the-region/
___________________________
Pilot reveals why commercial planes don't fly over Antarctica – and it's not illegal
Jan 31, 2025
https://www.express.co.uk/news/weird/2006561/pilot-planes-artarctica-flights
___________________________
Paragliding Safety: How to Avoid the Rotor (Mount Caburn)
Dec 13, 2013
https://www.youtube.com/watch?v=cdFqaFAfbpw
___________________________
The Lee and Rotor
The lee, short for leeward, is the backside, opposite the windward side of an object. The term lee-side and “rotor zone” may be used interchangeably. Both terms refer to areas behind an object which is obstructing the wind flow. As the speed of the wind and roughness of the obstruction increases, so does the amount and intensity of the turbulence. If the wind speed is relatively low and/or the terrain is smooth or rounded, the level of turbulence will be relatively low. Conversely, if the winds are high and/or the terrain is rough, such as a sharp ridge or mountain, the level of turbulence in the lee will be high. You may hear pilots talk about flying in the lee, but you should understand the serious risk involved before attempting it yourself. Thermals in the lee side are protected from the wind and have a chance to build, but when they do release, they are pushing up into an air mass that is moving horizontally, which may create severe turbulence and shear. Also, if you fly into this area looking for lee-side thermals, you are flying into an area of mechanical turbulence.
Rotor is the reason it’s imperative for you to know the direction of the winds around you, as well as the wind at the surface. Knowing the direction and speed of the forecasted winds will keep you from launching into lee-side conditions, or flying into rotor at some point during your flight. When flying in the mountains, be especially cautious, around ridges and valleys, the opportunities for encountering rotor are greatly increased. It is easy to get wind forecasts from weather sources and/or by watching the drift of the clouds, so there is no excuse for being unaware.
___________________________
Vortex shedding
https://en.wikipedia.org/wiki/Vortex_shedding
In fluid dynamics, vortex shedding is an oscillating flow that takes place when a fluid such as air or water flows past a bluff (as opposed to streamlined) body at certain velocities, depending on the size and shape of the body. In this flow, vortices are created at the back of the body and detach periodically from either side of the body forming a Kármán vortex street. The fluid flow past the object creates alternating low-pressure vortices on the downstream side of the object. The object will tend to move toward the low-pressure zone.
If the bluff structure is not mounted rigidly and the frequency of vortex shedding matches the resonance frequency of the structure, then the structure can begin to resonate, vibrating with harmonic oscillations driven by the energy of the flow. This vibration is the cause for overhead power line wires humming in the wind,[1] and for the fluttering of automobile whip radio antennas at some speeds. Tall chimneys constructed of thin-walled steel tubes can be sufficiently flexible that, in air flow with a speed in the critical range, vortex shedding can drive the chimney into violent oscillations that can damage or destroy the chimney.
Vortex shedding was one of the causes proposed for the failure of the original Tacoma Narrows Bridge (Galloping Gertie) in 1940, but was rejected because the frequency of the vortex shedding did not match that of the bridge. The bridge actually failed by aeroelastic flutter.[2]
A thrill ride, "VertiGo" at Cedar Point in Sandusky, Ohio suffered vortex shedding during the winter of 2001, causing one of the three towers to collapse. The ride was closed for the winter at the time.[3] In northeastern Iran, the Hashemi-Nejad natural gas refinery's flare stacks suffered vortex shedding seven times from 1975 to 2003. Some simulation and analyses were done, which revealed that the main cause was the interaction of the pilot flame and flare stack. The problem was solved by removing the pilot.

Vortex shedding behind a circular cylinder. In this animation, the flows on the two sides of the cylinder are shown in different colors, to show that the vortices from the two sides alternate.

Vortex shedding as winds pass Heard Island (bottom left) in the southern Indian Ocean resulted in this Kármán vortex street in the clouds
___________________________
Kármán vortex street
In fluid dynamics, a Kármán vortex street (or a von Kármán vortex street) is a repeating pattern of swirling vortices, caused by a process known as vortex shedding, which is responsible for the unsteady separation of flow of a fluid around blunt bodies.[1]
It is named after the engineer and fluid dynamicist Theodore von Kármán,[2] and is responsible for such phenomena as the "singing" of suspended telephone or power lines and the vibration of a car antenna at certain speeds. Mathematical modeling of von Kármán vortex street can be performed using different techniques including but not limited to solving the full Navier-Stokes equations with k-epsilon, SST, k-omega and Reynolds stress, and large eddy simulation (LES) turbulence models,[3][4] by numerically solving some dynamic equations such as the Ginzburg–Landau equation,[5][6][7] or by use of a bicomplex variable.

Visualisation of the vortex street behind a circular cylinder in air (on the left); the flow is made visible through release of glycerol vapour in the air near the cylinder

Kármán vortex street caused by wind flowing around the Juan Fernández Islands off the Chilean coast (left), and a satellite loop of Von Kármán vortices near Socorro Island (right).
https://en.wikipedia.org/wiki/K%C3%A1rm%C3%A1n_vortex_street
___________________________
Venturi effect
The Venturi effect is the reduction in fluid pressure that results when a moving fluid speeds up as it flows from one section of a pipe to a smaller section. The Venturi effect is named after its discoverer, the Italian physicist Giovanni Battista Venturi, and was first published in 1797.
The effect has various engineering applications, as the reduction in pressure inside the constriction can be used both for measuring the fluid flow and for moving other fluids (e.g. in a vacuum ejector).

Idealized flow in a Venturi tube
https://en.wikipedia.org/wiki/Venturi_effect
___________________________
Changes in Antarctic temperature, wind and precipitation in response to the Antarctic Oscillation
14 September 2017
Abstract
Output of a 14 year integration with a high-resolution (55 km ×55 km) regional atmospheric climate model is used to study the response of Antarctic near-surface climate to the Antarctic Oscillation (AAO), the periodical strengthening and weakening of the circumpolar vortex in the Southern Hemisphere. In spite of the relatively short record, wind, temperature and precipitation show widespread and significant AAO-related signals. When the vortex is strong (high AAO index), northwesterly flow anomalies cause warming over the Antarctic Peninsula (AP) and adjacent regions in West Antarctica and the Weddell Sea. In contrast, cooling occurs in East Antarctica, the eastern Ross Ice Shelf and parts of Marie Byrd Land. Most of the annual temperature signal stems from the months March–August. The spatial distribution of the precipitation response to changes in the AAO does not mirror temperature changes but is in first order determined by the direction of flow anomalies with respect to the Antarctic topography. When the vortex is strong (high AAO index), the western AP becomes wetter, while the Ross Ice Shelf, parts of West Antarctica and the Lambert Glacier basin, East Antarctica, become drier.
___________________________
10 Most Unpredictable Weather Phenomena
January 2, 2025
Supercells
Supercells are the giants of the storm world, commanding respect and caution from both meteorologists and storm chasers alike. These massive, swirling thunderstorms are capable of producing severe weather that can leave a trail of devastation in their wake. What makes supercells particularly daunting is their erratic nature. They can escalate rapidly, shifting from a benign cloud cluster to a full-blown storm with alarming speed. This unpredictability often leaves meteorologists scrambling to provide timely warnings. Within these colossal storms, conditions can be ripe for the formation of tornadoes, golf-ball-sized hail, and flash floods. Each minute with a supercell feels like walking on a tightrope—one wrong step, and everything changes.
Tornadoes
Heat Bursts
Volcanic Lightning (Dirty Thunderstorms)
Volcanic lightning, also enchantingly referred to as “dirty thunderstorms,” is as mesmerizing as it is enigmatic. When a volcano erupts, it spews forth ash and particles into the atmosphere. These particulates can lead to the creation of static electricity, resulting in captivating lightning storms that illuminate the volcanic plume. The artwork painted by these electrical discharges against the darkened sky is nothing short of magical. Given the chaotic nature of volcanic activities and the conditions needed for electrical charges to accumulate, predicting these thunderstorms is extremely challenging. Despite their unpredictability, they offer a visual spectacle that photographers and scientists alike eagerly await.
Microbursts
Microbursts are like the “microwave bursts” of the weather world—intense, brief, and potentially destructive. These downbursts of wind occur when cold air descends swiftly during a thunderstorm, emitting high-speed winds upon impact with the ground. They can flatten trees and buildings in seconds and are especially perilous for aviation. Pilots dread the thought of encountering a microburst, as it can severely affect an aircraft’s lift, sometimes with disastrous consequences. One moment, the sky may seem calm, and the next, the air is whipping with intense force. It’s this sudden and localized destruction that keeps microbursts high on the list of unpredictable weather phenomena.
Polar Vortex Disruptions
The polar vortex is traditionally confined to the arctic regions, swirling with icy air. However, its boundaries are not always stable. When the vortex breaks apart, frigid air can spill southward, resulting in unexpected cold snaps in areas far from the poles. These disruptions are notorious for their unpredictability, transforming mild winters into brutally cold episodes. One day you might enjoy a sunny, crisp afternoon, and the next, you’re bundling up against bone-chilling winds. Such drastic shifts catch even the most prepared regions off guard, adding another layer of unpredictability to weather forecasting.
Haboobs (Dust Storms)
Haboobs, with their mysterious name and towering presence, paint a picture straight out of a desert scene. Massive walls of dust are stirred by collapsing thunderstorms, sweeping through arid regions with an ominous presence. The visual is cinematic, as these dust storms can reduce visibility to mere meters. What makes them particularly challenging to predict is their sudden onset and speed. One minute you’re basking in clear skies, and the next, you’re engulfed in a cloud of swirling dust. For travelers and residents in arid regions, the booth heralds caution and preparedness, a reminder of nature’s unpredictability.
Thundersnow
A weather marvel that fuses two seemingly opposing elements, thundersnow redefines what we know about winter storms. Picture a heavy snowstorm punctuated by dramatic flashes of lightning and rolls of thunder. As rare as it is surprising, thundersnow often accompanies intense winter storms. The conditions necessary for its formation are specific, making it a rarity, much like a blue moon. It’s not just the visual spectacle that captures attention—the eerie combination of snow muffling the landscape, contrasted with the roaring thunder, creates an unforgettable experience. For weather enthusiasts, witnessing thundersnow is akin to spotting a mythical creature.
Waterspouts
Cousins to tornadoes, waterspouts are swirling columns of air and water rising over oceans or lakes. While they appear less menacing than their terrestrial counterparts, their formation can be just as unpredictable. One moment the water is calm, and the next, a spout may form, twisting its way upward. They can pose serious threats to marine vessels and coastal areas, as their movements are hard to forecast. Waterspouts often dissipate without incident, yet their sudden appearance keeps mariners on their toes. While encounters with these swirling phenomena can make for thrilling tales, they are best observed from a safe distance.
Ball Lightning
Ball lightning is one of the most mystifying phenomena, fascinating scientists and curious minds alike. Imagine glowing spheres of light, floating through the air during a thunderstorm, defying explanation and capturing our imagination. Unlike typical lightning that zigzags across the sky, ball lightning is much more elusive, with no clear path or behavior. Their appearance can last from mere seconds to several minutes, leaving some to question if what they witnessed was real. Despite years of research, ball lightning remains one of the least understood weather occurrences, adding an element of mystery to storms. Witness stories often border on the incredulous, with ball lightning sometimes seen hovering outside windows or floating harmlessly through homes.
https://www.msn.com/en-us/weather/meteorology/10-most-unpredictable-weather-phenomena/ar-AA1yeEVr
___________________________
A swarm of 85,000 earthquakes at the Antarctic Orca submarine volcano
Volcanoes can be found even off the coast of Antarctica. At the deep-sea volcano Orca, which has been inactive for a long time, a sequence of more than 85,000 earthquakes was registered in 2020, a swarm quake that reached proportions not previously observed for this region. The fact that such events can be studied and described in great detail even in such remote and therefore poorly instrumented areas is now shown by the study of an international team published in the journal “Communications Earth and Environment.” Led by Simone Cesca from the German Research Centre for Geosciences (GFZ) Potsdam, researchers from Germany, Italy, Poland and the United States were involved. With the combined application of seismological, geodetic and remote sensing techniques, they were able to determine how the rapid transfer of magma from the Earth’s mantle near the crust-mantle boundary to almost the surface led to the swarm quake.
The Orca volcano between the tip of South America and Antarctica
Swarm quakes mainly occur in volcanically active regions. The movement of fluids in the Earth’s crust is therefore suspected as the cause. Orca seamount is a large submarine shield volcano with a height of about 900 metres above the sea floor and a base diameter of about 11 kilometres. It is located in the Bransfield Strait, an ocean channel between the Antarctic Peninsula and the South Shetland Islands, southwest of the southern tip of Argentina.
“In the past, seismicity in this region was moderate. However, in August 2020, an intense seismic swarm began there, with more than 85,000 earthquakes within half a year. It represents the largest seismic unrest ever recorded there,” reports Simone Cesca, scientist in GFZ’s Section 2.1 Earthquake and Volcano Physics and lead author of the now published study. At the same time as the swarm, a lateral ground displacement of more than ten centimetres and a small uplift of about one centimetre was recorded on neighbouring King George Island.
___________________________
Chile earthquake fractured ice in Antarctica
11 August 2014
https://pubs.aip.org/physicstoday/Online/6426/Chile-earthquake-fractured-ice-in-Antarctica
___________________________
Antarctica Is Being Rumbled by Hidden Earthquakes We Never Even Knew Existed
05 June 2018
___________________________
Mantle convection and possible mantle plumes beneath Antarctica – insights from geodynamic models and implications for topography
9 September 2021
Abstract
https://www.lyellcollection.org/doi/abs/10.1144/M56-2020-2
___________________________
The Hunga Tonga-Hunga Ha'apai volcanic barometric pressure pulse and meteotsunami travel recorded in several Antarctic stations
2024
Abstract
The Hunga Tonga-Hunga/Hunga-Ha'apai eruption on January 15, 2022 sent off a plume of ash material up to the stratosphere and triggered a meteotsunami and barometric pressure pulse that rippled through the atmosphere and oceans all around the world. The nature of the volcanic event and its global impacts on the oceans, atmosphere, lithosphere and the cryosphere are a matter of debate. Here we present a first overview of the time travel of the sound atmospheric pressure wave through the Antarctic continent based on in situ measurements, which represented a unique event observed through the polar ice sheet during the instrumental meteorological era. In addition, we estimated the tsunami travel time of the Hunga-Tonga event from a first order model to infer its impact over the Antarctic Sea ice and ice shelves. One outcome from our observations and modeling is the detection of the meteotsunami in the Antarctic Peninsula and the impact of the continental relief over the atmospheric pressure wave dispersion.
https://pubmed.ncbi.nlm.nih.gov/39607102/
___________________________
Geochemical and visual indicators of hydrothermal fluid flow through a sediment-hosted volcanic ridge in the Central Bransfield Basin (Antarctica).
24 Jan 2013
https://europepmc.org/article/MED/23359806
___________________________
Tides regulate the flow and density of Antarctic Bottom Water from the western Ross Sea
08 March 2023
Abstract
Antarctic Bottom Water (AABW) stores heat and gases over decades to centuries after contact with the atmosphere during formation on the Antarctic shelf and subsequent flow into the global deep ocean. Dense water from the western Ross Sea, a primary source of AABW, shows changes in water properties and volume over the last few decades. Here we show, using multiple years of moored observations, that the density and speed of the outflow are consistent with a release from the Drygalski Trough controlled by the density in Terra Nova Bay (the “accelerator”) and the tidal mixing (the “brake”). We suggest tides create two peaks in density and flow each year at the equinoxes and could cause changes of ~ 30% in the flow and density over the 18.6-year lunar nodal tide. Based on our dynamic model, we find tides can explain much of the decadal variability in the outflow with longer-term changes likely driven by the density in Terra Nova Bay.
https://www.nature.com/articles/s41598-023-31008-w
___________________________
Last Interglacial subsurface warming on the Antarctic shelf triggered by reduced deep-ocean convection
20 April 2024
Abstract
'
The Antarctic ice-sheet could have contributed 3 to 5 m sea-level equivalent to the Last Interglacial sea-level highstand. Such an Antarctic ice-mass loss compared to pre-industrial requires a subsurface warming on the Antarctic shelf of ~ 3 °C according to ice-sheet modelling studies. Here we show that a substantial subsurface warming is simulated south of 60 °S in an equilibrium experiment of the Last Interglacial. It averages +1.2 °C at ~ 500 m depth from 70 °W to 160 °E, and it reaches +2.4 °C near the Lazarev Sea. Weaker deep-ocean convection due to reduced sea-ice formation is the primary driver of this warming. The associated changes in meridional density gradients and surface winds lead to a weakened Antarctic Circumpolar Current and strengthened Antarctic Slope Current, which further impact subsurface temperatures. A subsurface warming on the Antarctic shelf that could trigger ice-mass loss from the Antarctic ice-sheet can thus be obtained during warm periods from reduced sea-ice formation.
https://www.nature.com/articles/s43247-024-01383-x
___________________________
Deep Convection as the Key to the Transition From Eocene to Modern Antarctic Circumpolar Current
19 December 2023
Abstract
From the Eocene (∼50 million years ago) to today, Southern Ocean circulation has evolved from the existence of two ocean gyres to the dominance of the Antarctic Circumpolar Current (ACC). It has generally been thought that the opening of Southern Ocean gateways in the late Eocene, in addition to the alignment of westerly winds with these gateways or the presence of the Antarctic ice sheet, was a sufficient requirement for the transition to an ACC of similar strength to its modern equivalent. Nevertheless, models representing these changes produce a much weaker ACC. Here we show, using an eddying ocean model, that the missing ingredient in the transition to a modern ACC is deep convection around the Antarctic continent. This deep convection is caused by cold temperatures and high salinities due to sea-ice production around the Antarctic continent, leading to both the formation of Antarctic Bottom Water and a modern-strength ACC.
https://agupubs.onlinelibrary.wiley.com/doi/full/10.1029/2023GL104847
___________________________
Antarctic sea ice multidecadal variability triggered by Southern Annular Mode and deep convection
08 November 2024
Abstract
Antarctic sea ice exerts great influence on Earth’s climate by controlling the exchange of heat, momentum, freshwater, and gases between the atmosphere and ocean. Antarctic sea ice extent has undergone a multidecadal slight increase followed by a substantial decline since 2016. Here we utilize a 300-yr sea ice data assimilation reconstruction and two NOAA/GFDL and five CMIP6 model simulations to demonstrate a multidecadal variability of Antarctic sea ice extent. Stronger westerlies associated with the Southern Annular Mode (SAM) enhance the upwelling of warm and saline water from the subsurface ocean. The consequent salinity increase weakens the upper-ocean stratification, induces deep convection, and in turn brings more subsurface warm and saline water to the surface. This salinity-convection feedback triggered by the SAM provides favorable conditions for multidecadal sea ice decrease. Processes acting in reverse are found to cause sea ice increase, although it evolves slower than sea ice decrease.
Introduction
Antarctic sea ice (Fig. 1a) contributes to Earth’s climate through the exchange of heat, momentum, freshwater, and gases between the atmosphere and ocean. Antarctic sea ice extent (SIE) and its anomaly (Fig. 1b) show a slightly increasing trend in the past few decades1,2, but abruptly declines after 20163,4. The increasing SIE trend can be caused by various processes: (1) deepening of the Amundsen Sea Low5 driven by the Interdecadal Pacific Oscillation (IPO)6 and possibly linked to the Atlantic Meridional Overturning Circulation7, (2) intensification of westerlies associated with a positive trend of Southern Annular Mode (SAM) arising from stratospheric ozone depletion8,9 and increasing greenhouse gases10, although the role of ozone is debated11, (3) increased freshwater from basal melting of Antarctic ice shelves12, although the role of freshwater is also debated13,14,15, (4) enhanced upper-ocean stratification due to brine rejection associated with sea ice increase16, and (5) weakening of Southern Ocean deep convection17. The sea ice decrease in 2016 could have been caused by more poleward warm air advection accompanied by a negative phase of the SAM3 and atmospheric teleconnection from the tropics18. Since then, the persistence of low sea ice could have been related to the warmer upper Southern Ocean19,20,21. However, due to short observation records, it remains unclear what the relative roles were of natural variability and possibly climate change.
https://www.nature.com/articles/s43247-024-01783-z
___________________________
An Extreme High Temperature Event in Coastal East Antarctica Associated With an Atmospheric River and Record Summer Downslope Winds
03 February 2022
Abstract
High surface temperatures are important in Antarctica because of their role in ice melt and sea level rise. We investigate a high temperature event in December 1989 that gave record temperatures in coastal East Antarctica between 60° and 100°E. The high temperatures were associated with a pool of warm lower tropospheric air with December temperature anomalies of >14°C that developed in two stages over the Amery Ice Shelf. First, there was near-record poleward warm advection within an atmospheric river. Second, synoptically driven downslope flow from the interior reached unprecedented December strength over a large area, leading to strong descent and further warming in the coastal region. The coastal easterly winds were unusually deep and strong, and the warm pool was advected westwards, giving a short period of high temperatures at coastal locations, including a surface temperature of 9.3°C at Mawson, the second highest in its 66-year record.
https://agupubs.onlinelibrary.wiley.com/doi/full/10.1029/2021GL097108
___________________________
Intense atmospheric rivers can weaken ice shelf stability at the Antarctic Peninsula
14 April 2022
Abstract
The disintegration of the ice shelves along the Antarctic Peninsula have spurred much discussion on the various processes leading to their eventual dramatic collapse, but without a consensus on an atmospheric forcing that could connect these processes. Here, using an atmospheric river detection algorithm along with a regional climate model and satellite observations, we show that the most intense atmospheric rivers induce extremes in temperature, surface melt, sea-ice disintegration, or large swells that destabilize the ice shelves with 40% probability. This was observed during the collapses of the Larsen A and B ice shelves during the summers of 1995 and 2002 respectively. Overall, 60% of calving events from 2000–2020 were triggered by atmospheric rivers. The loss of the buttressing effect from these ice shelves leads to further continental ice loss and subsequent sea-level rise. Under future warming projections, the Larsen C ice shelf will be at-risk from the same processes.
https://www.nature.com/articles/s43247-022-00422-9
___________________________
Atmospheric rivers help create massive holes in Antarctic sea ice
November 11, 2020
https://phys.org/news/2020-11-atmospheric-rivers-massive-holes-antarctic.html
___________________________
Atmospheric river
An atmospheric river (AR) is a narrow corridor or filament of concentrated moisture in the atmosphere. Other names for this phenomenon are tropical plume, tropical connection, moisture plume, water vapor surge, and cloud band.
Atmospheric rivers consist of narrow bands of enhanced water vapor transport, typically along the boundaries between large areas of divergent surface air flow, including some frontal zones in association with extratropical cyclones that form over the oceans.[3][4][5][6] Pineapple Express storms are the most commonly represented and recognized type of atmospheric rivers; the name is due to the warm water vapor plumes originating over the Hawaiian tropics that follow various paths towards western North America, arriving at latitudes from California and the Pacific Northwest to British Columbia and even southeast Alaska.
https://en.wikipedia.org/wiki/Atmospheric_river
___________________________
Atmospheric rivers in Antarctica
February 2025
https://www.researchgate.net/publication/388869515_Atmospheric_rivers_in_Antarctica
___________________________
Climatology and surface impacts of atmospheric rivers on West Antarctica
___________________________
Shift in atmospheric rivers could affect Antarctic sea ice, glaciers
November 23, 2020
https://phys.org/news/2020-11-shift-atmospheric-rivers-affect-antarctic.html
___________________________
Stronger winds heat up West Antarctic ice melt
July 17, 2017
https://phys.org/news/2017-07-stronger-west-antarctic-ice.html
___________________________
Localized rapid warming of West Antarctic subsurface waters by remote winds
17 July 2017
https://www.nature.com/articles/nclimate3335
___________________________
Antarctic Atmospheric River Climatology and Precipitation Impacts
27 March 2021
Abstract
The Antarctic ice sheet (AIS) is sensitive to short-term extreme meteorological events that can leave long-term impacts on the continent's surface mass balance (SMB). We investigate the impacts of atmospheric rivers (ARs) on the AIS precipitation budget using an AR detection algorithm and a regional climate model (Modèle Atmosphérique Régional) from 1980 to 2018. While ARs and their associated extreme vapor transport are relatively rare events over Antarctic coastal regions (∼3 days per year), they have a significant impact on the precipitation climatology. ARs are responsible for at least 10% of total accumulated snowfall across East Antarctica (localized areas reaching 20%) and a majority of extreme precipitation events. Trends in AR annual frequency since 1980 are observed across parts of AIS, most notably an increasing trend in Dronning Maud Land; however, interannual variability in AR frequency is much larger. This AR behavior appears to drive a significant portion of annual snowfall trends across East Antarctica, while controlling the interannual variability of precipitation across most of the AIS. AR landfalls are most likely when the circumpolar jet is highly amplified during blocking conditions in the Southern Ocean. There is a fingerprint of the Southern Annular Mode (SAM) on AR variability in West Antarctica with SAM+ (SAM−) favoring increased AR frequency in the Antarctic Peninsula (Amundsen-Ross Sea coastline). Given the relatively large influence ARs have on precipitation across the continent, it is advantageous for future studies of moisture transport to Antarctica to consider an AR framework especially when considering future SMB changes.
Key Points
-
Atmospheric rivers in Antarctica are rare events but are a key contributor to the ice sheet's surface mass balance
-
Their impact on precipitation is most pronounced in East Antarctica where they are responsible for a majority of extreme precipitation events
-
Atmospheric rivers are contributing to modern snowfall trends and controlling overall precipitation variability across Antarctica
Plain Language Summary
The Antarctic continent, like many deserts in the world, receives a large percentage of its yearly precipitation from just a few intense precipitation events. Atmospheric rivers (ARs), narrow corridors of intense moisture transporting moisture from low to high latitudes, are commonly associated with heavy rain and snowfall in the midlatitudes like the west coasts of North/South America and Europe. In Antarctica, ARs are rarer with most near-coastal regions in Antarctica experiencing AR conditions a few days per year but still have a major influence on the surface mass balance of the ice sheet. ARs are responsible for 10%–20% of the total snowfall across East Antarctica. Although a modest percentage, this contribution to the snowfall budget is the component that has been driving parts of the positive annual snowfall trends in Dronning Maud and negative trends in Wilkes Land. Also, ARs control the year-to-year variability of precipitation across most of the ice sheet. Given the link between ARs and snowfall accumulation trends, increased future AR activity would result in higher snowfall accumulation on the Antarctic continent and possibly offset some sea-level rise from dynamic ice loss, but this must be considered in balance with increased melting frequency already documented with ARs.
https://agupubs.onlinelibrary.wiley.com/doi/10.1029/2020JD033788
___________________________
Atmospheric River Brings Warmth and Rainfall to the Northern Antarctic Peninsula During the Mid-Austral Winter of 2023
29 June 2024
https://agupubs.onlinelibrary.wiley.com/doi/10.1029/2024GL108391
___________________________
Strong Warming Over the Antarctic Peninsula During Combined Atmospheric River and Foehn Events: Contribution of Shortwave Radiation and Turbulence
04 August 2023
https://agupubs.onlinelibrary.wiley.com/doi/10.1029/2022JD038138
___________________________
West Antarctic surface melt triggered by atmospheric rivers
28 October 2019
https://www.nature.com/articles/s41561-019-0460-1
___________________________
Dry Ice: How Expanding Antarctic Sea Ice is Drying the Atmosphere Over the Southern Ocean
April 2, 2021
Lower Evaporation in Polar Regions May Impact Ocean Circulation and Global Climate
It may seem counterintuitive that Earth’s coldest, iciest places are actually some of the driest places on our planet. But Earth’s polar regions see significantly less evaporation – the conversion of liquid water on Earth’s surface into gaseous water vapor in our atmosphere -- than other parts of our world, largely due to the presence of sea ice. New NASA research using a sophisticated satellite instrument shows the Southern Ocean surrounding Antarctica has been evaporating less water to the atmosphere, with potential impacts on global ocean circulation and Earth’s climate.
Evaporation is a key part of the global water cycle, the process by which water circulates continuously between Earth’s surface (land and ocean) and the atmosphere. As the Sun heats up water from lakes, rivers and the ocean, the resulting water vapor condenses to form clouds and then returns to the surface as precipitation as rain and snow. About 85 percent of atmospheric water vapor evaporates from the surface of Earth’s ocean; with tropical regions having the highest levels of evaporation, due to their warm temperatures and close proximity to the ocean. Evaporation plays a key role in weather and climate. Less evaporation means less water vapor in the air, which can change precipitation patterns around the globe.
An evaporation blocker
The presence of sea ice completely changes the dynamics of evaporation, however. This layer of frozen ocean water covers much of the Arctic Ocean and Southern Ocean, with the extent and thickness changing seasonally due to temperatures. “You can think of sea ice as a blanket that covers the ocean, similar to when people put covers over their swimming pools to keep evaporation down,” said Eric Fetzer, project scientist for NASA’s Atmospheric Infrared Sounder (AIRS) instrument on NASA’s Aqua satellite. “So, when there’s a lot of sea ice, you just don’t get much evaporation.”
“The reason why we care about changing sea ice conditions in this region is because sea ice prohibits the interaction between the ocean and the atmosphere,” said Linette Boisvert, a research scientist at NASA’s Goddard Space Flight Center. “That can affect the water cycle, clouds, and precipitation patterns across the globe.”
Boisvert first became interested in the connection between sea ice and evaporation while working on her doctorate, when she used AIRS data to measure evaporation in the Arctic Ocean and the Greenland Ice Sheet. Inspired by this previous work, she decided to do a similar study in Antarctica. “We wanted to see if we could use AIRS to estimate evaporation from the Southern Ocean and Antarctic sea ice surfaces, using the same method and same data we’d used in the other studies,” she said.
Data from satellite instruments are extremely valuable in Antarctica, due to the region’s lack of ground observation data. “There just aren’t a lot of observations in the Southern Ocean, because it’s hard to get ships down there to take measurements,” said Boisvert.
AIRS was chosen for the study because of its ability to accurately chart temperature and humidity changes over both the Arctic Ocean and the Southern Ocean. The instrument is also a workhorse when it comes to “seeing through” cloud cover, which poses an obstacle to most instruments. To produce daily estimates of evaporation from the Southern Ocean, the study also used wind speeds from NASA’s Modern-Era Retrospective Analysis for Research and Applications (MERRA-2), a global modeled atmospheric data set.
The Southern Ocean's decreasing trend
The team’s findings revealed a decreasing trend in annual evaporation over most of the Southern Ocean for the study period 2003-2016. According to Boisvert, one possible reason for the decrease is that until a few years ago, Antarctic sea ice extent was increasing slightly (this contrasts with the Arctic, which has seen a consistent decline in sea ice extent since the late 1970s.) More sea ice would have insulated the ocean surface from the atmosphere and reduced evaporation. Since 2015, however, the Southern Ocean has actually seen a large decrease in sea ice cover. “If the trend of decreased sea ice continues, it will be interesting to see if that changes the evaporation,” said Boisvert.
Boisvert says the findings are important because if the rate of evaporation in polar regions decreases, it can potentially impact other elements of the climate process, such as ocean circulation.
The ocean circulation connection
Ocean circulation refers to the large-scale movement of water that transports heat around the planet via surface and deep ocean currents. While surface currents are easy to visualize because they’re triggered by winds, deep ocean currents are like invisible forces that work behind the scenes, driven by water density.
When ocean water evaporates, most of the salt is left behind; hence, more evaporation means saltier water. Because salt water is more dense than fresh water, it tends to sink. “Evaporation really matters in certain polar regions, because by evaporating water from the surface, you actually make the ocean saltier,” said Fetzer. “You’re basically concentrating salt in the ocean, and that heavy salt water then sinks.”
Fresh water freezes at 32 degrees Fahrenheit, but seawater freezes at approximately 28.4 degrees Fahrenheit. So when the more dense, salty water sinks, the fresher water left at the surface can freeze more easily. “Evaporation affects whether and how sea ice forms, and conversely, evaporation is modulated by sea ice,” said Fetzer. “So, you have this interplay between evaporation and sea ice formation, and it all ties into the ocean circulation around Antarctica.”
The Ross Sea's increasing trend
While the results showed that evaporation decreased in most of the Southern Ocean, the study also revealed an increase in evaporation in the Ross Sea, which is adjacent to an ice shelf that spawns strong katabatic winds (cold and dry winds that blow downslope from higher elevations). “There is less sea ice coverage in that area, due to these katabatic winds which force the sea ice way from the ice shelf, and when the wind blows over this area of open water in the Ross Sea, you get a lot of evaporation occurring there,” said Boisvert. Her next step, she said, is to look specifically at this increase in the Ross Sea area, and AIRS data will again be an integral part of the study.
“People don’t really use AIRS too much in the polar regions—it’s used more widely in the mid-latitudes,” she said. “But being able to use these satellite-derived datasets to estimate evaporation at the poles can give us lots of insight into what’s going on in those regions.”
“In the global evaporation picture, the polar regions are not all that important because there is so much evaporation happening in the tropics. But locally, it matters a lot,” said Fetzer. “By changing sea ice and evaporation in the polar regions, you can actually change the entire deep ocean circulation, sea ice formation and local cloud cover, and that could have a big effect on climate.”
https://airs.jpl.nasa.gov/news/180/dry-ice-how-expanding-antarctic-sea-ice-is-drying-the-atmosphere-over-the-southern-ocean/
___________________________
Rising atmospheric moisture escalates the future impact of atmospheric rivers in the Antarctic climate system
14 May 2025
https://www.nature.com/articles/s43247-025-02333-x
___________________________
Sea level rise from West Antarctic mass loss significantly modified by large snowfall anomalies
17 March 2023
https://www.nature.com/articles/s41467-023-36990-3
___________________________
Atmospheric Response to Antarctic Sea-Ice Reductions Drives Ice Sheet Surface Mass Balance Increases
2023
https://journals.ametsoc.org/view/journals/clim/36/19/JCLI-D-23-0056.1.xml
___________________________
Climate data guide content with tag Sea Level Pressure
Years of record
- to
https://climatedataguide.ucar.edu/variables/atmosphere/sea-level-pressure
___________________________
Warmer Antarctic summers in recent decades linked to earlier stratospheric final warming occurrences
24 January 2024
Abstract
Since the 2000s, the pause of the strong Antarctic cooling and later stratospheric final warming onset trends has been identified. Here we employ composite and congruence analysis using reanalysis and in-situ data to propose a linkage between pivotal changes in the surface temperature trends and the timing of stratospheric final warming events. In early stratospheric final warming events, the positive polar cap height anomaly developed in the stratosphere in early October, descending to the troposphere and surface in late spring and summer, resulting in high-pressure anomalies, which led to warmer surfaces in most of Antarctica. In late stratospheric final warming occurrences, opposing or weaker behaviors were observed. The trend toward earlier stratospheric final warming appears to play a considerable role in warmer summers over parts of interior Antarctica through the strengthening of the anti-cyclonic surface pressure anomaly. This could influence the regional sea-ice modulation over the Southern Ocean.
https://www.nature.com/articles/s43247-024-01221-0
___________________________
A twentieth century perspective on summer Antarctic pressure change and variability and contributions from tropical SSTs and ozone depletion
06 October 2017
https://agupubs.onlinelibrary.wiley.com/doi/full/10.1002/2017GL075079
___________________________
Antarctic Seasonal Pressure Reconstructions 1905-2013
https://climatedataguide.ucar.edu/climate-data/antarctic-seasonal-pressure-reconstructions-1905-2013
___________________________
Antarctic Barometric Pressure
10 April 1913
https://www.nature.com/articles/091135a0
___________________________
Atmospheric surface pressure over the interior of Antarctica
12 May 2004
___________________________
An assessment of recent global atmospheric reanalyses for Antarctic near surface air temperature
2019
https://www.sciencedirect.com/science/article/abs/pii/S016980951930016X
___________________________
Antarctic ice mass variations from 1979 to 2017 driven by anomalous precipitation accumulation
23 November 2020
https://www.nature.com/articles/s41598-020-77403-5
___________________________
Powerful 'rivers in the sky' could cause Antarctic Peninsula's biggest ice shelf to collapse
April 14, 2022
When
temperatures in Antarctica soared to 38 degrees Celsius above normal --
around 70 Fahrenheit -- in March, a teetering ice shelf the size of Los
Angeles collapsed. Scientists don't know what role the extreme
temperatures may have played in the event, but the heat rushed in
through what's known as an atmospheric river, a long plume of moisture
that transports warm air and water vapor from the tropics to other parts
of the Earth.
A new study published Thursday shows that these
"rivers in the sky" -- which dump rain and snow when they make landfall
-- are also causing extreme temperatures, surface melt, sea-ice
disintegration and large ocean swells which are destabilizing ice
shelves on the Antarctic Peninsula, a long, spindly mountain chain that
points northwards to the tip of South America.
These conditions were
observed during the collapse of two of the peninsula's ice shelves --
Larsen A and B -- in the summers of 1995 and 2002, respectively. And
now, as the climate crisis is projected to warm the Earth further, the
biggest remaining ice shelf, Larsen C, is also at risk of total
collapse, the study says.
The authors of the study, published in
the Nature journal Communications Earth & Environment, used
algorithms, climate models and satellite observations to determine that
60% of the peninsula's calving events -- where an iceberg breaks off an
ice shelf or glacier -- were triggered by atmospheric rivers between
2000 and 2020.
https://www.cnn.com/2022/04/14/world/antarctica-larsen-c-ice-shelf-atmospheric-rivers-climate-intl/index.html
___________________________
Convection in the antarctic ice sheet leading to a surge of the ice sheet and possibly to a new ice age
1970
Abstract
The Antarctic surge theory of Pleistocene glaciation is reexamined in the context of thermal convection theory applied to the Antarctic ice sheet. The ice sheet surges when a water layer at the base of the ice sheet reaches the edge of the ice sheet over broad fronts and has a thickness sufficient to drown the projections from the bed that most strongly hinder basal ice flow. Frictional heat from convection flow promotes basal melting, and, as the ice sheet grows to the continental shelf of Antarctica, a surge of the ice sheet appears likely.
https://pubmed.ncbi.nlm.nih.gov/17799300/
___________________________
Southern Ocean deep convection as a driver of Antarctic warming events
20 February 2016
Abstract
Simulations with a free-running coupled climate model show that heat release associated with Southern Ocean deep convection variability can drive centennial-scale Antarctic temperature variations of up to 2.0°C. The mechanism involves three steps: Preconditioning: heat accumulates at depth in the Southern Ocean; Convection onset: wind and/or sea ice changes tip the buoyantly unstable system into the convective state; and Antarctic warming: fast sea ice-albedo feedbacks (on annual-decadal time scales) and slow Southern Ocean frontal and sea surface temperature adjustments to convective heat release (on multidecadal-century time scales) drive an increase in atmospheric heat and moisture transport toward Antarctica. We discuss the potential of this mechanism to help drive and amplify climate variability as observed in Antarctic ice core records.
Key Points
- Southern Ocean deep convection events can explain up to 2.0°C warming in Antarctica
- Ocean adjustments to buoyancy loss causes an approximately 50 year lag in the Antarctic temperature response
- Southward atmospheric heat flux anomalies propagate the warming signal to Antarctica
1. Introduction
Deep waters rising to the surface along isopycnals in the Southern Ocean (SO) exchange heat and carbon with the global atmosphere [Rintoul and Naveira Garabato, 2013]. Intense cooling, sea ice production, and wind-driven advection at the SO surface then return these waters to deep and intermediate depths, closing the SO overturning circulation, and connecting the atmosphere with the ocean interior [Marshall and Speer, 2012]. It is estimated that ~75% of the ocean store of anthropogenic heat and ~40% of the store of anthropogenic carbon enter the ocean interior through this region [Roemmich et al., 2015; Frölicher et al., 2015]. It follows that past changes in SO overturning could be an important driver of climate variability in Antarctica and the southern high latitudes [e.g., Latif et al., 2013; Menviel et al., 2015].
The dominant mode of deep water production in the modern SO is via brine rejection during sea ice formation on the Antarctic continental shelves [Rintoul and Naveira Garabato, 2013]. A second mode, involving deep convection in the open ocean, has also been documented [e.g., Gordon, 1991]. In 1974 when the first satellite microwave data were obtained from the Antarctic sea ice zone, a 250,000 km2 open ocean polynya was observed in the winter sea ice pack of the Weddell Sea [Carsey, 1980]. The ocean mixed layer in the polynya extended to 3000 m depth, with strong upwelling of relatively warm (with respect to the surface) deep waters, supporting an average winter surface heat flux of 136 Wm−2 [Gordon, 1982]. An estimated 2–3 Sv (1 sverdrup = 106 m3 s−1) of dense bottom water was produced in the polynya from the intense surface cooling and subsequent deep sinking [Gordon, 1982]. Although initially thought to be a permanent feature, the polynya closed after 3 years, and no open ocean deep convection beyond isolated events lasting some weeks has not been observed since [Gordon, 2014].
While clearly rare in the modern SO, open ocean deep convection may have been more common in the past. Two thirds of Intergovernmental Panel on Climate Change class global climate models show open ocean deep convection under preindustrial boundary conditions; the convection shuts down in most of these models in the 21st century due to anthropogenic freshening of SO surface layers [de Lavergne et al., 2014]. Gordon [2014] argues that deep convection was more common in the past and was potentially the dominant mode of SO deep water formation during the glacial when the ice sheets advanced over the Antarctic continental shelf [Golledge et al., 2013], capping the dominant sites of today's deep water formation in the coastal polynyas. The presence of SO deep convection in both observations and climate models raises questions about the possible climate impacts of shifts between the convective and nonconvective modes.
https://agupubs.onlinelibrary.wiley.com/doi/10.1002/2016GL067861
___________________________
Currents and convection cause enhanced gas exchange in the ice–water boundary layer
05 Jul 2016
Abstract
The presence of sea ice acts as a physical barrier for air–sea exchange. On the other hand it creates additional turbulence due to current shear and convection during ice formation. We present results from a laboratory study that demonstrate how shear and convection in the ice–ocean boundary layer can lead to significant gas exchange. In the absence of wind, water currents beneath the ice of 0.23 m s−1 produced a gas transfer velocity (k) of 2.8 m d−1, equivalent to k produced by a wind speed of 7 m s−1 over the open ocean. Convection caused by air–sea heat exchange also increased k of as much as 131 % compared to k produced by current shear alone. When wind and currents were combined, k increased, up to 7.6 m d−1, greater than k produced by wind or currents alone, but gas exchange forcing by wind produced mixed results in these experiments. As an aggregate, these experiments indicate that using a wind speed parametrisation to estimate k in the sea ice zone may underestimate k by ca. 50 % for wind speeds <8 m s−1.
https://www.tandfonline.com/doi/full/10.3402/tellusb.v68.32803
___________________________
Role of the Antarctic Circumpolar Circulation in Current Asymmetric Arctic and Antarctic Warming
07 July 2024
https://agupubs.onlinelibrary.wiley.com/doi/full/10.1029/2024GL110265
___________________________
Antarctic Circumpolar Current
Antarctic Circumpolar Current (ACC) is an ocean current that flows clockwise (as seen from the South Pole) from west to east around Antarctica. An alternative name for the ACC is the West Wind Drift. The ACC is the dominant circulation feature of the Southern Ocean and has a mean transport estimated at 137 ± 7 Sverdrups (Sv, million m3/s),[1][2] or possibly even higher,[3] making it the largest ocean current. The current is circumpolar due to the lack of any landmass connecting with Antarctica and this keeps warm ocean waters away from Antarctica, enabling that continent to maintain its huge ice sheet.
https://en.wikipedia.org/wiki/Antarctic_Circumpolar_Current
___________________________
Impacts of Strengthened Antarctic Circumpolar Current on the Seasonality of Arctic Climate
13 March 2025
https://agupubs.onlinelibrary.wiley.com/doi/full/10.1029/2025GL115211
___________________________
Antarctic circumpolar current's role in the Antarctic ice system: An overview
2011
https://www.sciencedirect.com/science/article/abs/pii/S0031018211001799
___________________________
Melting Antarctic ice sheets are slowing Earth's strongest ocean current, research reveals
March 3, 2025
https://phys.org/news/2025-02-antarctic-ice-sheets-earth-strongest.html
___________________________
Antarctica has its own ‘shield’ against warm water – but this could now be under threat
May 23, 2025
A little-known ocean current surrounds Antarctica, shielding it from warm water further north. But our new research shows Antarctica’s melting ice is disrupting this current, putting the continent’s last line of defence at risk.
We found meltwater from Antarctica is speeding up the current, known as the Antarctic Slope Current. And it’s set to become even faster by mid-century.
A faster current could be more unstable. This means eddies of warm water could eat away at Antarctica’s ice, posing a major concern for the stability of the Earth’s climate system.
Faster ice-melt means faster sea-level rise. Humanity must act now to preserve this natural phenomena that helps Antarctica’s ice shelves remain intact.
Melting of Antarctic ice has global consequences
Antarctica is melting as the world warms. This causes sea levels to rise. Even just a few centimetres of sea-level rise can double the chance of flooding in vulnerable coastal regions.
Previous research has shown meltwater is also slowing the global network of deep ocean currents. These currents transport water, heat and nutrients around the planet, so a global slow-down has huge ramifications.
It’s therefore crucial to reduce further loss of Antarctic ice, to stabilise our global climate system.
The Antarctic Slope Current moves ocean water westward over the continental slope, close to the coast. It acts as a barrier, preventing warm waters from further north from reaching the ice.
In this way, the current provides an important line of defence keeping warmer water at bay. It doesn’t stop Antarctica from melting, because warming air temperatures still cause this. But it slows the process...
However, our research shows this defence is under threat.
___________________________
West Antarctic Ice Sheet Cloud Cover and Surface Radiation Budget from NASA A-Train Satellites
2017
https://www.jstor.org/stable/26388522
___________________________
Atmospheric blocking and temperatures in the Antarctic Peninsula
2024
https://www.sciencedirect.com/science/article/abs/pii/S0048969724029991
___________________________
Antarctic currents supplying 40% of world's deep ocean with nutrients and oxygen slowing dramatically
May 25, 2023
These deep ocean tides supply almost half of the world's oceans with vital nutrients and oxygen, but melting ice shelves are slowing them down.
Deep ocean currents around Antarctica that are vital to marine life have slowed by 30% since the 1990s and could soon grind to a complete halt, a new study finds.
These currents, known as Antarctic bottom waters, are powered by dense, cold water from the Antarctic continental shelf that sinks to depths below 10,000 feet (3,000 meters). The water then spreads north into the Pacific and eastern Indian oceans, fueling a network of currents called the global meridional overturning circulation and supplying 40% of the world's deep ocean with fresh nutrients and oxygen...
But warming global temperatures are unlocking large volumes of less-dense fresh water from the Antarctic ice shelves, slowing this circulation down.
"If the oceans had lungs, this would be one of them," Matthew England, a professor of ocean and climate dynamics at the University of New South Wales in Sydney, Australia who contributed to the research, said in a statement. Researchers in the U.K. and Australia collaborated in a study published in March in the journal Nature that predicted a 40% reduction in the strength of Antarctic bottom waters by 2050.
He also warned that the currents could eventually stop altogether. "We are talking about the possible long-term extinction of an iconic water mass," England said.
In a new study published Thursday (May 25) in the journal Nature Climate Change,
England and his colleagues say they have confirmed these predictions
with real life observations in the Australian Antarctic Basin, which
spans the polar waters between Australia and Antarctica.
___________________________
Five million years of Antarctic Circumpolar Current strength variability
27 March 2024
Abstract
The Antarctic Circumpolar Current (ACC) represents the world’s largest ocean-current system and affects global ocean circulation, climate and Antarctic ice-sheet stability1,2,3. Today, ACC dynamics are controlled by atmospheric forcing, oceanic density gradients and eddy activity4. Whereas palaeoceanographic reconstructions exhibit regional heterogeneity in ACC position and strength over Pleistocene glacial–interglacial cycles5,6,7,8, the long-term evolution of the ACC is poorly known. Here we document changes in ACC strength from sediment cores in the Pacific Southern Ocean. We find no linear long-term trend in ACC flow since 5.3 million years ago (Ma), in contrast to global cooling9 and increasing global ice volume10. Instead, we observe a reversal on a million-year timescale, from increasing ACC strength during Pliocene global cooling to a subsequent decrease with further Early Pleistocene cooling. This shift in the ACC regime coincided with a Southern Ocean reconfiguration that altered the sensitivity of the ACC to atmospheric and oceanic forcings11,12,13. We find ACC strength changes to be closely linked to 400,000-year eccentricity cycles, probably originating from modulation of precessional changes in the South Pacific jet stream linked to tropical Pacific temperature variability14. A persistent link between weaker ACC flow, equatorward-shifted opal deposition and reduced atmospheric CO2 during glacial periods first emerged during the Mid-Pleistocene Transition (MPT). The strongest ACC flow occurred during warmer-than-present intervals of the Plio-Pleistocene, providing evidence of potentially increasing ACC flow with future climate warming.
https://www.nature.com/articles/s41586-024-07143-3
___________________________
Strongest ocean current on Earth is speeding up and causing problems
03-31-2024
The Antarctic Circumpolar Current (ACC) is the most powerful current on Earth, encircling Antarctica and influencing the global climate.
Over the last few decades, observations show that it has been speeding up. Experts were uncertain whether this was a result of human-caused warming or a natural pattern.
However, scientists have discovered that this oceanic powerhouse is getting even stronger. What does this mean for our planet’s future?
Ocean depths
An international team of researchers embarked on a daring expedition to remote, turbulent waters. The goal was to recover sediment cores containing millions of years’ worth of clues about the ACC’s behavior alongside Earth’s temperature changes.
Through meticulous analysis, the experts uncovered the secrets held within the layers of sediment.
Current, climate, and ice
The study reveals a strong link between the ACC’s speed and Earth’s overall temperature, much like a thermostat.
During colder periods, the current slowed down. But when the planet warmed up naturally in the past, the current responded by speeding up.
What’s truly alarming is that these past ACC speedups were directly connected to major losses of Antarctic ice. We’re observing a similar speedup of the ACC right now, driven by human-caused warming.
This suggests that Antarctica’s ice will likely continue to retreat – potentially fueling sea-level rise and even affecting the ocean’s ability to soak up carbon from our atmosphere.
Characteristics of the ACC
Vast scale: The ACC is the largest ocean current, stretching around Antarctica and connecting the Atlantic, Pacific, and Indian Oceans. It’s the only ocean current that encircles the globe completely, free from any continental barriers.
Volume and speed: It transports more water than any other current — approximately 135 million cubic meters per second. Its flow is influenced by wind patterns, the Earth’s rotation, and differences in water density.
Depth and width: The ACC extends from the surface to the ocean floor, reaching depths of up to 4,000 meters (about 13,123 feet) and spans widths of up to 2,000 kilometers (about 1,243 miles).
Functions of the ACC
Climate regulation: The ACC plays a crucial role in regulating the global climate. It helps distribute heat around the planet by moving warm water from the equator towards the poles and cold water towards the equator.
Carbon sequestration: The ACC is instrumental in the global carbon cycle. It absorbs significant amounts of carbon dioxide from the atmosphere, transporting it deep into the ocean where it can be stored for centuries.
Nutrient distribution: By stirring up water from different depths (upwelling), the ACC brings nutrients from the deep to the surface, supporting marine ecosystems around Antarctica and beyond.
Importance of the ACC
Biodiversity support: The nutrients brought to the surface by the ACC support phytoplankton blooms, which are the foundation of the Antarctic food web, sustaining a diverse array of marine life from krill to whales.
Impact on global ocean circulation: The ACC influences global ocean circulation patterns, including the formation of deep water masses in the North Atlantic that drive the global conveyor belt, a critical component of Earth’s climate system.
Climate change indicator: Changes in the speed or pattern of the ACC can indicate alterations in the global climate system. Its acceleration due to increased westerly winds is a concern, as it could have implications for sea-level rise and global temperature patterns.
The ocean’s influence on Antarctic current
How does the speeding up of the ACC affect things directly? Here’s how:
Melting Antarctica’s ice shelves
Winds over the Southern Ocean have grown about 40% stronger in the past few decades, driving the ACC and pulling warmer waters towards Antarctica’s floating ice shelves.
hese shelves act like giant plugs holding back huge glaciers. The warmer water erodes them from below, causing melting.
“If you leave an ice cube out in the air, it takes quite a while to melt. If you put it in contact with warm water, it goes rapidly” explains Winckler.
Uncertain carbon sponge
The oceans around Antarctica are a vital component of the Earth’s carbon cycle. They absorb a substantial amount of the carbon dioxide (CO2) that humans emit into the atmosphere, roughly 40%, acting as a “carbon sponge.”
This process is critical in moderating global warming, as it removes CO2 from the atmosphere, where it would otherwise trap heat, contributing to the greenhouse effect.
Why ocean currents are important
Ocean currents play a crucial role in shaping the Earth’s climate and supporting marine ecosystems. These massive, continuous streams of water flow through the world’s oceans, transporting heat, nutrients, and organisms across vast distances.
Types of ocean currents
Two primary types of ocean currents exist: surface currents and deep water currents.
Surface currents, driven by wind patterns and the Earth’s rotation (Coriolis effect), flow in the upper 400 meters of the ocean.
Future of Antarctic current
“These findings provide geological evidence in support of further increasing ACC flow with continued global warming,” noted the researchers.
As humans continue to pump greenhouse gases into the atmosphere, it’s almost certain that the ACC will keep speeding up. This is likely to unleash more intense warming around Antarctica, further destabilizing the West Antarctic Ice Sheet.
This vast reservoir of ice, much of it below sea level, holds the potential to raise global sea levels dramatically.
It’s time to pay attention to Antarctic current
The ACC isn’t getting as much attention as rising temperatures or melting Arctic ice caps, but perhaps it should. This mighty current has a complex relationship with our planet’s climate system, and changes to it will have ripple effects worldwide.
Understanding these complex forces, along with reducing greenhouse gas emissions, is essential to prepare for a future where a sped-up ACC, rising seas, and extreme weather might reshape our world.
More about ocean currents
https://www.earth.com/news/antarctic-circumpolar-current-speed-increasing-rising-sea-levels/
___________________________
Antarctic Circumpolar Current
https://en.wikipedia.org/wiki/Antarctic_Circumpolar_Current
Antarctic Circumpolar Current (ACC) is an ocean current that flows clockwise (as seen from the South Pole) from west to east around Antarctica. An alternative name for the ACC is the West Wind Drift. The ACC is the dominant circulation feature of the Southern Ocean and has a mean transport estimated at 100–150 Sverdrups (Sv, million m3/s),[1] or possibly even higher,[2] making it the largest ocean current. The current is circumpolar due to the lack of any landmass connecting with Antarctica and this keeps warm ocean waters away from Antarctica, enabling that continent to maintain its huge ice sheet.
Associated with the Circumpolar Current is the Antarctic Convergence, where the cold Antarctic waters meet the warmer waters of the subantarctic, creating a zone of upwelling nutrients. These nurture high levels of phytoplankton with associated copepods and krill, and resultant food chains supporting fish, whales, seals, penguins, albatrosses, and a wealth of other species.
The ACC has been known to sailors for centuries; it greatly speeds up any travel from west to east, but makes sailing extremely difficult from east to west, although this is mostly due to the prevailing westerly winds. Jack London's story "Make Westing" and the circumstances preceding the mutiny on the Bounty poignantly illustrate the difficulty it caused for mariners seeking to round Cape Horn westbound on the clipper ship route from New York to California.[3] The eastbound clipper route, which is the fastest sailing route around the world, follows the ACC around three continental capes – Cape Agulhas (Africa), South East Cape (Australia), and Cape Horn (South America).
The current creates the Ross and Weddell Gyres.
___________________________
Antarctic Circumpolar Wave
The Antarctic Circumpolar Wave (ACW) is a coupled ocean/atmosphere wave that circles the Southern Ocean in approximately eight years at 6–8 cm/s (2.4–3.1 in/s).[1] Since it is a wave-2 phenomenon (there are two ridges and two troughs in a latitude circle) at each fixed point in space a signal with a period of four years is seen.[2] The wave moves eastward with the prevailing currents.
History of the concept
Although the "wave" is seen in temperature, atmospheric pressure, sea ice and ocean height, the variations are hard to see in the raw data and need to be filtered to become apparent. Because the reliable record for the Southern Ocean is short (since the early 1980s) and signal processing is needed to reveal its existence, some climatologists doubt the existence of the wave. Others accept its existence but say that it varies in strength over decades.[3]
The wave was discovered simultaneously by White & Peterson 1996 and Jacobs & Mitchell 1996. Since then, ideas about the wave structure and maintenance mechanisms have changed and grown: by some accounts it is now to be considered as part of a global ENSO wave.
https://en.wikipedia.org/wiki/Antarctic_Circumpolar_Wave
___________________________
Falkland Current
https://en.wikipedia.org/wiki/Falkland_Current
The Falkland Current is a cold water current that flows northward along the Atlantic coast of Patagonia as far north as the mouth of the Río de la Plata. This current results from the movement of water from the West Wind Drift as it rounds Cape Horn. It takes its name from the Falkland Islands (Spanish: Islas Malvinas). This cold current mixes with the tropical Brazil Current in the Argentine Sea (see Brazil–Falkland Confluence), giving it its temperate climate.[1]
The current is an equatorward flowing current that carries cold and relatively fresh subantarctic water. The Falkland Current is a branch of the Antarctic Circumpolar Current. It transports between 60 and 90 Sverdrups of water with speeds ranging from a half a meter to a meter per second. Hydrographic data in this area is very scarce and thus various hydrographic variables have a great deal of error. The Falkland Current is not a surface current like the Brazil Current but it extends all the way to the sea-floor. Typical temperatures for the current are around 6 °C, with a salinity of 33.5–34.5 psu.
___________________________
Classification of mesoscale features in the Brazil-Falkland Current confluence zone
2000
https://www.sciencedirect.com/science/article/abs/pii/S0079661100000112
___________________________
The role of the Falkland Current in the dispersal of the squid Loligo gahi along the Patagonian Shelf
2005
https://www.sciencedirect.com/science/article/abs/pii/S0272771405003963
___________________________
Ocean Currents
Ocean Currents are defined as the continuous movement of water from one part of the ocean to another. Many forces, such as the prevailing winds, variation in temperature, salinity differences, Coriolis effect, breaking waves, and cabbeling, generate this directed movement of ocean water. Moreover, a current’s direction and strength are influenced by the configuration of the shoreline, depth contours, and interaction with other currents. The ocean currents can flow for vast distances and create a Global Ocean Conveyor Belt, which distributes the massive amount of heat and moisture around the planet. This way, the ocean currents play a critical role in determining the climate of different regions.

Map showing the distribution of the major ocean currents of the world.
https://www.worldatlas.com/oceans/ocean-currents.html
___________________________
List of Major Ocean Currents in the World

https://dashamlav.com/ocean-currents-list/
___________________________
Ocean Currents and Sea Surface Temperature
2019
https://mynasadata.larc.nasa.gov/sites/default/files/2019-01/Ocean%20Currents%20and%20Sea%20Surface%20Temperature.pdf
___________________________
Sea Surface Temperature, Salinity and Density
October 9, 2009
https://svs.gsfc.nasa.gov/3652
___________________________
-
The Antarctic Circumpolar Current - 100 times stronger than all the rivers combined
January 8, 2025
The passage of Cape Horn represents the southernmost point of the race, the most intense in terms of current, with a strong presence of ice due to the proximity of Antarctica and powerful winds that complicate navigation.
The circumpolar current goes around Antarctica and carries the Vendée Globe skippers in their race around the South Pole. "It is the strongest of all ocean currents because no land obstacle stops it", emphasizes Clément Vic, researcher at Ifremer at the Physical and Space Oceanography Laboratory. It is most intense south of Cape Horn: the South American tip and the Antarctic Peninsula form a sort of bottleneck called the Drake Passage, with an acceleration effect on the current. The flow is estimated at 170 million cubic meters per second, a flow rate 100 times greater than all the rivers in the world combined.
In this 700 km wide geographical bottleneck, navigators have no escape from depressions that can reach 1000 km in diameter. Unlike the rest of their navigation in the southern hemisphere, where they can bypass storms to the north or south. In addition, this passage is particularly dangerous because of the icebergs or other pieces of ice that have broken off and are not necessarily detected by satellites.
Sensors, satellites and digital models to better understand ocean currents
The oceans are in motion. The wind generates the waves, the Moon and the Sun cause the tides, the rotation of the Earth generates whirlpools. And to add the vertical dimension, the cold and salty water plunges. A vast oceanic conveyor belt thus transports each drop of water around the world, from the surface to the bottom and from the bottom to the surface.
Clément Vic tells us more about the scientific questions he still has about this current mechanics: "We know relatively well how water sinks to the bottom, we know less well how water rises to the surface. The interactions between currents and the ocean floor generate turbulence and specific points of water upwelling. Our latest studies show that the rise of water drops depends on the topography; for example on reliefs like the Mid-Atlantic Ridge, water rises at multiple points". Why is it important today to better understand this dynamic of ocean currents? Because they have a decisive impact on our climate. The best-known current, and yet not the strongest, is for example the Gulf Stream, whose extension, the North Atlantic Current, drains mildness and humidity towards Europe and which explains why we do not have a Canadian climate on our coasts.
However, climate change disrupts ocean currents. For example, the melting of ice increases and accelerates the flow of fresh water at the poles with less salty, lighter surface water. How will our conveyor belt react in the coming decades? Is there a risk of it seizing up? To answer this question, scientists are deploying measuring devices in all the world's oceans, for example with the Argo float network. They also use surface observations made using satellites equipped with sensors. Finally, they solve the equations that govern the movements of the oceans using computer calculations. A way to predict what may happen in future climates by 2050 or 2100.
Because the ocean is a significant heat reservoir compared to the atmosphere. Water has a capacity a thousand times greater than air to absorb energy. The ocean thus functions like a sponge that absorbs excess heat from the atmosphere as well as 25% of the CO2 emitted by human activities.
___________________________
Why Is It So Hard to Sail Around Cape Horn?
The Southern Ocean is home to several infamously dangerous sailing routes, but none of them are as notorious as the voyage around Cape Horn. This iconic headland, located at the southernmost tip of South America, is known for its treacherous waters and unpredictable weather conditions. In this article, we will explore why it is so hard to sail around Cape Horn.
Geographical Location
Cape Horn is situated in a region where the Atlantic and Pacific Oceans meet. The strong winds and currents from both oceans collide here, creating a volatile environment that even experienced sailors find challenging to navigate.
Unpredictable Weather
The weather conditions around Cape Horn are extremely unpredictable and can change rapidly. One moment it can be sunny and calm, and in the next moment, there can be gale-force winds and towering waves. These weather conditions make it difficult for sailors to plan their route or prepare for what lies ahead.
Waves
The waves near Cape Horn are notorious for their size and power. The combination of strong winds, currents, and shallow waters create steep waves that can reach up to 30 meters in height. These waves are not only intimidating but also dangerous for smaller vessels.
Wind
The wind patterns around Cape Horn are equally unpredictable. The region experiences some of the strongest winds on earth with gusts that can exceed hurricane force. The sudden changes in wind direction and speed make it difficult for sailors to maintain control of their vessel.
Narrow Passage
Another reason why sailing around Cape Horn is so difficult is due to the narrow passage between the headland and Antarctica. The passage is only about 800 kilometers wide, which means that there is little room for error when navigating through it.
Conclusion
In conclusion, sailing around Cape Horn is a challenging and dangerous endeavor for even the most experienced sailors. The combination of unpredictable weather, powerful waves, strong winds, and narrow passages make it one of the toughest sailing routes in the world. Nevertheless, Cape Horn remains a popular destination for adventurous sailors who seek to test their skills and push their limits.
https://trickyfish.co/why-is-it-so-hard-to-sail-around-cape-horn/
___________________________
Cape Horn, the ultimate test
2021
Fear and curiosity, a dream or a nightmare. All sailors have a relationship with Cape Horn.
Cape Horn, even the name sounds scary. The cliff is located on Hornos, one of the rugged islands where South America reach down and into the Southern Ocean. The archipelago is called Land of fire, but the climate is by no means hot. The northernmost islands in Antarctica, the South Shetland Islands, are only 800 kilometers away.
Until the Panama Canal was completed in 1914, ships had to sail south of South America to get between the Pacific and Atlantic Oceans. Here in the far south, winds blowing from west to east dominate, called "The roaring forties" and a little further south, "The furious fifties".
- The furious fifties are a belt of weather systems, new low pressures, that constantly passes by, says captain Marcus Seidl.
Apart from the southern tip of South America, there are no large areas of land that affect the wind here in the south, it blows continuously in a circle around the entire globe north of Antarctica, and is often very strong. The wind sets up strong currents and large waves, and you risk hitting larger and smaller icebergs. Scary.
- The area was most notorious with those who were to sail from east to west, towards the weather systems. They could spend several weeks getting around the little point called Cape Horn, getting from the Atlantic Ocean and into the Pacific Ocean, says Captain Marcus Seidl.
https://www.oneoceanexpedition.com/life-on-board/cape-horn-the-ultimate-test
___________________________
Drake Passage: The 'most dreaded bit of ocean on the globe' — where waves reach up to 80 feet
March 21, 2025
The Drake Passage is a "melting pot" of currents from the Atlantic, Pacific and Southern oceans, Heywood said. The waters are so turbulent that the layers which normally make up the seas mix together, meaning the passage draws a lot more carbon down into its depths than other parts of the ocean do.
The world's oceans lock away more than 30% of the carbon humans emit into the atmosphere every year, and the Drake Passage could be one of a handful of places where this activity is particularly pronounced, National Geographic reported.
___________________________
Timing and Climatic Consequences of the Opening of Drake Passage
21 Apr 2006
Abstract
https://www.science.org/doi/10.1126/science.1120044
___________________________
Energetic overturning flows, dynamic interocean exchanges, and ocean warming observed in the South Atlantic
19 January 2023
Abstract
Since the inception of the international South Atlantic Meridional Overturning Circulation initiative in the 21st century, substantial advances have been made in observing and understanding the Southern Hemisphere component of the Atlantic Meridional Overturning Circulation (AMOC). Here we synthesize insights gained into overturning flows, interocean exchanges, and water mass distributions and pathways in the South Atlantic. The overturning circulation in the South Atlantic uniquely carries heat equatorward and exports freshwater poleward and consists of two strong overturning cells. Density and pressure gradients, winds, eddies, boundary currents, and interocean exchanges create an energetic circulation in the subtropical and tropical South Atlantic Ocean. The relative importance of these drivers varies with the observed latitude and time scale. AMOC, interocean exchanges, and climate changes drive ocean warming at all depths, upper ocean salinification, and freshening in the deep and abyssal ocean in the South Atlantic. Long-term sustained observations are critical to detect and understand these changes and their impacts.
https://www.nature.com/articles/s43247-022-00644-x
___________________________
Observed Storm Track Dynamics in Drake Passage
01 Mar 2019
Abstract
The
dynamics of an oceanic storm track—where energy and enstrophy transfer
between the mean flow and eddies—are investigated using observations
from an eddy-rich region of the Antarctic Circumpolar Current downstream
of the Shackleton Fracture Zone (SFZ) in Drake Passage. Four years of
measurements by an array of current- and pressure-recording inverted
echo sounders deployed between November 2007 and November 2011 are used
to diagnose eddy–mean flow interactions and provide insight into
physical mechanisms for these transfers. Averaged within the upper to
mid-water column (400–1000-m depth) and over the 4-yr-record mean field,
eddy potential energy  is highest in the western part of the storm track and maximum eddy kinetic energy
  occurs farther away from the SFZ, shifting the proportion of eddy energies from
  to about 1 along the storm track. There are enhanced mean 3D wave activity fluxes
  immediately downstream of SFZ with strong horizontal flux vectors
emanating northeast from this region. Similar patterns across composites
of Polar Front and Subantarctic Front meander intrusions suggest the
dynamics are set more so by the presence of the SFZ than by the eddy’s
sign. A case study showing the evolution of a single eddy event, from 15
to 23 July 2010, highlights the storm-track dynamics in a series of
snapshots. Consistently, explaining the eddy energetics pattern requires
both horizontal and vertical components of W, implying
the importance of barotropic and baroclinic processes and instabilities
in controlling storm-track dynamics in Drake Passage.
immediately downstream of SFZ with strong horizontal flux vectors
emanating northeast from this region. Similar patterns across composites
of Polar Front and Subantarctic Front meander intrusions suggest the
dynamics are set more so by the presence of the SFZ than by the eddy’s
sign. A case study showing the evolution of a single eddy event, from 15
to 23 July 2010, highlights the storm-track dynamics in a series of
snapshots. Consistently, explaining the eddy energetics pattern requires
both horizontal and vertical components of W, implying
the importance of barotropic and baroclinic processes and instabilities
in controlling storm-track dynamics in Drake Passage.
https://journals.ametsoc.org/view/journals/phoc/49/3/jpo-d-18-0150.1.xml
___________________________
In the turbulent Drake Passage, scientists find a rare window where carbon sinks quickly into the deep ocean
April 12, 2023
Looking out across the Southern Ocean near Antarctica, I can see whales and seabirds diving in and out of the water as they feed on sea life in the lower levels of the food web. At the base of this food web are tiny phytoplankton – algae that grow at the ocean surface, taking up carbon from the atmosphere through photosynthesis, just as plants on land do.
Because of their small size, phytoplankton are at the mercy of the ocean’s swirling motions. They are also so abundant that the green swirls are often visible from space.
Typically, phytoplankton remain near the surface of the ocean. Some may slowly sink to depth because of gravity. But in the turbulent Drake Passage, a 520-mile-wide (850 km) bottleneck between Antarctica and South America, something unusual is happening, and it has an impact on how the ocean takes carbon dioxide – the main driver of global warming – out of the atmosphere.
The Drake Passage
The Drake Passage is notorious for its violent seas, with waves that can top 40 feet (12 meters) and powerful converging currents, some flowing as fast as 150 million cubic meters per second. Cold water from the Southern Ocean and warmer water from the north collide here, spinning off powerful and energetic eddies.
New scientific research I am involved in as an oceanographer now shows how the Drake Passage and a few other specific areas of the Southern Ocean play an outsize role in how the oceans lock up carbon from the atmosphere.

A topographic map of the Drake Passage between South America and Antarctica.
That process is crucial for our understanding of the climate. The global ocean is a massive reservoir of carbon, holding over 50 times as much carbon as the atmosphere. However, it is only when water carrying carbon gets to the deep ocean that carbon can be stored for long periods – up to centuries or millennia.
Photosynthetic phytoplankton are at the heart of that exchange. And in the Drake Passage, my colleagues and I have found that undersea mountains are stirring things up.
The role of ocean layers
The ocean can be visualized as having layers. With constant surface waves and winds, the upper layer is always stirring around, mixing waters. It’s like mixing milk into your morning coffee. This stirring mixes in solar heat and gases, such as carbon dioxide, taken up from the atmosphere.
Water density generally increases as the waters get deeper and colder and saltier. That forms density layers that are typically flat. Since water prefers to keep its density constant, it mostly moves horizontally and doesn’t easily move between the surface and deep ocean.

Yet despite this physical barrier, water testing shows that carbon dioxide produced by human activities is making its way into the deep ocean. One way is through chemistry: Carbon dioxide dissolves in water, creating carbonic acid. Living creatures in the ocean are another.
A view into the Drake Passage
Oceanographers have long pointed to the north Atlantic Ocean and the Southern Ocean as places where surface waters are moved to depth, taking large volumes of carbon with them. However, recent work has shown that this process may actually be dominated by only a few areas – including the Drake Passage.
Despite its being one of the most famous stretches of the ocean, scientists have only recently been able to observe this window in action.
The main flow of the Drake Passage is created by the effect of strong westerly winds across the Southern Ocean. Scientists have found that the westerly winds create a slope in the water density, with dense waters shallower closer to Antarctica, where colder melt water caps the surface, but sloping deeper into the ocean farther north toward South America.

Unlike in most of the ocean, density layers in the Drake Passage slope downward, allowing phytoplankton to mix downward as well as sideways.
With advances in autonomous underwater robots and computer modeling, we have been able to show how the flow of the Southern Ocean interacts with an underwater mountain in the Drake Passage. This underwater interaction mixes up the ocean, enhancing that coffeelike stirring process.
The stirring along the sloped density levels provides a pathway for water from the upper layer of the ocean to move into the depths. And phytoplankton at the surface ocean are carried along with this stirring, moving to depth much faster than they would by gravitational sinking alone.
In a less energetic region, these phytoplankton would die and respire their carbon back to the atmosphere or slowly sink. However, at the Drake Passage, phytoplankton can be swept to depth before this happens, meaning the carbon they’ve taken up from the atmosphere is sequestered in the deep ocean. Carbon dissolved and stored in the deep ocean may also vent out in these locations.
Scientists have estimated that the deepest ocean waters directly interact with the atmosphere through only about 5% of the ocean’s surface area. This is one of those special places.
Investigating the Drake Passage and other oceanographic windows allows science to home in on better understanding climate change and the workings of our blue planet.
___________________________
Convention on the conservation of antarctic marine living resources
1980
https://www.sciencedirect.com/science/article/abs/pii/S0378777X80801454
___________________________
Thermal convection in ice sheets: New data, new tests
2012
https://www.scirp.org/html/1-8301678_20743.htm
___________________________
Central tropical Pacific convection drives extreme high temperatures and surface melt on the Larsen C Ice Shelf, Antarctic Peninsula
2022
Abstract
Northern sections of the Larsen Ice Shelf, eastern Antarctic Peninsula (AP) have experienced dramatic break-up and collapse since the early 1990s due to strong summertime surface melt, linked to strengthened circumpolar westerly winds. Here we show that extreme summertime surface melt and record-high temperature events over the eastern AP and Larsen C Ice Shelf are triggered by deep convection in the central tropical Pacific (CPAC), which produces an elongated cyclonic anomaly across the South Pacific coupled with a strong high pressure anomaly over Drake Passage. Together these atmospheric circulation anomalies transport very warm and moist air to the southwest AP, often in the form of “atmospheric rivers”, producing strong foehn warming and surface melt on the eastern AP and Larsen C Ice Shelf. Therefore, variability in CPAC convection, in addition to the circumpolar westerlies, is a key driver of AP surface mass balance and the occurrence of extreme high temperatures.
https://pmc.ncbi.nlm.nih.gov/articles/PMC9279480/
___________________________
Persistent warm-eddy transport to Antarctic ice shelves driven by enhanced summer westerlies
22 January 2024
Abstract
The offshore ocean heat supplied to the Antarctic continental shelves by warm eddies has the potential to greatly impact the melting rates of ice shelves and subsequent global sea level rise. While featured in modeling and some observational studies, the processes around how these warm eddies form and overcome the dynamic sub-surface barrier of the Antarctic Slope Front over the upper continental slope has not yet been clarified. Here we report on the detailed observations of persistent eddies carrying warm modified Circumpolar Deep Water (CDW) onto the continental shelf of Prydz Bay, East Antarctica, using subsurface mooring and hydrographic section data from 2013-2015. We show the warm-eddy transport is most active when the summer westerlies strengthen, which promotes the upwelling of CDW and initiates eddy formation and intrusions. Our study highlights the important role of warm eddies in the melting of Antarctica’s ice shelves, both now and into the future.
https://www.nature.com/articles/s41467-024-45010-x
___________________________
Ocean eddy currents funnel extreme heat and cold to the life-filled depths
October 19. 2024
https://phys.org/news/2024-10-ocean-eddy-currents-funnel-extreme.html
___________________________
The role of double-diffusive convection in basal melting of Antarctic ice shelves
2020
https://www.pnas.org/doi/10.1073/pnas.2007541118
___________________________
Bathymetry and geological setting of the South Sandwich Islands volcanic arc
18 March 2016
https://www.cambridge.org/core/journals/antarctic-science/article/abs/bathymetry-and-geological-setting-of-the-south-sandwich-islands-volcanic-arc/4FDAD855C6E08E1901C08DE52C52E15E
___________________________
An ocean like no other: the Southern Ocean’s ecological richness and significance for global climate
December 6, 2020
In 2018, a map named after an oceanographer went viral.
The so-called Spilhaus projection, in which Earth is viewed from above the South Pole, was designed to show the connected nature of the ocean basins.
It is a perspective that comes naturally to those who live in the ocean-dominated southern hemisphere.
The Southern Ocean, also called the Antarctic Ocean (or even the Austral ocean), is like no other and best described in superlatives.
Storing heat and carbon
Let’s first look at the Southern Ocean’s capacity to store excess heat and carbon. The world’s oceans take up more than 90% of the excess heat generated by the burning of fossil fuels and a third of the additional carbon dioxide.
The Southern Ocean, south of 30°S, is estimated to store about 75% of this global oceanic uptake of excess heat and about 35% of the global uptake of excess carbon from the atmosphere. It is the primary storage of heat and carbon for the planet.
The Southern Ocean connects all major ocean basins, except the Arctic. The link is the Antarctic Circumpolar Current (ACC) – the largest ocean current on the planet. It carries more than 100 times the flow of all the rivers on Earth and transports enough water to fill Lake Ontario in just a few hours.
A combination of strong winds and a nearly uninterrupted passage around Antarctica give the ACC its strong flows and speed.
Mixing global currents
The Roaring Forties, Furious Fifties and Screaming Sixties are all popular names for the strong westerly winds that blow, nearly uninterrupted, across the Southern Ocean, creating equally impressive waves. This results in a massively energetic – and hard to measure – ocean surface.
But the heat and carbon exchanges across this complicated interface are globally important, and oceanographers have designed tools specifically for this challenging environment.
To really comprehend the Southern Ocean, one must think in three dimensions. Waters with different properties mix both horizontally and vertically in eddies.
Relatively warm subtropical water is mixed south, deep cool water from the North Atlantic rises back up toward the surface and colder polar water masses mix northward and sink back down.
This complex interplay is guided by the wind and by the shape of the seafloor.
To the north, there are only three major constrictions: the 850km-wide Drake Passage, and the submarine Kerguelan and Campbell Plateaus. To the south, the ACC butts up against Antarctica.
Here the ocean plays another crucial role in the global climate system by bringing relatively warm — and warming — Circumpolar Deep Water into contact with the ice fringing Antarctica.
Annual thaw and freeze of sea ice
The annual cycle of sea ice growing and melting around Antarctica is one of the defining rhythms of our planet and an important facet of the Southern Ocean. The two polar regions couldn’t be more different in this regard.
The Arctic is a small, deep ocean surrounded by land with only narrow exits. The Antarctic is a large landmass with a continental shelf surrounded by ocean. Each year, 15 million square kilometres of sea ice advance and retreat in these waters.
In contrast to the clear and dramatic changes in the north, the rhythm of Antarctic sea ice has followed less obvious patterns. In the face of a warming ocean, it was actually slowly expanding northward until around 2016, when it suddenly started to contract.
Read more: Why Antarctica's sea ice cover is so low (and no, it's not just about climate change)
Looking at the annual cycle of Antarctic sea ice, one might think it simply grows and melts in place as things get cold and warmer through the year. But in truth, much of the sea ice production happens in polynya – sea ice factories near the coast where cold and fast Antarctic winds both create and blow away new sea ice as fast as it appears.
This process brings us back to global ocean circulation. When the new ice grows, the salt from the freezing sea water gets squeezed out and mixes with the seawater below, creating colder and saltier seawater that sinks to the seafloor and drains northward.
Polynya are in effect a metro stop on a global transport system that sees water sinking at the poles, flowing north to be mixed upwards in a cycle lasting close to 1,000 years.
Not all ice shelves respond the same
Computer simulations have shown how the ice shelves at Antarctica’s fringe have waxed and waned over past millennia.
Because these floating extensions of the ice sheet interact directly with the ocean, they make the ice sheet sensitive to climate. Ocean warming and changes in the source of the water coming into contact with an ice shelf can cause it – and in turn the whole ice sheet – to change.
But not all ice shelves will respond to warming in the same way. Some ocean cavities are cold and slowly evolving. Others are actually described as hot – in polar terms – because of their interaction with Circumpolar Deep Water. The latter are changing rapidly right now.
We can observe many cryosphere processes from space, but to truly understand how far the ocean reaches beneath the ice we have to go hundreds of metres beneath the ice surface.
Making climate predictions requires an understanding of detailed processes that happen on short timescales, such as tidal cycles, in parts of the planet we are only beginning to explore.
Observing the Screaming Sixties
How do we sample something so big and so stormy? With robots.
Satellites have been observing the ocean surface since the 1980s. This technology can measure properties such as temperature and ocean surface height, and even be used to estimate biological productivity. But satellites can’t see beneath the surface.
When the game-changing Argo programme started in the 1990s, it revolutionised earth science by building a network of drifting ocean sentinels measuring temperature and salinity down to a depth of two kilometres.
The research vessel Kaharoa holds the record for the most deployments of Argo probes in the Southern Ocean, including its most recent storm-tossed, COVID-19-impacted voyage south of Australia and into the Indian Ocean.
The Argo program is only the start of a new era of ocean observation. Deep Argo probes dive to depths of 6km to detect how far down ocean warming is penetrating.
The past and future Southern Ocean
Earth hasn’t always looked as it does today. At times in the planet’s past, the Southern Ocean didn’t even exist. Continents and ocean basins were in different positions and the climate system operated very differently.
From the narrow view of human evolution, the Southern Ocean has been a stable component of a climate system and subject to relatively benign glacial oscillations. But glacial cycles play out over tens of thousands of years.
We are imposing a very rapid climate transient. The nearly three centuries since the start of the industrial revolution is shorter than the blink of an eye in geological context.
Future changes in the short (say by 2050) and long (by 2300) term are difficult to project. While the physics are relatively clear about what will happen, predicting when it will happen is more challenging.
Simulation tools that get the ocean, atmosphere and ice processes right are only starting to include ice shelf cavities and ocean eddies. The most recent synthesis of climate models shows progress in the simulated workings of the Southern Ocean. But sea ice remains a challenge to simulate well.
This is the frontier: a global research community working to connect data with rapidly improving computer models to better understand how this unique ocean operates...
___________________________
Decline of Antarctic Circumpolar Current due to polar ocean freshening (Debated)
3 March 2025
Abstract
The Antarctic Circumpolar Current (ACC) is the world's strongest ocean current and plays a disproportionate role in the climate system due to its role as a conduit for major ocean basins. This current system is linked to the ocean's vertical overturning circulation, and is thus pivotal to the uptake of heat and CO2 in the ocean. The strength of the ACC has varied substantially across warm and cold climates in Earth's past, but the exact dynamical drivers of this change remain elusive. This is in part because ocean models have historically been unable to adequately resolve the small-scale processes that control current strength. Here, we assess a global ocean model simulation which resolves such processes to diagnose the impact of changing thermal, haline and wind conditions on the strength of the ACC. Our results show that, by 2050, the strength of the ACC declines by ∼20% for a high-emissions scenario. This decline is driven by meltwater from ice shelves around Antarctica, which is exported to lower latitudes via the Antarctic Intermediate Water. This process weakens the zonal density stratification historically supported by surface temperature gradients, resulting in a slowdown of sub-surface zonal currents. Such a decline in transport, if realised, would have major implications on the global ocean circulation.
https://iopscience.iop.org/article/10.1088/1748-9326/adb31c
___________________________
New Research Sparks Concerns That Ocean Circulation Will Collapse (Debated / Controversial)
April 18, 2023
Scientists have long feared that warming could cause a breakdown of ocean circulation in the North Atlantic. But new research finds the real risk lies in Antarctica’s waters, where melting could disrupt currents in the next few decades, with profound impacts on global climate.
https://e360.yale.edu/features/climate-change-ocean-circulation-collapse-antarctica
___________________________
Shutdown of Southern Ocean convection controls long-term greenhouse gas-induced warming
27 September 2021
https://www.nature.com/articles/s41561-021-00825-x
___________________________
Scientists say the global ocean circulation may be more vulnerable to shutdown than we thought
January 5, 2017
https://www.arctictoday.com/scientists-say-the-global-ocean-circulation-may-be-more-vulnerable-to-shutdown-than-we-thought/
___________________________
Shelf–ocean exchange and hydrography west of the Antarctic Peninsula: a review
14 May 2018
Abstract
The West Antarctic Peninsula (WAP) is a highly productive marine ecosystem where extended periods of change have been observed in the form of glacier retreat, reduction of sea-ice cover and shifts in marine populations, among others. The physical environment on the shelf is known to be strongly influenced by the Antarctic Circumpolar Current flowing along the shelf slope and carrying warm, nutrient-rich water, by cold waters flooding into the northern Bransfield Strait from the Weddell Sea, by an extensive network of glaciers and ice shelves, and by strong seasonal to inter-annual variability in sea-ice formation and air–sea interactions, with significant modulation by climate modes like El Niño–Southern Oscillation and the Southern Annular Mode. However, significant gaps have remained in understanding the exchange processes between the open ocean and the shelf, the pathways and fate of oceanic water intrusions, the shelf heat and salt budgets, and the long-term evolution of the shelf properties and circulation. Here, we review how recent advances in long-term monitoring programmes, process studies and newly developed numerical models have helped bridge these gaps and set future research challenges for the WAP system.
https://royalsocietypublishing.org/doi/10.1098/rsta.2017.0164
___________________________
Microbial diversity and community structure across environmental gradients in Bransfield Strait, Western Antarctic Peninsula.
16 Dec 2014
https://europepmc.org/article/PMC/4267279
___________________________
TEMPORAL AND SPATIAL BENTHIC VARIATION ALONG THE BRANSFIELD AND GERLACHE STRAITS, ANTARCTICA
2011
https://ufdcimages.uflib.ufl.edu/UF/E0/04/29/97/00001/miner_m.pdf
___________________________
Geochemical signatures of tephras from Quaternary Antarctic Peninsula volcanoes
2013
https://www.scielo.cl/pdf/andgeol/v40n1/art01.pdf
___________________________
Helium in the Branslieid Strait waters: indication for local injection from back-arc rifting
1987
https://core.ac.uk/download/pdf/42964594.pdf
___________________________
Geophysical investigation in sediment cores and its relationship with the governing sedimentary processes at Bransfield Basin, Antarctica
2022
https://www.scielo.br/j/aabc/a/zDYWBVMpqBLg3888dwnWdLt/
___________________________
Late Holocene climate change recorded in proxy records from a Bransfield Basin sediment core, Antarctic Peninsula
11 Jun 2014
https://www.tandfonline.com/doi/full/10.3402/polar.v33.17236
___________________________
Detection of Surface Crevasses over Antarctic Ice Shelves Using SAR Imagery and Deep Learning Method
20 January 2022
https://www.mdpi.com/2072-4292/14/3/487/htm
___________________________
Researchers spot rare Antarctic 'dragon-skin' ice
May 10, 2017

https://phys.org/news/2017-05-rare-antarctic-dragon-skin-ice.html
___________________________
Types of Sea Ice in Antarctica
Jun 9, 2020
One of the first things you might think of when you think of Antarctica is likely ice, and lots of it. They don’t call it the ‘great white continent’ for nothing, and there’s more sea ice there than any place on earth. But did you know there are many, many different kinds of sea ice?
Sea ice comes in a wide variety of shapes and forms, depending on its stage in development as well as a number of environmental and meteorological conditions. Let’s take a closer look at the types of ice you’ll discover in Antarctica.
Icebergs
Icebergs are large floating masses of freshwater from glaciers or ice shelves that have broken. You can recognize tabular icebergs as they are flat-topped and show banding where they calved.
Pancake Ice
Named for circular pancake-like slabs, this sea ice is created through wind and wave action. Pancake Ice will combine with icy slush to become wider and raft with others to become thicker. Eventually the pancakes freeze together into larger floes or solid ice.
Nilas Ice
This is an early stage in the development of new sea ice. Nilas ice is a thin elastic crust of ice, bending easily around waves and swells without breaking, and forming a pattern of interlocking ‘fingers’ up to 10 cm thick.
Young Ice
Young Ice is in the transition stage between nilas and first-year ice, measuring 10-30 cm in thickness.
First-Year Ice
Sea ice of not more than one winter’s growth and has developed from young ice. It measures 30 cm or greater.
Old Ice
Old Ice is sea ice that has survived at least one summer’s melt. It is generally smoother in appearance than first-year ice.
Bergy Bits
The most fun to say, ‘bergy bits’ are pieces of floating ice that are less than 5 meters high and 10 meters across.
Growlers
A growler is a piece of floating ice that is almost awash. Smaller than bergy bits, growlers can be dangerous as they are difficult to see and very hard.
Drift Ice
Drift Ice are pieces of floating sea ice that are 20m or more across.
Brash Ice
Brash Ice is the ‘wreckage’ of other sea ice, smaller pieces of sea ice that have broken off and are not more than 2m across.
Pack Ice
When drift and brash ice are driven together by wind and currents it creates Pack Ice.
Fast Ice
This is ice that quickly forms and remains attached to the shore, or to an ice front such as an ice wall, shoals, or iceberg.
Floe
An ice floe is any relatively flat piece of ice 20m or more across. Floes are subdivided by size:
- Small: 20-100m across
- Medium: 100-500m across
- Big: 500-2,000m across
- Vast: 2-10km across
- Giant: Greater than 10km across
Who knew there were so many different types of sea ice? Now that you are informed, you can show off this new knowledge to all your fellow passengers on your very own voyage to Antarctica.
https://polar-latitudes.com/science/sea-ice-in-antarctica/
___________________________
Antarctic Peninsula Ice Sheet
2020
https://www.antarcticglaciers.org/antarctica-2/antarctic-peninsula-2/
___________________________
Discovery of 'hidden world' under Antarctic ice has scientists 'jumping for joy'
June 10, 2022
The secret ecosystem was found more than 1,600 feet below the surface.

A never-before-seen ecosystem lurks in an underground river deep below the icy surface in Antarctica. Researchers recently brought this "hidden world" into the light, revealing a dark and jagged cavern filled with swarms of tiny, shrimplike creatures.
The scientists found the secret subterranean habitat tucked away beneath the Larsen Ice Shelf — a massive, floating sheet of ice attached to the eastern coast of the Antarctic peninsula that famously birthed the world's largest iceberg in 2021. Satellite photos showed an unusual groove in the ice shelf close to where it met with the land, and researchers identified the peculiar feature as a subsurface river, which they described in a statement. The team drilled down around 1,640 feet (500 meters) below the ice's surface using a powerful hot-water hose to reach the underground chamber.
When the researchers sent a camera down through the icy tunnel and into the cavern, hundreds of tiny, blurry flecks in the water obscured the video feed. Initially, the team thought their equipment was faulty. But after refocusing the camera, they realized that the lens was being swarmed by tiny crustaceans known as amphipods. This caught the team off guard, as they had not expected to find any type of life this far below the icy surface.
https://www.livescience.com/hidden-ecosystem-under-antarctic-ice
___________________________
Evolution of the Antarctic continental margins
December 1987
https://www.researchgate.net/publication/264309923_Evolution_of_the_Antarctic_continental_margins
___________________________
Strong ice-ocean interaction beneath Shirase Glacier Tongue in East Antarctica
2020 Aug 24
Abstract
Mass loss from the Antarctic ice sheet, Earth’s largest freshwater
reservoir, results directly in global sea-level rise and Southern Ocean
freshening. Observational and modeling studies have demonstrated that
ice shelf basal melting, resulting from the inflow of warm water onto
the Antarctic continental shelf, plays a key role in the ice sheet’s
mass balance. In recent decades, warm ocean-cryosphere interaction in
the Amundsen and Bellingshausen seas has received a great deal of
attention. However, except for Totten Ice Shelf, East Antarctic ice
shelves typically have cold ice cavities with low basal melt rates. Here
we present direct observational evidence of high basal melt rates
(7–16 m yr−1) beneath an East Antarctic ice shelf, Shirase
Glacier Tongue, driven by southward-flowing warm water guided by a deep
continuous trough extending to the continental slope. The strength of
the alongshore wind controls the thickness of the inflowing warm water
layer and the rate of basal melting.
https://www.ncbi.nlm.nih.gov/pmc/articles/PMC7445286/
___________________________
Now tests show the ice ISN'T melting: Sea water under shelf in the East Antarctic is still freezing
12 January 2010
Sea water under an East Antarctic ice shelf showed no sign of higher temperatures, first tests showed today.
Despite
fears of a thaw linked to global warming that could bring higher world
ocean levels, tests conducted on the Fimbul Ice Shelf showed the sea
water is still around freezing point.
Thanks to sensors, lowered
through three holes drilled in the shelf, scientists have discovered the
water is not at higher temperatures widely blamed for the break-up of
10 shelves on the Antarctic Peninsula, the most northerly part of the
frozen continent.
https://www.dailymail.co.uk/news/article-1242398/Now-tests-ice-ISNT-melting-Sea-water-shelf-East-Antarctic-freezing.html
___________________________
Effects of Waves on Tabular Ice-Shelf Calving
Mar 3, 2013
https://www.deepdyve.com/lp/american-meteorological-society/effects-of-waves-on-tabular-ice-shelf-calving-tJxGMwZToB
___________________________
East Antarctic Landfast Sea Ice Distribution and Variability, 2000–08
2012
https://www.deepdyve.com/lp/american-meteorological-society/east-antarctic-landfast-sea-ice-distribution-and-variability-2000-08-tQqWJEQefu
___________________________
Change and variability in East Antarctic Sea ice seasonality, 1979/80-2009/10
2013
https://pubmed.ncbi.nlm.nih.gov/23705008/
___________________________
Antarctic sticks out huge annual ice 'tongue'
24 June 2008
https://www.newscientist.com/article/dn14192-antarctic-sticks-out-huge-annual-ice-tongue/
___________________________
Extensive retreat and re-advance of the West Antarctic Ice Sheet during the Holocene
1 June 2018
https://www.semanticscholar.org/paper/Extensive-retreat-and-re-advance-of-the-West-Ice-Kingslake-Scherer/f2308908d6deae6f69987c254ccc79522ff6718f
___________________________
The suppression of Antarctic bottom water formation by melting ice shelves in Prydz Bay
2016
https://pubmed.ncbi.nlm.nih.gov/27552365/
___________________________
Scientists Find Low Levels of Heavy Metals in Saithe
24 February 2014
https://thefishsite.com/articles/scientists-find-low-levels-of-heavy-metals-in-saithe
___________________________
Eoarchean
The Eoarchean ( /ˌiːoʊ.ɑːrˈkiːən/; also spelled Eoarchaean) is the first era of the Archean Eon of the geologic record. It spans 400 million years, from the end of the Hadean Eon 4 billion years ago (4000 Mya) to the start of the Paleoarchean Era 3600 Mya. The beginnings of life on Earth have been dated to this era and evidence of cyanobacteria date to 3500 Mya, comparatively shortly after the Eoarchean. At that time, the atmosphere was without oxygen and the pressure values ranged from 10 to 100 bar (around 10 to 100 times the atmospheric pressure today).
https://en.wikipedia.org/wiki/Eoarchean
___________________________
Propagation of barotropic Kelvin waves around Antarctica
05 May 2022
Abstract
Barotropic (i.e., depth-uniform) coastal oceanic Kelvin waves can provide rapid teleconnections from climate and weather events in one location to remote regions of the globe. Studies suggest that barotropic Kelvin waves observed around Antarctica may provide a mechanism for rapidly propagating circulation anomalies around the continent, with implications for continental shelf temperatures along the West Antarctic Peninsula and thus Antarctic ice mass loss rates. However, how the propagation of Kelvin waves around Antarctica is influenced by features such as coastal geometry and variations in bathymetry remains poorly understood. Here we study the propagation of barotropic Antarctic Kelvin waves using a range of idealized model simulations. Using a single-layer linear shallow water model with 1∘ horizontal resolution, we gradually add complexity of continental configuration, realistic bathymetry, variable planetary rotation, and forcing scenarios, to isolate sources and sinks of wave energy and the mechanisms responsible. We find that approximately 75% of sub-inertial barotropic Kelvin wave energy is scattered away from Antarctica as other waves in one circumnavigation of the continent, due mostly to interactions with bathymetry. Super-inertial barotropic Kelvin waves lose nearly 95% of their energy in one circumpolar loop, due to interactions with both coastal geometry and bathymetry. These results help to explain why only sustained signals of low-frequency resonant barotropic Kelvin waves have been observed around Antarctica, and contribute to our understanding of the role of rapid, oceanic teleconnections in climate.
https://link.springer.com/article/10.1007/s10236-022-01506-y
___________________________
Kelvin Waves around Antarctica
01 Nov 2014
https://journals.ametsoc.org/view/journals/phoc/44/11/jpo-d-14-0051.1.xml
___________________________
How Kelvin waves convert East Antarctic winds to West Antarctic ice melt
July 17, 2017
Higher rates of ice melt on the western side of the Antarctic Peninsula – not far from where a large chunk of the Larsen C ice sheet broke off to create one of largest icebergs ever recorded – may be driven by strengthening winds 6,000 kilometres away on the eastern side of the polar continent, suggests new research.
It’s all to do, according to the paper published in Nature Climate Change, with the closer proximity of the peninsula to the warmer water of the Antarctic Circumpolar Current and with Kelvin waves – the giant planetary waves driven by gravity and the inertial motion of the Earth’s rotation (known as the Coriolis force).
Kelvin waves follow along coastlines in a general east-to-west direction, though they will travel north and south when the coast does. When these waves, travelling around the continent at almost 700 km/h, reach the steep underwater topography of the West Antarctic Peninsula, they push warmer water up underneath the ice sheets along the peninsula’s shoreline.
“It is this combination of available warm water offshore, and a transport of this warm water onto the shelf, that has seen rapid ice shelf melt along the West Antarctic sector over the past several decades,” explains lead researcher Paul Spence, of the University of New South Wales. “We always knew warm water was finding its way into this area but the precise mechanism has remained unclear. That remote winds on the opposite side of Antarctica can cause such a substantial subsurface warming is a worrying aspect of the circulation at the Antarctic margin...”
___________________________
Scientists observe rapid ozone fluctuations over the Antarctic polar vortex edge area
May 12, 2021
The polar vortex is a large area of upper-atmosphere cyclonic air circulation surrounding both poles. It is bounded by the polar jet stream and its associated cold air is usually confined to the polar regions. Within the Antarctic circle, and southern polar vortex, ozone quantities are the lowest, globally. A research published in Advances in Atmospheric Sciences, led by Dr. Luo Yuhan, corresponding author and Associate Professor at the Hefei Institutes of Physical Science (HFIPS), suggests that the polar vortex plays a key role in Antarctic stratospheric ozone depletion.
"The atmosphere over Antarctica is controlled by a strong polar vortex in winter, making it difficult to exchange with the mid-latitude atmosphere." said Dr. Luo. "The extremely low air temperatures (<195 K) inside the polar vortex, lead to the formation of polar stratospheric clouds (PSCs)."
Dr. Luo further explained that PSCs are primarily composed of nitrate trihydrate and water ice, along with smaller concentrations of other volatile compounds. These aerosols provide surfaces for heterogeneous reactions that convert halogen reservoirs to active halogens which cause severe ozone depletion.
The team used Zenith Scattered Light Differential Optical Absorption Spectroscopy (ZSL-DOAS) techniques to measure ozone depletion near the edge of the polar vortex at the Fildes Peninsula on King George Island (62.22S, 58.96W). ZSL-DOAS can accurately quantify the column density of ozone. The ozone columns were compared with the stratospheric ozone profiles from NASA's MERRA2 ozone database and PV profiles from the ECMWF dataset, which helped better understand the causes of ozone depletion.
"PV is used to characterize the polar vortex and determine the edge of polar vortex by Nash's criterion." said Qian Yuanyan, a Ph.D. candidate working with Dr. Luo, and the first author of this paper. Nash's criterion suggests that the vortex typically lies at or south of 65° equivalent latitude, based on PV values.
Results show that PV is positively correlated with total ozone columns, and both variables trend up and down at the same pace.
"The observations conducted in this study contribute to a base for further analysis to improve the prediction of the inter-annual variations of stratospheric ozone." said Dr. Luo. "This will provide a better understanding of ozone recovery and stratosphere-troposphere exchange over the polar vortex edge area."
https://phys.org/news/2021-05-scientists-rapid-ozone-fluctuations-antarctic.html
___________________________
NEW JET STREAM FOUND IN PACIFIC; Located Near Antarctica, It Sweeps Over New Zealand Toward South America
Dec. 17, 1957
___________________________
Global Ban on Ozone-Eating Chemicals Credited in Change to Southern Jet Stream
March 25, 2020
International efforts to curb ozone-depleting chemicals have paused and potentially reversed shifting jet stream winds that affect storm patterns, ocean temperatures and Antarctic sea ice in the Southern Hemisphere, scientists found in a study released Wednesday.
___________________________
The southern jet stream is moving back to normal thanks to global efforts
2020
Have you ever heard of the southern jet stream? It’s a powerful wind that shapes weather patterns and ocean currents in the southern hemisphere, particularly in the summer. Up until about 2000, it had been shifting from its usual course and moving southwards towards the Antarctic at a rate of one degree of latitude each decade, affecting storm tracks and rainfall over South America, East Africa, and Australia.
Affected by holes in the ozone layer
Previous research has shown this was primarily driven by the depletion of the ozone layer by manmade chemical compounds such as chlorofluorocarbons and hydrochlorofluorocarbons, found in fridges, aerosols and other industrial processes. These chemicals, which were used in vast quantities until they started to be phased out under the United Nations 1987 Montreal protocol, thinned the ozone layer, causing a widening “hole” high above the south pole that affected wind patterns.
Back on track
But according to a paper, the Montreal protocol made a huge impact. Not only has it allowed the ozone repair itself, but its also helping to return the southern jet stream to a normal state after decades of human-caused disruption. The new paper, published in the journal Nature, shows that the Montreal protocol has paused the southward movement of the jet stream since the turn of the century and may even be starting to reverse it as the ozone hole begins to close.
Last September, satellite images revealed the ozone hole annual peak had shrunk to 16.4m sq km, the smallest extent since 1982. It’s a success story in international cooperation and should motivate us further as we fight to spare the planet from the climate crisis.
___________________________
Ozone depletion trumps greenhouse gas increase in jet-stream shift
January 31, 2013
UNIVERSITY PARK, Pa. -- Depletion of Antarctic ozone is a more important factor than increasing greenhouse gases in shifting the Southern Hemisphere jet stream in a southward direction, according to researchers at Penn State.
"Previous research suggests that this southward shift in the jet stream has contributed to changes in ocean circulation patterns and precipitation patterns in the Southern Hemisphere, both of which can have important impacts on people's livelihoods," said Sukyoung Lee, professor of meteorology.
According to Lee, based on modeling studies, both ozone depletion and greenhouse gas increase are thought to have contributed to the southward shift of the Southern Hemisphere jet stream, with the former having a greater impact. But until now, no one has been able to determine the extent to which each of these two forcings has contributed to the shift using observational data.
"Understanding the differences between these two forcings is important in predicting what will happen as the ozone hole recovers," she said. "The jet stream is expected to shift back toward the north as ozone is replenished, yet the greenhouse-gas effect could negate this."
Lee and her colleague, Steven Feldstein, professor of meteorology, developed a new method to distinguish between the effects of the two forcings. The method uses a cluster analysis to investigate the effects of ozone and greenhouse gas on several different observed wind patterns.
"When most people look at ozone and greenhouse gases, they focus on one wind pattern, but my previous research suggests that, by looking at several different but similar patterns, you can learn more about what is really happening," said Feldstein.
In their study, the researchers analyzed four wind patterns. The first wind pattern corresponded to an equatorward shift of the midlatitude westerlies toward the equator. The second pattern also described an equatorward shift, but included a strong tropical component. The third pattern corresponded to a poleward shift of the westerlies toward the South Pole with a weakening in the maximum strength of the jet. The fourth pattern corresponded to a smaller poleward jet shift with a strong tropical component.
In addition to their novel inclusion of more than one wind pattern in their analysis, the scientists investigated the four wind patterns at very short time scales.
"Climate models are usually run for many years; they don't look at the day-to-day weather," said Feldstein. "But we learned that the four wind patterns fluctuate over about 10 days, so they change on a time scale that is similar to daily weather. This realization means that by taking into account fluctuations associated with the daily weather, it will be easier to test theories about the mechanism by which ozone and greenhouse gases influence the jet stream."
The researchers used an algorithm to examine the relationship between daily weather patterns and the four wind patterns. They found that the first wind pattern -- which corresponded to an equatorward shift of the midlatitude westerlies -- was associated with greenhouse gases. They also found that the third pattern -- which corresponded to a poleward shift of the westerlies -- was associated with ozone. The other two wind patterns were unrelated to either of the forcings. The researchers found that a long-term decline in the frequency of the first pattern and a long-term increase in the frequency of the third pattern can explain the changes in the Southern Hemisphere jet stream.
"Ozone had the bigger impact on the change in the position of the jet stream," said Lee. "The opposite is likely true for the Northern Hemisphere; we think that ozone has a limited influence on the Northern Hemisphere. Understanding which of these forcings is most important in certain locations may help policy makers as they begin to plan for the future."
In addition to finding that ozone is more important than greenhouse gases in influencing the jet-stream shift, the scientists also found evidence for a mechanism by which greenhouse gases influence the jet-stream shift. They learned that greenhouse gases may not directly influence the jet-stream shift, but rather may indirectly influence the shift by changing tropical convection or the vertical transfer of heat in large-scale cloud systems, which in turn, influences the jet shift. The researchers currently are further examining this and other possible mechanisms for how greenhouse gases and ozone influence the jet stream as well as Antarctic sea ice.
The results will appear in the Feb. 1 issue of the journal Science.
"Not only are the results of this paper important for better understanding climate change, but this paper is also important because it uses a new approach to try to better understand climate change; it uses observational data on a short time scale to try to look at cause and effect, which is something that is rarely done in climate research," said Feldstein. "Also, our results are consistent with climate models, so this paper provides support that climate models are performing well at simulating the atmospheric response to ozone and greenhouse gases."
___________________________
The polar vortex above the Arctic has been spinning backwards for weeks. Here's why.
March 28, 2024
Atmospheric scientists were surprised earlier this month to notice that the Arctic's polar vortex reversed its trajectory as it began spinning in the opposite direction. What's more: It has yet to stop.
The change occurred around March 4 and is among the six strongest such events since 1979, Amy Butler, a climate scientist at the National Oceanic and Atmospheric Administration (NOAA), told Spaceweather.com.
The rotating mass of cold air that circles in the Arctic stratosphere is infamous for triggering extreme cold and storms in various regions, but fortunately that has not happened in this case, according to Butler, the author of NOAA's new polar vortex blog. Instead, what Butler calls "Sudden Stratospheric Warming events" led to an increase of polar ozone from lower latitudes surrounding the Arctic, causing the swirling reversal.
"Atmospheric planetary waves have been breaking in the polar stratosphere, increasing its temperature," Butler told SpaceWeather.com. "Also, warming air helps prevent chemical ozone loss."
The so-called "ozone spike" is the biggest in the month of March since record-keeping began in 1979, the outlet reported.
What is a polar vortex?
The stratospheric polar vortex is a large-scale region of circulating winds that helps to confine cold air to the polar regions, according to NASA.
But when it weakens or is disturbed, that cold air can leak into lower latitudes and cause major weather events.
Residing high up in the stratosphere about 30 miles above Earth's surface, the vortex is most prominent during the winter. The winds spin at speeds of around 155 mph, according to the U.K. Met Office, nearly matching the minimum wind speed for a Category 5 hurricane.
Disruptions to the polar vortex can cause severe weather in the U.S., such as in 2021 when Louisville, Kentucky saw "an abrupt end to the mostly tranquil weather the region had experienced for much of 2020," according to NOAA.
What caused the polar vortex reversal?
According to NOAA, the vortex has been noticeably active this winter.
The prevailing west-to-east "screaming-fast winds" circling the North Pole have completely reversed twice this year, the agency said in a March 20 blog post.
The culprit for the disruption lies on a sudden atmospheric warming caused by planetary waves that jostle the stratosphere from below and can reverse a vortex's flow, according to NOAA.
The disruptions can also have an effect on weather here in the U.S., such as the cold snap that the central region of the country experienced in January, NOAA said.
So how much longer should it last?
Butler told SpaceWeather.com that the winds are starting to slow down, meaning the ozone spike will subside and westerly winds will resume around the end of March.
https://www.usatoday.com/story/news/world/2024/03/28/polar-vortex-spinning-backwards/73129855007/
___________________________
The polar vortex is hitting the brakes
For much of this winter season, the polar vortex winds at 60°N have been racing around the stratospheric polar region. During February alone, these west-to-east winds were two times stronger than normal for that time of year. However, the latest forecasts suggest that the polar vortex is about to switch gears with a major vortex disruption to happen this weekend. Read on to find out why the polar vortex could be bottoming out early this season.
___________________________
Here’s What to Know About the Polar Vortex Collapse
Mar 6, 2025
https://time.com/7265299/what-to-know-polar-vortex-collapse/
___________________________
The pollution polar vortex
Feb 2025
https://www.arcticwwf.org/the-circle/stories/the-pollution-polar-vortex/
___________________________
'Major disruption' has caused Arctic polar vortex to slide off North Pole, scientists say
April 4, 2025
A major disruption to the Arctic polar vortex has bumped the ring of wind that circles the North Pole off its perch and towards Europe, a new animation shows.
The migration could trigger colder-than-average temperatures in parts of the continent and across the eastern U.S. over the coming week, climate scientists say.
The polar vortex started wandering off course March 9, when its high winds suddenly switched from blowing west to east to blowing in the opposite direction. This switch normally happens each year, but it tends to occur in mid-April — meaning this year's reversal struck unusually early, according to a blog post published April 3 by the National Oceanic and Atmospheric Administration (NOAA).
___________________________
Coldest January since 2011 brewing for US to lead to multiple winter storms
Dec 29, 2024
Dramatically colder conditions are ahead as an Arctic blast moves into
the U.S. starting next week. The bitterly cold pattern could be the
coldest January in more than a decade and may be strewn with winter
storms for the Midwest, South and East.
___________________________
Coldest Antarctic June Ever Recorded
2014
Antarctica continues to defy the global warming script, with a report from Meteo France, that June this year was the coldest Antarctic June ever recorded, at the French Antarctic Dumont d’Urville Station.
https://wattsupwiththat.com/2014/07/12/coldest-antarctic-june-ever-recorded/
___________________________
Antarctica is suffering a near-record breaking winter — 10C colder than usual
June 21, 2021
https://www.climatedepot.com/2021/06/21/antarctica-is-suffering-a-near-record-breaking-winter-10c-colder-than-usual/
___________________________
Antarctica's last six months were the coldest on record
Oct 10, 2021
___________________________
Antarctica hits record temperatures, say experts
March 20, 2022
PARIS (March 20): Eastern Antarctica has recorded exceptionally high temperatures this week, more than 30 degrees Celsius above normal, say experts.
The Concordia research base at Dome C of the Antarctic, which is at an altitude of 3,000 metres (9,800 feet), on Friday registered a record -11.5 degrees Celsius (11.3 Fahrenheit), Etienne Kapikian, a meteorologist from France-Meteo tweeted.
Normally, temperatures fall with the end of the southern summer, but the Dumont d’Urville station on Antarctica registered record temperatures for March with 4.9C (40.82F), at a time of year when normally temperatures are already sub-zero.
Gaetan Heymes of France Meteo described the unseasonably mild weather as a “historic event”.
And geoscientist Jonathan Wille wrote on Twitter: “And there it is, Concordia broke its all time record temperature by 1.5°C. – AFP
https://www.theborneopost.com/2022/03/20/antarctica-hits-record-temperatures-say-experts/
___________________________
UN: Antarctic high temp records will take months to verify
February 16, 2020
https://phys.org/news/2020-02-antarctic-high-temp-months.html
___________________________
Desorption kinetics of heavy metals in the gleyic layer of permafrost-affected soils in Arctic region assessed by geochemical fractionation and DGT/DIFS
2021
https://www.sciencedirect.com/science/article/abs/pii/S0341816221003970
___________________________
Iron in sea ice: Review and new insights
October 27 2016
https://online.ucpress.edu/elementa/article/doi/10.12952/journal.elementa.000130/112863/Iron-in-sea-ice-Review-and-new-insightsIron-in-sea
___________________________
Investigate the feedback mechanisms of Arctic clouds and radiation on sea ice changes
2021
https://ceres.larc.nasa.gov/documents/STM/2021-05/26_Dong_CERES_STM_20210512_350_Huang.pdf
___________________________
Interannual Variability of Primary Production in the Laptev Sea
04 June 2020
https://link.springer.com/article/10.1134/S0001437020010075
___________________________
Radiocarbon of quaternary along shore and bottom deposits of the Lena and the Laptev Sea sediments
1996
https://www.sciencedirect.com/science/article/abs/pii/0304420395000968
___________________________
Debris from Melting Shelves Changing the Biology and Chemistry of the Arctic Ocean
February 12, 2018
https://www.fondriest.com/news/debris-melting-shelves-changing-biology-chemistry-arctic-ocean.htm
___________________________
Radium Isotopes Across the Arctic Ocean Show Time Scales of Water Mass Ventilation and Increasing Shelf Inputs
1 July 2018
https://www.semanticscholar.org/paper/Radium-Isotopes-Across-the-Arctic-Ocean-Show-Time-Loeff-Kipp/98003261eec17d21902b1b1a241d11a3586e20a7
___________________________
Increased fluxes of shelf-derived materials to the central Arctic Ocean
3 Jan 2018
https://www.science.org/doi/10.1126/sciadv.aao1302
___________________________
The cause of Jupiter’s glowing “northern lights” is finally revealed
July 9, 2021
https://www.inverse.com/science/juno-jupiter-aurora-discovery
___________________________
Arctic warming interrupts the Transpolar Drift and affects long-range transport of sea ice and ice-rafted matter
02 April 2019
https://www.nature.com/articles/s41598-019-41456-y/
___________________________
Jupiter’s intense auroras heat up its atmosphere
October 8, 2021
Charged particles slamming into the air above the poles create heat that spreads far and wide
https://www.sciencenewsforstudents.org/article/jupiters-intense-auroras-heat-atmosphere
___________________________
Mystery of Jupiter’s northern lights solved after 40 years, scientists say
July 9, 2021
https://www.cnn.com/2021/07/09/world/jupiter-northern-lights-mystery-scn/index.html
___________________________
Discovery
and characterization of submarine groundwater discharge in the Siberian
Arctic seas: A case study in the Buor-Khaya Gulf, Laptev Sea
October 2017
https://www.researchgate.net/figure/Salinity-activities-of-radium-isotopes-224-Ra-226-Ra-228-Ra-dpm-100-L-1-in-the_tbl1_320236429
___________________________
Every 27 minutes, there’s an X-ray aurora on Jupiter. Here’s why.
July 14, 2021
https://bigthink.com/hard-science/jupiter-aurora/
___________________________
Hubble Captures Vivid Auroras in Jupiter’s Atmosphere
Jun 30, 2016
https://www.nasa.gov/feature/goddard/2016/hubble-captures-vivid-auroras-in-jupiter-s-atmosphere
___________________________
Huge New Storm Creates Hexagon at Jupiter's South Pole
December 14, 2019

A new, smaller cyclone can be seen at the lower right of this infrared image of Jupiter's south pole taken on Nov. 4, 2019, during the 23rd science pass of the planet by NASA's Juno spacecraft.

https://www.livescience.com/giant-storm-discovered-jupiter.html
___________________________
Jupiter's Pentagon Turns Hexagon
Dec. 12, 2019
https://www.jpl.nasa.gov/images/pia23559-jupiters-pentagon-turns-hexagon
___________________________
Jupiter’s polar polygons: Clusters of cyclones around the poles
2018 March 7
https://britastro.org/section_news_item/jupiters-polar-polygons-clusters-of-cyclones-around-the-poles
___________________________
NASA Just Watched a Mass of Cyclones on Jupiter Evolve Into a Mesmerising Hexagon
13 December 2019
https://www.sciencealert.com/june-watched-a-pentagon-of-storms-on-jupiter-evolve-into-a-hexagon
___________________________
Stunning Jupiter images ‘unlike anything’ NASA has ever seen before
Sep 5, 2016
https://www.express.co.uk/news/science/707398/Jupiter-images-NASA-juno-infrared-auroras
___________________________
Refining the contribution of riverine particulate release to the global marine Nd budget
21 April 2022
https://progearthplanetsci.springeropen.com/articles/10.1186/s40645-022-00479-2
___________________________
Sources, Transport and Sinks of Radionuclides in Marine Environments
21 December 2017
https://link.springer.com/chapter/10.1007/978-3-319-71788-3_13
___________________________
The Significance of the Hexagon
https://www.humanmanaged.com/articles/the-significance-of-the-hexagon
___________________________
Saturn's hexagon recreated in the laboratory
May 04, 2010

Saturn's north polar hexagon (animation)
This movie of Saturn's north pole was taken by Cassini's VIMS
spectrometer at a mid-infrared wavelength of 5 microns. It was winter at
Saturn's north pole; all illumination is thermal radiation (heat)
welling up from Saturn's depths.
https://www.planetary.org/articles/2471
___________________________
Explaining the formation of a hexagon storm on Saturn
October 6, 2020
A new 3D model could explain the formation of a hexagon storm on Saturn
https://www.sciencedaily.com/releases/2020/10/201006165740.htm
___________________________
What is up with that hexagon on Saturn? We might have finally found out
June 20, 2020

Saturn's hexagonal storm in motion.
https://www.syfy.com/syfy-wire/what-is-up-with-that-hexagon-on-saturn
___________________________
Weird hexagon on Saturn is way bigger than scientists thought
Sept. 5, 2018
https://www.nbcnews.com/mach/science/weird-hexagon-saturn-way-bigger-scientists-thought-ncna906541
___________________________
Bizarre Giant Hexagon on Saturn May Finally Be Explained
September 22, 2015
https://www.space.com/30608-mysterious-saturn-hexagon-explained.html
___________________________
What is the hexagon at Saturn’s north pole, and what causes it?
January 28, 2013
https://astronomy.com/magazine/ask-astro/2013/01/saturnian-shape
___________________________
Bizarre Giant Hexagon on Saturn May Finally Be Explained
September 23, 2015
https://news.yahoo.com/bizarre-giant-hexagon-saturn-may-finally-explained-112829193.html
___________________________
Saturn's Famous Hexagon May Tower Above the Clouds
Sep 5, 2018
https://www.nasa.gov/feature/jpl/saturns-famous-hexagon-may-tower-above-the-clouds
___________________________
Saturn's Northern Hexagon
July 5, 2020
https://science.nasa.gov/saturns-northern-hexagon
___________________________
Saturn's Hexagon in Motion
https://solarsystem.nasa.gov/missions/cassini/science/saturn/hexagon-in-motion/
___________________________
Saturn's Streaming Hexagon Storm
December 12, 2012
https://solarsystem.nasa.gov/resources/15927/saturns-streaming-hexagon-storm/
___________________________
Saturn's hexagon

A partial view of Saturn's north pole, 2016

2013 and 2017: hexagon color changes

False-color image from the Cassini probe of the central vortex deep inside the hexagon formation
https://en.wikipedia.org/wiki/Saturn%27s_hexagon
___________________________
Saturn’s high-altitude winds generate an extraordinary aurorae, study finds
08 February 2022
https://le.ac.uk/news/2022/february/saturn-aurorae
___________________________
Saturn’s Newfound Aurora Comes From Speedy Winds High In The Atmosphere
Mar 2, 2022

An infrared image of Saturn with an aurora visible at its south pole, taken by the Cassini
https://www.forbes.com/sites/elizabethhowell1/2022/03/02/saturns-newfound-aurora-comes-from-speedy-winds-high-in-the-atmosphere/?sh=411e8dcf5e80
___________________________
Space Scientists Discover a Never-Before-Seen Mechanism Fueling Huge Planetary Aurorae on Saturn
February 9, 2022
https://scitechdaily.com/space-scientists-discover-a-never-before-seen-mechanism-fueling-huge-planetary-aurorae-on-saturn/
___________________________
A New Type of Aurora Found on Saturn Resolves a Planetary Mystery
2022
The discovery of the first wind-driven aurora sheds light on a strange phenomenon playing out below Saturn’s stormy atmosphere.
https://www.wired.com/story/auroras-on-saturn/
___________________________
Scientists discover the hidden force behind Saturn’s Aurora Borealis
Feb 09, 2022
https://interestingengineering.com/saturn-aurora-borealis
___________________________
Saturn's Auroras
February 16, 2005

These images of Saturn's polar aurora were taken by NASA's Hubble Space
Telescope on Jan. 24, 26, and 28. Each of the three images of Saturn
combines ultraviolet images of the south polar region (to show the
auroral emissions) with visible wavelength images of the planet and
rings. The Hubble images were obtained during a joint campaign with
NASA's Cassini spacecraft to measure the solar wind approaching Saturn
and the Saturn kilometric radio emissions. The strong brightening of
the aurora on January 26 corresponded with the recent arrival of a large
disturbance in the solar wind. These results are presented in three
papers, which appear in the Feb. 17 issue of the journal Nature.
https://solarsystem.nasa.gov/resources/12369/saturns-auroras/
___________________________
Planety Mystery Behind Saturn’s Bright Aurora Borealis Finally Resolved
Feb 25, 2022
https://www.sciencetimes.com/articles/36322/20220225/saturn-s-aurora-borealis-finally-resolves-a-planetary-mystery.htm
___________________________
Swirling winds of Saturn trigger never-before-seen auroras
February 25, 2022
https://www.space.com/saturn-winds-trigger-new-auroras
___________________________
Saturn’s Aurora Borealis: Should The Planet's High-Altitude Winds Be Blamed For This Stunning Mechanism?
Feb 11, 2022
https://www.sciencetimes.com/articles/36057/20220211/saturn-s-aurora-borealis-should-the-planets-high-altitude-winds-be-blamed-for-this-stunning-mechanism.htm
___________________________
See Saturn's Stunning Auroras Glow Over Time in These Hubble Photos
August 31, 2018
https://www.space.com/41695-saturn-auroras-amazing-hubble-photos-video.html
___________________________
Cassini: Saturn's Perplexing Hexagon

The globe of Saturn, seen here in natural color, is reminiscent of a holiday ornament in this wide-angle view from NASA's Cassini spacecraft. The characteristic hexagonal shape of Saturn's northern jet stream appears somewhat yellow here. At the pole lies a Saturnian version of a high-speed hurricane, eye and all. Images taken using red, green and blue filters were combined to create this natural-color view, taken with the Cassini spacecraft wide-angle camera on July 22, 2013, at a distance of approximately 611,000 miles (984,000 kilometers) from Saturn.
https://solarsystem.nasa.gov/news/13037/a-vexing-hexagon/
___________________________
Source apportionment of methane escaping the subsea permafrost system in the outer Eurasian Arctic Shelf
2021
https://www.pnas.org/doi/pdf/10.1073/pnas.2019672118
___________________________
Jupiter’s Auroras Present a Powerful Mystery
Sep 6, 2017
https://www.nasa.gov/feature/jpl/jupiter-s-aurora-presents-a-powerful-mystery
___________________________
Jupiter's powerful auroras form during a 'tug of war' between the planet and nearby moon volcanoes
Feb 5, 2022

A composite of two observations from NASA's Hubble Space Telescope show Jupiter's aurora.
https://www.businessinsider.com/space-lava-from-moon-volcanoes-creates-jupiters-powerful-aurora-lights-2022-2?op=1
___________________________
Jupiter's moons light up aurora borealis
Sep 17, 2009
One of the most beautiful sights in the sky (at least, so I've heard, since I've never ^%$#&*# seen one) is an aurora. The Earth has a magnetic field that traps charged particles from the Sun, and due to complicated processes that are still being investigated these particles can slam into our air, causing it to glow (exactly) like a neon sign. But we're not the only planet with a magnetic field. And some moons have them, too. Check this image out:

https://www.discovermagazine.com/the-sciences/jupiters-moons-light-up-aurora-borealis
___________________________
Saturn's hexagon could be an enormous tower
2023
https://astronomy.com/news/2018/09/saturns-hexagon-could-be-an-enormous-tower
___________________________
Weird hexagonal dune field seen on Mars
February 22, 2019

Unusual dune field on a crater floor in Terra Cimmeria,
part of the heavily cratered southern highland region of the planet
Mars. The interesting patterns of the dunes themselves are contained
within a boundary that is roughly hexagon-shaped.
https://earthsky.org/space/odyssey-weird-hexagonal-dune-field-mars/
___________________________
Unnatural Hexagon Structure Spotted on Mars
July 11, 2019
https://www.soulask.com/unnatural-hexagon-structure-spotted-on-mars/
___________________________
Weird Hexagonal Dune Field... Seen on Mars
Februry 22, 2019
https://www.bibliotecapleyades.net/marte/esp_marte_113.htm
___________________________
A Hex on Neptune
May 15, 2014
https://www.syfy.com/syfy-wire/a-hex-on-neptune
___________________________
Neptune Is NOT What We're Being Told!
Jun 21, 2025
https://www.youtube.com/watch?v=ultIiuU3IG4
___________________________
Hubble Spots Auroras on Uranus
Apr 10, 2017

ESA/Hubble & NASA,
This is a composite image of Uranus by Voyager 2 and two different observations made by Hubble — one for the ring and one for the auroras.
Ever since Voyager 2 beamed home spectacular images of the planets in the 1980s, planet-lovers have been hooked on auroras on other planets. Auroras are caused by streams of charged particles like electrons that come from various origins such as solar winds, the planetary ionosphere, and moon volcanism. They become caught in powerful magnetic fields and are channeled into the upper atmosphere, where their interactions with gas particles, such as oxygen or nitrogen, set off spectacular bursts of light.
The auroras on Jupiter and Saturn are well-studied, but not much is known about the auroras of the giant ice planet Uranus. In 2011, the NASA/ESA Hubble Space Telescope became the first Earth-based telescope to snap an image of the auroras on Uranus. In 2012 and 2014 a team led by an astronomer from Paris Observatory took a second look at the auroras using the ultraviolet capabilities of the Space Telescope Imaging Spectrograph (STIS) installed on Hubble.
They tracked the interplanetary shocks caused by two powerful bursts of solar wind traveling from the sun to Uranus, then used Hubble to capture their effect on Uranus’ auroras — and found themselves observing the most intense auroras ever seen on the planet. By watching the auroras over time, they collected the first direct evidence that these powerful shimmering regions rotate with the planet. They also re-discovered Uranus’ long-lost magnetic poles, which were lost shortly after their discovery by Voyager 2 in 1986 due to uncertainties in measurements and the featureless planet surface.
https://www.nasa.gov/image-feature/goddard/2017/hubble-spots-auroras-on-uranus
___________________________
Scientists create most detailed map of Uranus' mysterious auroras to date
October 19, 2021
https://www.space.com/uranus-observation-infrared-aurora-map
___________________________
Rare Photo: Auroras on Uranus Spotted by Hubble Telescope
April 13, 2012

Astronomers have caught the first views of auroras on the planet Uranus from a telescope near Earth, revealing tantalizing views of the tilted giant planet's hard-to-catch light shows.
The Uranus aurora photos were captured by the Hubble Space Telescope, marking the first time the icy blue planet's light show has been seen by an observatory near Earth. Until now, the only views of auroras on Uranus were from the NASA Voyager probe that zipped by the planet in 1986.
Snapping the new photos was no easy feat: Hubble recorded auroras on the day side of Uranus only twice, both times in 2011, while the planet was 2.5 billion miles (4 billion kilometers) from Earth. The observation time had to be carefully timed with a passing solar storm to maximize Hubble's chance of seeing auroras on the planet, researchers said. The two images were combined into a single photo for public release.
https://www.space.com/15270-auroras-uranus-hubble-telescope-photos.html
___________________________
Auroras on Uranus: Scientists Create Latest Map on Planet’s Mysterious Light
Oct 19, 2021
https://www.sciencetimes.com/articles/34047/20211019/auroras-on-uranus-scientists-create-latest-map-on-planet-s-mysterious-light.htm
___________________________
Hubble Spots Aurorae on the Planet Uranus
Apr 18, 2012
https://www.nasa.gov/mission_pages/hubble/science/uranus-aurora.html
___________________________
NASA snaps unprecedented image of auroras on gas giant Uranus
April 13, 2017
https://www.zmescience.com/space/aurora-on-neptune/
___________________________
Neptune Aurora
https://www.windows2universe.org/?page=/neptune/magnetosphere/N_aurora.html
___________________________
AURORAL DISPLAYS FOUND ON NEPTUNE AND TRITON
August 29, 1989
https://www.washingtonpost.com/archive/politics/1989/08/29/auroral-displays-found-on-neptune-and-triton/b609fbc8-e99f-4e84-b301-1419ec7be243/
___________________________
What are Aurora Borealis and Aurora Australis and do they match?
October 5, 2020
https://factsberry.com/what-are-aurora-borealis-and-aurora-australis/
___________________________
The Science Behind the Aurora Borealis
September 6, 2018

The aurora borealis (the Northern Lights) is much more than pretty lights–it’s a perfect blend of solar wind and magnetic fields. Let”s check out the science behind the aurora borealis.
Magnetic Field and Rubber Bands
The Earth has a magnetic field surrounding it because of the iron-nickel core at the center of our planet. Understanding this magnet field is essential to understanding the science behind the aurora borealis. The magnetic field exiting from the core is responsible for the magnetic north and south poles we use when we navigate with a compass. It also creates a magnetic force field around the Earth, which extends into space.
As charged particles (electrons are negative, protons are positive) in the solar wind encounter the Earth’s magnetic field, they travel along the field lines. On the sunward side, the field is compressed by the solar wind to be closer to the Earth; however, on the night side of the planet, the field stretches away from the planet like a tail. Eventually, the magnetic loops stretch so much that they break like an overstretched rubber band. A piece heads off into space away from Earth, while the other part snaps back toward Earth. The piece snapping back toward Earth accelerates the particles it captured into Earth’s upper atmosphere.
When these particles hit molecules in Earth’s atmosphere, they trigger light displays depending on the altitude and energy of the collision. Most of the molecules in Earth’s atmosphere are either nitrogen or oxygen, so they are hit most frequently. Colors produced may be pink, red, yellow, green, blue, or violet. Occasionally, orange or white are produced. Typically, nitrogen will produce red, violet, or blue. Oxygen usually produces green or yellow. Reds generally are emitted above 240 km, greens at 100–240 km, purple and violet above 100 km, and blues at 80–100km.
Massive Electric Currents and the aurora borealis
The movement of charged particles in Earth’s magnetic field produces powerful electric currents. In 1859, an aurora and the associated electrical storm were so powerful that people read newspapers at night by its light. Telegraph operations were disrupted as the current produced by the charged particles overwhelmed the normal currents used in the lines to transmit the signals. One pair of telegraph operators in Boston and Portland [2] turned off their power and used the current created by the electrical storm to keep their transmissions going.
https://magazine.scienceconnected.org/2018/09/the-science-behind-aurora-borealis/
___________________________
Antarctic research unlocks mysteries of the upper atmosphere
27 July 2020

A spectacular display of noctilucent clouds at Macquarie Island earlier this year.
___________________________
Northern lights: Will beautiful aurora DISAPPEAR when Earth's poles shift?
2019
https://www.express.co.uk/news/science/1130240/northern-lights-will-aurora-disappear-earth-magnetic-north-poles-shift-space-news
___________________________
Mineral often found on Mars discovered deep in Antarctic ice
January 29, 2021
Jarosite is very rarely found on Earth—it is generally seen in mining
waste that has been exposed to air and rain. The researchers with this
new effort were not looking for it in their ice cores—they were focused
on minerals in deep ice cores that might help to better understand ice
age cycles. But when they came across the yellow-brown mineral, their interest was piqued. X-ray absorption testing and electron microscopy showed it be jarosite.
https://phys.org/news/2021-01-mineral-mars-deep-antarctic-ice.html#google_vignette
___________________________
Scientists discover stardust in Antarctic snow
August 20, 2019
https://phys.org/news/2019-08-scientists-star-antarctic.html
___________________________
Where are IceCube’s neutrinos coming from?
March 14, 2022
Scientists define the most likely sources of cosmic neutrinos to hit detectors at the South Pole
IceCube
is the largest neutrino observatory in the world and consists of over
five thousand optical detectors draped through a cubic kilometer of ice
at the geographic South Pole. IceCube was built specifically to study
cosmic neutrinos that come from outside our own solar system.
Thanks
to the IceCube Neutrino Observatory, scientists have identified several
types of cosmic structures that produce neutrinos. A new study estimates
for the first time how likely a neutrino is to come from each source
type, helping physicists understand more about these ghostly particles
and how they are created in the universe.
Neutrinos are tiny,
nearly massless elementary particles that travel through the universe at
almost the speed of light. They were first made during the Big Bang and
are produced today by fusion reactions inside stars (including our own
Sun), by supernovae explosions when massive stars die, and by the
violent transformations of matter and energy that happen around black
holes...
https://antarcticsun.usap.gov/science/4713/
___________________________
A huge meteorite gouged a Greenland crater 58 million years ago, study finds
March 10, 2022
https://www.arctictoday.com/a-huge-meteorite-gouged-a-greenland-crater-58-million-years-ago-study-finds/
___________________________
Water ice detected in a debris disk around young nearby star
May 26, 2025
https://phys.org/news/2025-05-ice-debris-disk-young-nearby.html
___________________________
Alexander Island
https://en.wikipedia.org/wiki/Alexander_Island
___________________________
Mount Alexander (Antarctica)
https://en.wikipedia.org/wiki/Mount_Alexander_(Antarctica)
___________________________
Paenibacillus wynnii sp. nov., a novel species harbouring the nifH gene, isolated from Alexander Island, Antarctica
2005 Sep
Abstract
Soil taken from 12 different locations at Mars Oasis on Alexander Island, Antarctica, yielded unidentified isolates of endospore-forming bacteria. Soil from four of the locations contained Gram-negative, facultatively anaerobic, motile rods that were able to grow at 4 degrees C and which formed ellipsoidal spores that lay paracentrally or subterminally in swollen or slightly swollen sporangia. All of the strains harboured the nitrogenase gene nifH. Phenotypic tests, amplified rDNA restriction analysis (ARDRA), fatty acid analysis and SDS-PAGE analysis suggested that the isolates represented a novel taxon of Paenibacillus. 16S rRNA gene sequence comparison supported the proposal of a novel species, Paenibacillus wynnii sp. nov. (type strain, LMG 22176(T)=CIP 108306(T)).
https://pubmed.ncbi.nlm.nih.gov/16166715/
___________________________
The Albian fern flora of Alexander Island, Antarctica
2015
https://www.sciencedirect.com/science/article/abs/pii/S019566711500021X
___________________________
Cretaceous (Late Albian) coniferales of Alexander Island, Antarctica. 2. Leaves, reproductive structures and roots
2001
https://www.sciencedirect.com/science/article/abs/pii/S0034666701000537
___________________________
Lithostratigraphy of Upper Jurassic-Lower Cretaceous strata of eastern Alexander Island, Antarctica
1988
https://www.sciencedirect.com/science/article/abs/pii/0195667188900201
___________________________
Early Cretaceous Gleicheniaceae and Matoniaceae (Gleicheniales) from Alexander Island, Antarctica
2006
https://www.sciencedirect.com/science/article/abs/pii/S0034666705001533
___________________________
Cretaceous (Late Albian) coniferales of Alexander Island, Antarctica. 1: Wood taxonomy: a quantitative approach
2000
https://www.sciencedirect.com/science/article/abs/pii/S0034666700000129
___________________________
The deglacial history of NW Alexander Island, Antarctica, from surface exposure dating
2011
https://www.sciencedirect.com/science/article/abs/pii/S0033589411001517
___________________________
Tectonic implications of fore-arc magmatism and generation of high-magnesian andesites: Alexander Island, Antarctica
1998
Abstract
Alexander Island, situated off the west coast of the Antarctic Peninsula, contains a suite of Late Cretaceous to Early Tertiary subduction-related magmatic rocks. The rocks occupy a fore-arc position 100–200 km trenchward of the main arc (Antarctic Peninsula) and they become younger northward along the length of the island. Major and trace element geochemistry for 222 samples shows the suite to be a medium to high-K calc-alkaline series, ranging in composition from picro-basalt to rhyolite. Andesite samples show a large range in MgO and Mg#, with nine samples representing high-magnesian andesites.Sr and Nd isotopic data indicate that the andesites range isotopically to more depleted mantle compositions than the associated basalts. The dacite/rhyolites can be related compositionally to the andesites by assimilation of typical Pacific rim accretionary material. To produce high-magnesian andesite lavas, it is necessary to introduce a suitable source of heat into the fore-arc, thus enabling partial melting of depleted sub fore-arc hydrous peridotite. A causative link with ridge subduction prior to magmatism is proposed, with successive ridge–trench collisions producing a temporal migration of the magmatism and high geothermal gradients in an anomalously hot fore-arc region.
___________________________
The deglacial history of NW Alexander Island, Antarctica, from surface exposure dating
Abstract
Recent changes along the margins of the Antarctic Peninsula, such as the collapse of the Wilkins Ice Shelf, have highlighted the effects of climatic warming on the Antarctic Peninsula Ice Sheet (APIS). However, such changes must be viewed in a long-term (millennial-scale) context if we are to understand their significance for future stability of the Antarctic ice sheets. To address this, we present nine new cosmogenic 10Be exposure ages from sites on NW Alexander Island and Rothschild Island (adjacent to the Wilkins Ice Shelf) that provide constraints on the timing of thinning of the Alexander Island ice cap since the last glacial maximum. All but one of the 10Be ages are in the range 10.2–21.7 ka, showing a general trend of progressive ice-sheet thinning since at least 22 ka until 10 ka. The data also provide a minimum estimate (490 m) for ice-cap thickness on NW Alexander Island at the last glacial maximum. Cosmogenic 3He ages from a rare occurrence of mantle xenoliths on Rothschild Island yield variable ages up to 46 ka, probably reflecting exhumation by periglacial processes.
___________________________
Paenibacillus wynnii sp. nov., a novel species harbouring the nifH gene, isolated from Alexander Island, Antarctica
2005 Sep
https://pubmed.ncbi.nlm.nih.gov/16166715/
___________________________
Lithostratigraphy of Upper Jurassic-Lower Cretaceous strata of eastern Alexander Island, Antarctica
1988
https://www.sciencedirect.com/science/article/abs/pii/0195667188900201
___________________________
Rothera Research Station
https://en.wikipedia.org/wiki/Rothera_Research_Station
___________________________
Early Cretaceous Gleicheniaceae and Matoniaceae (Gleicheniales) from Alexander Island, Antarctica
March 2006
https://www.researchgate.net/publication/222581219_Early_Cretaceous_Gleicheniaceae_and_Matoniaceae_Gleicheniales_from_Alexander_Island_Antarctica
___________________________
The deglacial history of NW Alexander Island, Antarctica, from surface exposure dating
20 January 2017
https://www.cambridge.org/core/journals/quaternary-research/article/abs/deglacial-history-of-nw-alexander-island-antarctica-from-surface-exposure-dating/CF830FAE75567B802459BEAF2D5DBF17
___________________________
The age and stratigraphy of fore-arc magmatism on Alexander Island, Antarctica
01 July 1997
https://www.cambridge.org/core/journals/geological-magazine/article/abs/age-and-stratigraphy-of-forearc-magmatism-on-alexander-island-antarctica/0EC9E1A32024AEE1DBEED865AA4AEFE3
___________________________
Microplastics in marine sediments near Rothera Research Station, Antarctica
2018
https://www.sciencedirect.com/science/article/abs/pii/S0025326X18303977
___________________________
Antarctic sea ice reaches new record maximum
October 8, 2014
Sea ice surrounding Antarctica reached a new record high extent this year, covering more of the southern oceans than it has since scientists began a long-term satellite record to map sea ice extent in the late 1970s.
Sea ice surrounding Antarctica reached a new record high extent this year, covering more of the southern oceans than it has since scientists began a long-term satellite record to map sea ice extent in the late 1970s. The upward trend in the Antarctic, however, is only about a third of the magnitude of the rapid loss of sea ice in the Arctic Ocean.
The new Antarctic sea ice record reflects the diversity and complexity of Earth’s environments, said NASA researchers. Claire Parkinson, a senior scientist at NASA’s Goddard Space Flight Center, has referred to changes in sea ice coverage as a microcosm of global climate change. Just as the temperatures in some regions of the planet are colder than average, even in our warming world, Antarctic sea ice has been increasing and bucking the overall trend of ice loss.
“The planet as a whole is doing what was expected in terms of warming. Sea ice as a whole is decreasing as expected, but just like with global warming, not every location with sea ice will have a downward trend in ice extent,” Parkinson said.
Since the late 1970s, the Arctic has lost an average of 20,800 square miles (53,900 square kilometers) of ice a year; the Antarctic has gained an average of 7,300 square miles (18,900 sq km). On Sept. 19 this year, for the first time ever since 1979, Antarctic sea ice extent exceeded 7.72 million square miles (20 million square kilometers), according to the National Snow and Ice Data Center. The ice extent stayed above this benchmark extent for several days. The average maximum extent between 1981 and 2010 was 7.23 million square miles (18.72 million square kilometers).
The single-day maximum extent this year was reached on Sept. 20, according to NSIDC data, when the sea ice covered 7.78 million square miles (20.14 million square kilometers). This year's five-day average maximum was reached on Sept. 22, when sea ice covered 7.76 million square miles (20.11 million square kilometers), according to NSIDC.
This year, Antarctic sea ice reached a record maximum extent while the Arctic reached a minimum extent in the ten lowest since satellite records began. Why are these trends going in opposite directions?Credit: NASA Goddard Space Flight Center / Joy Ng
A warming climate changes weather patterns, said Walt Meier, a research scientist at Goddard. Sometimes those weather patterns will bring cooler air to some areas. And in the Antarctic, where sea ice circles the continent and covers such a large area, it doesn’t take that much additional ice extent to set a new record.
“Part of it is just the geography and geometry. With no northern barrier around the whole perimeter of the ice, the ice can easily expand if conditions are favorable,” he said.
Researchers are investigating a number of other possible explanations as well. One clue, Parkinson said, could be found around the Antarctic Peninsula – a finger of land stretching up toward South America. There, the temperatures are warming, and in the Bellingshausen Sea just to the west of the peninsula the sea ice is shrinking. Beyond the Bellingshausen Sea and past the Amundsen Sea, lies the Ross Sea – where much of the sea ice growth is occurring.
That suggests that a low-pressure system centered in the Amundsen Sea could be intensifying or becoming more frequent in the area, she said – changing the wind patterns and circulating warm air over the peninsula, while sweeping cold air from the Antarctic continent over the Ross Sea. This, and other wind and lower atmospheric pattern changes, could be influenced by the ozone hole higher up in the atmosphere – a possibility that has received scientific attention in the past several years, Parkinson said.
“The winds really play a big role,” Meier said. They whip around the continent, constantly pushing the thin ice. And if they change direction or get stronger in a more northward direction, he said, they push the ice further and grow the extent. When researchers measure ice extent, they look for areas of ocean where at least 15 percent is covered by sea ice.
While scientists have observed some stronger-than-normal pressure systems – which increase winds – over the last month or so, that element alone is probably not the reason for this year’s record extent, Meier said. To better understand this year and the overall increase in Antarctic sea ice, scientists are looking at other possibilities as well.
Melting ice on the edges of the Antarctic continent could be leading to more fresh, just-above-freezing water, which makes refreezing into sea ice easier, Parkinson said. Or changes in water circulation patterns, bringing colder waters up to the surface around the landmass, could help grow more ice.
Snowfall could be a factor as well, Meier said. Snow landing on thin ice can actually push the thin ice below the water, which then allows cold ocean water to seep up through the ice and flood the snow – leading to a slushy mixture that freezes in the cold atmosphere and adds to the thickness of the ice. This new, thicker ice would be more resilient to melting.
“There hasn’t been one explanation yet that I’d say has become a consensus, where people say, ‘We’ve nailed it, this is why it’s happening,’” Parkinson said. “Our models are improving, but they’re far from perfect. One by one, scientists are figuring out that particular variables are more important than we thought years ago, and one by one those variables are getting incorporated into the models.”
For Antarctica, key variables include the atmospheric and oceanic conditions, as well as the effects of an icy land surface, changing atmospheric chemistry, the ozone hole, months of darkness and more.
“Its really not surprising to people in the climate field that not every location on the face of Earth is acting as expected – it would be amazing if everything did,” Parkinson said. “The Antarctic sea ice is one of those areas where things have not gone entirely as expected. So it’s natural for scientists to ask, ‘OK, this isn’t what we expected, now how can we explain it?’”
https://climate.nasa.gov/news/2169/antarctic-sea-ice-reaches-new-record-maximum/
___________________________
Atmospheric Precursors to the Antarctic Sea Ice Record Low in February 2022
2022
___________________________
The Antarctic water puzzle—how flooding contributes to ice melt
May 12, 2025
https://phys.org/news/2025-05-antarctic-puzzle-contributes-ice.html
___________________________
'Very worried': Scientists fret as Antarctic sea ice dwindles
March 2, 2024
Sea ice levels in Antarctica have registered historic lows for three consecutive years, portending grave consequences for life on Earth as we know it.
But looking out over the southernmost continent, scientist Miguel Angel de Pablo laments that humanity seems to be oblivious to the warnings.
"We (scientists) are very worried... because we don't see how we can solve it ourselves," the Spanish planetary geologist told AFP on Livingston Island in the South Shetland Antarctic archipelago.
"The more alerts we send out... to make society aware of what is happening, it seems we are not listened to, that we are (perceived as) alarmist" despite the evidence, he said.
The US National Snow & Ice Data Center (NSIDC) reported Wednesday that minimum Antarctic sea ice extent came in at under two million square kilometers (772,000 square miles) for a third consecutive February—the height of the southern summer thaw season.
Minimum sea ice cover for all three years were the lowest since records began 46 years ago.
Melting sea ice has no immediate impact on ocean levels, as it forms by freezing salt water already in the ocean.
But the white ice reflects more of the sun's rays than darker ocean water, and its loss accentuates global warming while exposing the on-land freshwater ice sheet, which could cause a catastrophic sea level rise if it melts.
"Even though we are far from any inhabited part of the planet, in reality what happens in Antarctica affects everything" in the rest of the world, said De Pablo...
https://phys.org/news/2024-03-scientists-fret-antarctic-sea-ice.html
___________________________
June Antarctic sea ice lowest on record, 2nd lowest in Arctic
Jul 5, 2019
https://www.kxan.com/weather/june-antarctic-sea-ice-lowest-on-record-2nd-lowest-in-arctic/
___________________________
Despite record low ice, nations again fail to agree Antarctic reserves
October 27, 2023
A multinational group on Antarctic conservation failed to break a years-long deadlock and agree new marine reserves in the region, despite record low ice, environmental groups said Friday.
The Commission for the Conservation of Antarctic Marine Living Resources ended a fortnight of meetings in Australia once again unable to reach a deal on three new marine protected areas (MPAs).
The proposed sanctuaries around Antarctica would safeguard nearly four million square kilometers (1.5 million square miles) of ocean from human activities, in the largest act of ocean protection in history.
"It's frustrating that discussions for MPAs have been ongoing for more than a decade and utterly disappointing that CCAMLR has been unable to make significant progress again, particularly following a year of unprecedented and concerning change for Antarctica," said WWF's Antarctic conservation manager Emily Grilly.
The areas were first proposed in 2010, before being scaled down in 2017, in an attempt to win more support.
But their creation has persistently been blocked by China and Russia, including most recently at the commission's June meeting in Chile.
NGOs including WWF had expressed hope that the commission might now act given record low levels of sea-ice in the region and evidence of "mass deaths of vulnerable species".
Greenpeace said the gridlock was all the more notable given successful negotiations to reach the UN ocean treaty earlier this year.
"Another year, another failed Antarctic Ocean Commission meeting. The Commission can always agree to new fishing licenses, but can't agree on a concrete pathway forwards on protection," said Jehki Harkonen, Greenpeace International's ocean policy advisor.
CCAMLR did not immediately publish a statement on the outcome of its meeting.
Rapidly changing region
The proposed protected areas would have limited human activity, particularly fishing, and environmentalists say they would be key to helping species recover in the rapidly changing region.
"We can't stop all the effects of climate change in the short term, but we can take the pressure off in other ways," Grilly said.
But there has historically been little appetite for the project from Beijing and Moscow, who have expressed concerns about compliance issues and fishing rights.
The CCAMLR, which regulates fisheries, is comprised of 26 member countries plus the EU. They include the United States, Russia, China, the UK, France, India, Japan, host Chile, Brazil and South Africa.
This year, sea ice around Antarctica hit its lowest winter levels since records began 45 years ago, the US National Snow and Ice Data Center said.
The measurement was preliminary, as continued winter conditions could cause additional ice formation, but it correlates with a trend of declining ice seen since August 2016.
There is debate among scientists over the cause of the shift, with some reluctant to establish a formal link with global warming.
Climate models have struggled in the past to predict changes in the Antarctic ice pack.
The effect on wildlife in the region is already clear, however, with scientists in August reporting a "catastrophic breeding failure" of emperor penguins as sea ice gave way beneath fledgling chicks.
Thousands of baby penguins are believed to have died, with all but one of five sites monitored by scientists experiencing 100 percent loss.
https://phys.org/news/2023-10-ice-nations-antarctic-reserves.html
___________________________
Record low Antarctic sea ice is another alarming sign the ocean's role as climate regulator is changing, says researcher
May 5, 2023
https://phys.org/news/2023-05-antarctic-sea-ice-alarming-ocean.html
___________________________
Dinoflagellates in a fast-ice covered inlet of the Riiser-Larsen Ice Shelf (Weddell Sea)
2009
https://www.researchgate.net/publication/225136630_Dinoflagellates_in_a_fast-ice_covered_inlet_of_the_Riiser-Larsen_Ice_Shelf_Weddell_Sea
___________________________
Marine and non-marine contribution to the chemical composition of snow at the Riiser-Larsenisen Ice Shelf in Antarctica
1984
https://www.sciencedirect.com/science/article/abs/pii/0004698184902671
___________________________
Riiser-Larsen Sea
https://en.wikipedia.org/wiki/Riiser-Larsen_Sea
The
Riiser-Larsen Sea is one of the marginal seas located in the Southern
Ocean off East Antarctica and south of the Indian Ocean. It is delimited
Astrid Ridge in the west and the Gunnerus Ridge and the Kainanmaru Bank
in the east. It is bordered by the Lazarev Sea to the west and the
Cosmonauts Sea to the east, or between 14°E and 30°E. Its northern
border is defined to be the 65th parallel south. The name, proposed by
the Soviet Union, was never officially approved by the International
Hydrographic Organization (IHO).
To the south of this area lies
the Princess Astrid Coast and Princess Ragnhild Coast of Queen Maud
Land. In the western part is the Lazarev Ice Shelf, and further east are
Erskine Iceport and Godel Iceport, and the former Belgian Roi-Baudouin
Station.
___________________________
Numerical simulations of major ice streams in Western Dronning Maud Land, Antarctica, under wet and dry basal conditions
2017
https://www.researchgate.net/publication/258624993_Numerical_simulations_of_major_ice_streams_in_Western_Dronning_Maud_Land_Antarctica_under_wet_and_dry_basal_conditions
___________________________
Dinoflagellates in a fast-ice covered inlet of the Riiser-Larsen Ice Shelf (Weddell Sea)
24 April 2009
https://link.springer.com/article/10.1007/s00300-009-0630-5
___________________________
Aeromagnetic reconnaissance over the Riiser-Larsen Ice Shelf, east Antarctica
1988
https://www.academia.edu/22470580/Aeromagnetic_reconnaissance_over_the_Riiser_Larsen_Ice_Shelf_east_Antarctica
___________________________
Larsen Ice Shelf
https://en.wikipedia.org/wiki/Larsen_Ice_Shelf
The
Larsen Ice Shelf is a long ice shelf in the northwest part of the
Weddell Sea, extending along the east coast of the Antarctic
Peninsula[1] from Cape Longing to Smith Peninsula. It is named after
Captain Carl Anton Larsen, the master of the Norwegian whaling vessel
Jason, who sailed along the ice front as far as 68°10' South during
December 1893.[2] In finer detail, the Larsen Ice Shelf is a series of
shelves that occupy (or occupied) distinct embayments along the coast.
From north to south, the segments are called Larsen A (the smallest),
Larsen B, and Larsen C (the largest) by researchers who work in the
area.[3] Further south, Larsen D and the much smaller Larsen E, F and G
are also named.[4]
The breakup of the ice shelf since the
mid-1990s has been widely reported,[5] with the collapse of Larsen B in
2002 being particularly dramatic. A large section of the Larsen C shelf
broke away in July 2017 to form an iceberg known as A-68.[6]
The
ice shelf originally covered an area of 85,000 square kilometres (33,000
sq mi), but following the disintegration in the north and the break
away of iceberg A-17, it now covers an area of 67,000 square kilometres
(26,000 sq mi).

An image of the collapsing Larsen B Ice Shelf and a comparison of this to the U.S. state of Rhode Island.

Glacier–ice shelf interactions.

The fractured berg and shelf are visible in this image acquired by the Thermal Infrared Sensor (TIRS) on the Landsat 8 satellite on 21 July 2017 (Lighter = warmer).
___________________________
World of Change: Collapse of the Larsen-B Ice Shelf
https://earthobservatory.nasa.gov/world-of-change/LarsenB
___________________________
In Photos: Antarctica's Larsen C Ice Shelf Through Time
July 12, 2017
Hanging on by a thread

The Antarctic peninsula is made up of several ice shelves, including Larsen A, B and C. Whereas two of these ice shelves (A and B), which are floating extensions of land-based glaciers, collapsed in 1995 and 2002, respectively, Larsen C is still holding on … but only by a thread. Scientists say it could calve a Delaware-size iceberg at any moment now, as a rift continues to grow and the shelf speeds its Here, a snapshot of the rift in Larsen C, taken on Nov. 10, 2016; in early December 2016, the crack was 70 miles (112 km) long.
September issue

On Sept. 29, 2016, when this image was captured, the rift in the Larsen C ice shelf had grown to 80 miles (130 km).
Post calving

Another image of the Larsen C rift from Nov. 10, 2016. Once Larsen C calves an iceberg, scientists are concerned the ice shelf will begin to retreat. "Iceberg calving is a normal part of the glacier life cycle, and there is every chance that Larsen C will remain stable and this ice will regrow," Paul Holland, a BAS ice and ocean modeler, said in a statement. "However, it is also possible that this iceberg calving will leave Larsen C in an unstable configuration. If that happens, further iceberg calving could cause a retreat of Larsen C."
Gaping rift

The wider part of the rift in the Larsen C can be seen on Nov. 10, 2016, in this mosaic image created from multiple satellite snapshots.
https://www.livescience.com/59650-photos-antarctica-larsen-c-ice-shelf.html
___________________________
Study suggests Larsen A and B ice shelves collapsed due to atmospheric rivers
April 15, 2022
A
team of researchers affiliated with multiple institutions across Europe
has found evidence that suggests the collapse of the Larsen A and B ice
shelves was due to the arrival of atmospheric rivers. In their paper
published in the journal Communications Earth and Environment, the group
describes how they tracked the movement of atmospheric rivers during
the time period when the ice shelves collapsed and what their work
reveals about likely scenarios unfolding in Antarctica as global warming
continues.
Ice shelves form when ice from glaciers meet the sea,
and instead of breaking, they float on top of the ocean. Prior research
has suggested that as global warming continues, ice shelves have begun
to breakup. And while such breakups do not contribute to a rise in ocean
levels, their loss does allow the glaciers that spawned them to flow
unimpeded into the sea, which does raise sea levels. Prior research has
also shown that one of the major reasons for ice shelf break up is the
flow of warmer water beneath them. In this new effort, the researchers
have found that atmospheric rivers are also very likely a contributing
factor.
Atmospheric rivers, as their name suggests, are currents
of air that have different properties than the air around them. In most
cases, they are warmer and thus carry more moisture. To learn more about
the possible impact of atmospheric rivers when they flow into the
Antarctic region, the researchers used a variety of tools, including a
computer algorithm developed specifically to detect atmospheric rivers,
and climate models and imagery captured by satellites. By identifying
and following the paths of atmospheric rivers as they arrived at
Antarctica, they found that one arrived in 1995 just before the collapse
of Larsen A, and another arrived in 2002 just before the collapse of
Larsen B.
https://phys.org/news/2022-04-larsen-ice-shelves-collapsed-due.html
___________________________
NASA Study Shows Antarctica’s Larsen B Ice Shelf Nearing Its Final Act
May 14, 2015
https://www.nasa.gov/press-release/nasa-study-shows-antarctica-s-larsen-b-ice-shelf-nearing-its-final-act
___________________________
What is Larsen C?
https://www.worldatlas.com/articles/what-is-larcen-c.html
___________________________
Researchers identify biggest threats to Larsen C ice shelf
April 14, 2022
https://phys.org/news/2022-04-biggest-threats-larsen-ice-shelf.html
___________________________
Antarctica’s Larsen C ice shelf finally breaks, releases giant iceberg
Jul 12, 2017
https://www.pbs.org/newshour/science/antarcticas-larsen-c-ice-shelf-finally-breaks-releases-giant-iceberg
___________________________
Behold the collapsing beauty of Antarctica's Larsen Ice Shelf
February 8, 2017
https://www.cbsnews.com/news/antarcticas-larsen-ice-shelf-collapsing/
___________________________
Rapid Collapse of Northern Larsen Ice Shelf, Antarctica
9 Feb 1996
https://www.science.org/doi/10.1126/science.271.5250.788
___________________________
A
Severe Foehn Storm disintegrated in a couple of days 400 square
kilometers of Antarctica’s Larsen B Ice shelf giving now a free way to
land ice
06/02/2022
https://www.severe-weather.eu/global-weather/severe-foehn-storm-collapsed-400-square-kilometers-antarctica-larsenb-ice-shelf-rrc/
___________________________
Rift in Antarctica's Larsen C Ice Shelf
Dec 1, 2016
On
Nov. 10, 2016, scientists on NASA's IceBridge mission photographed an
oblique view of a massive rift in the Antarctic Peninsula's Larsen C ice
shelf. Icebridge, an airborne survey of polar ice, completed an eighth
consecutive Antarctic deployment on Nov. 18.
Ice shelves are the
floating parts of ice streams and glaciers, and they buttress the
grounded ice behind them; when ice shelves collapse, the ice behind
accelerates toward the ocean, where it then adds to sea level rise.
Larsen C neighbors a smaller ice shelf that disintegrated in 2002 after
developing a rift similar to the one now growing in Larsen C.
The
IceBridge scientists measured the Larsen C fracture to be about 70
miles long, more than 300 feet wide and about a third of a mile deep.
The crack completely cuts through the ice shelf but it does not go all
the way across it – once it does, it will produce an iceberg roughly the
size of the state of Delaware.
The mission of Operation
IceBridge is to collect data on changing polar land and sea ice and
maintain continuity of measurements between NASA's Ice, Cloud and Land
Elevation Satellite (ICESat) missions. The original ICESat mission ended
in 2009, and its successor, ICESat-2, is scheduled for launch in 2018.
Operation IceBridge, which began in 2009, is currently funded until
2019. The planned overlap with ICESat-2 will help scientists validate
the satellite’s measurements.
https://www.nasa.gov/image-feature/rift-in-antarcticas-larsen-c-ice-shelf
___________________________
Larsen C Ice Shelf Calves Large Iceberg
September 9, 2016
https://www.nesdis.noaa.gov/news/larsen-c-ice-shelf-calves-large-iceberg
___________________________
Antarctic ice-shelf advance driven by anomalous atmospheric and sea-ice circulation
05 May 2022
Abstract
The disintegration of the eastern Antarctic Peninsula’s Larsen A and B ice shelves has been attributed to atmosphere and ocean warming, and increased mass losses from the glaciers once restrained by these ice shelves have increased Antarctica’s total contribution to sea-level rise. Abrupt recessions in ice-shelf frontal position presaged the break-up of Larsen A and B, yet, in the ~20 years since these events, documented knowledge of frontal change along the entire ~1,400-km-long eastern Antarctic Peninsula is limited. Here, we show that 85% of the seaward ice-shelf perimeter fringing this coastline underwent uninterrupted advance between the early 2000s and 2019, in contrast to the two previous decades. We attribute this advance to enhanced ocean-wave dampening, ice-shelf buttressing and the absence of sea-surface slope-induced gravitational ice-shelf flow. These phenomena were, in turn, enabled by increased near-shore sea ice driven by a Weddell Sea-wide intensification of cyclonic surface winds around 2002. Collectively, our observations demonstrate that sea-ice change can either safeguard from, or set in motion, the final rifting and calving of even large Antarctic ice shelves.
https://www.nature.com/articles/s41561-022-00938-x
___________________________
The Larsen C Ice Shelf growing rift
19/06/2017
https://www.antarcticglaciers.org/2017/06/larsen-c-ice-rift/
___________________________
Demise of Antarctic Ice Shelf Reveals New Life
A
research expedition to the site of the former Larsen B ice shelf leads
to the discovery of an underwater habitat surviving in the most extreme
conditions
July 26, 2007
https://beta.nsf.gov/news/demise-antarctic-ice-shelf-reveals-new-life
___________________________
Physical processes controlling the rifting of Larsen C Ice Shelf, Antarctica, prior to the calving of iceberg A68
September 27, 2021
https://www.pnas.org/doi/10.1073/pnas.2105080118
___________________________
Delaware Sized Iceberg Splits Off from Antarctica’s Larsen C Ice Shelf
July 12, 2017
https://scitechdaily.com/delaware-sized-iceberg-splits-off-from-antarcticas-larsen-c-ice-shelf/
___________________________
Guest post: Ranking the reasons why the Larsen C ice shelf is melting
14 April 2022
https://www.carbonbrief.org/guest-post-ranking-the-reasons-why-the-larsen-c-ice-shelf-is-melting/
___________________________
Giant Antarctic Ice Shelf Crack Threatens to Become a Massive Iceberg
February 21, 2017
https://www.scientificamerican.com/article/giant-antarctic-ice-shelf-crack-threatens-to-become-a-massive-iceberg/
___________________________
Antarctica's Larsen B sea ice embayment has disintegrated. Land ice will empty soon.
February 04, 2022
https://www.dailykos.com/stories/2022/2/4/2078485/-Antarctica-s-Larsen-B-sea-ice-embayment-has-disintegrated-Land-ice-will-be-emptying-soon
___________________________
Massive crack in Antarctica’s Larsen C ice shelf is widening
August 23, 2016
https://www.digitaljournal.com/world/massive-crack-in-antarctica-s-larsen-c-ice-shelf-is-widening/article/473080
___________________________
Community dynamics of nematodes after Larsen ice‐shelf collapse in the eastern Antarctic Peninsula
2015 Dec 29
https://www.ncbi.nlm.nih.gov/pmc/articles/PMC4716525/
___________________________
Labile
organic carbon dynamics in continental shelf sediments after the recent
collapse of the Larsen ice shelves off the eastern Antarctic Peninsula:
A radiochemical approach
2018
https://www.sciencedirect.com/science/article/abs/pii/S0016703718304393
___________________________
British Antarctic Survey model ranks biggest threats to Larsen C ice shelf
April 22, 2022
https://www.meteorologicaltechnologyinternational.com/news/polar-weather/british-antarctic-survey-model-ranks-biggest-threats-to-larsen-c-ice-shelf.html
___________________________
Retrieve Ice Velocities and Invert Spatial Rigidity of the Larsen C Ice Shelf Based on Sentinel-1 Interferometric Data
17 June 2021
https://www.mdpi.com/2072-4292/13/12/2361
___________________________
Filchner–Ronne Ice Shelf
https://en.wikipedia.org/wiki/Filchner%E2%80%93Ronne_Ice_Shelf
The Filchner-Ronne Ice Shelf, also known as Ronne-Filchner Ice Shelf, is an Antarctic ice shelf bordering the Weddell Sea.
___________________________
Observed vulnerability of Filchner-Ronne Ice Shelf to wind-driven inflow of warm deep water
02 August 2016
https://www.nature.com/articles/ncomms12300
___________________________
Tidal influences on a future evolution of the Filchner–Ronne Ice Shelf cavity in the Weddell Sea, Antarctica
06 Feb 2018
https://tc.copernicus.org/articles/12/453/2018/
___________________________
Irreversible ocean warming threatens the Filchner-Ronne Ice Shelf
May 11, 2017
https://phys.org/news/2017-05-irreversible-ocean-threatens-filchner-ronne-ice.html
___________________________
Observed interannual changes beneath Filchner-Ronne Ice Shelf linked to large-scale atmospheric circulation
20 May 2021
https://pubmed.ncbi.nlm.nih.gov/34016971/
___________________________
Remote Control of Filchner-Ronne Ice Shelf Melt Rates by the Antarctic Slope Current
https://agupubs.onlinelibrary.wiley.com/doi/10.1029/2020JC016550
___________________________
Validity of the Ice Shelf Water plume concept under Filchner-Ronne Ice Shelf
2006
http://www.ccpo.odu.edu/~klinck/Reprints/PDF/hollandFRISP2006.pdf
___________________________
A model study of ocean circulation beneath Filchner-Ronne Ice Shelf, Antarctica: Implications for bottom water formation
2002
https://nyuscholars.nyu.edu/en/publications/a-model-study-of-ocean-circulation-beneath-filchner-ronne-ice-she
___________________________
Ice-shelf dynamics near the front of the Filchner-Ronne Ice Shelf, Antarctica, revealed by SAR interferometry
1998
https://escholarship.org/uc/item/9728p0rs
___________________________
Evidence for a dynamic grounding line in outer Filchner Trough, Antarctica, until the early Holocene
October 02, 2017
https://pubs.geoscienceworld.org/gsa/geology/article-abstract/45/11/1035/516671/Evidence-for-a-dynamic-grounding-line-in-outer?redirectedFrom=fulltext
___________________________
New Antarctic ice shelf threatened by warming
May 9, 2012
https://www.reuters.com/article/us-antarctica-global-warming-idUSBRE84811E20120509
___________________________
Unprecedented strong Modified Warm Deep Water flow towards Filchner-Ronne Ice Shelf in 2017
2019
https://epic.awi.de/id/eprint/49519/
___________________________
Sediment Patterns in the Southern Weddell Sea: Filchner Shelf and Filchner Depression
1990
https://link.springer.com/chapter/10.1007/978-94-009-2029-3_21
___________________________
Tidally induced increases in melting of Amundsen Sea ice shelves
2013
http://www.ccpo.odu.edu/~klinck/Reprints/PDF/robertsonJGR2013.pdf
___________________________
Thermal structure of the Amery Ice Shelf from borehole observations and simulations
2022
https://tc.copernicus.org/articles/16/1221/2022/
___________________________
Ambient noise correlation on the Amery Ice Shelf, East Antarctica
21 December 2013
https://academic.oup.com/gji/article/196/3/1796/584808?login=false
___________________________
Characterization of ice shelf fracture features using ICESat-2 – A case study over the Amery Ice Shelf
2020
https://www.sciencedirect.com/science/article/abs/pii/S0034425720306398
___________________________
Bathymetry Beneath the Amery Ice Shelf, East Antarctica, Revealed by Airborne Gravity
2021
https://par.nsf.gov/biblio/10332866-bathymetry-beneath-amery-ice-shelf-east-antarctica-revealed-airborne-gravity
___________________________
The 'Loose Tooth' of the Amery Ice Shelf
Oct 18, 2019
https://www.sciencetimes.com/articles/23949/20191018/the-loose-tooth-of-the-amery-ice-shelf.htm
___________________________
Antarctic Avery Ice Shelf “Prograding Considerably In Last 2 Decades”, Team Of Scientists Find
May 6, 2020
https://www.climatedepot.com/2020/05/06/study-antarctic-amery-ice-shelf-grew-considerably-over-last-20-years/
___________________________
Recent and imminent calving events do little to impair Amery ice shelf’s stability
June 2020
https://link.springer.com/article/10.1007/s13131-020-1600-6
___________________________
Atmospheric
extremes caused high oceanward sea surface slope triggering the biggest
calving event in more than 50 years at the Amery Ice Shelf
2021
https://tc.copernicus.org/articles/15/2147/2021/
___________________________
Rapid Formation of an Ice Doline on Amery Ice Shelf, East Antarctica
2021 Jul 14
Abstract
Surface meltwater accumulating on Antarctic ice shelves can drive fractures through to the ocean and potentially cause their collapse, leading to increased ice discharge from the continent. Implications of increasing surface melt for future ice shelf stability are inadequately understood. The southern Amery Ice Shelf has an extensive surface hydrological system, and we present data from satellite imagery and ICESat-2 showing a rapid surface disruption there in winter 2019, covering ∼60 km2. We interpret this as an ice-covered lake draining through the ice shelf, forming an ice doline with a central depression reaching 80 m depth amidst over 36 m uplift. Flexural rebound modeling suggests 0.75 km3 of water was lost. We observed transient refilling of the doline the following summer with rapid incision of a narrow meltwater channel (20 m wide and 6 m deep). This study demonstrates how high-resolution geodetic measurements can explore critical fine-scale ice shelf processes.
https://pubmed.ncbi.nlm.nih.gov/34433993/
___________________________
Amery Ice Shelf: Increase by 24% by 2021
June 5, 2020
https://www.gktoday.in/topic/amery-ice-shelf-increase-by-24-by-2021/
___________________________
Amery Ice Shelf
https://en.wikipedia.org/wiki/Amery_Ice_Shelf
The
Amery Ice Shelf is a broad ice shelf in Antarctica at the head of Prydz
Bay between the Lars Christensen Coast and Ingrid Christensen Coast. It
is part of Mac. Robertson Land. The name "Cape Amery" was applied to a
coastal angle mapped on 11 February 1931 by the British Australian New
Zealand Antarctic Research Expedition (BANZARE) under Douglas Mawson. He
named it for William Bankes Amery, a civil servant who represented the
United Kingdom government in Australia (1925–28). The Advisory Committee
on Antarctic Names interpreted this feature to be a portion of an ice
shelf and, in 1947, applied the name Amery to the whole shelf.
In
2001 two holes were drilled through the ice shelf by scientists from
the Australian Antarctic Division and specially designed seabed sampling
and photographic equipment was lowered to the underlying seabed. By
studying the fossil composition of sediment samples recovered,
scientists have inferred that a major retreat of the Amery Ice Shelf to
at least 80 km landward of its present location may have occurred during
the mid-Holocene climatic optimum (about 5,700 years ago).[1]
In
December 2006, it was reported by the Australian Broadcasting
Corporation that Australian scientists were heading to the Amery Ice
Shelf to investigate enormous cracks that had been forming for over a
decade at a rate of three to five metres a day. Scientists wanted to
discover what was causing the cracks, as there has not been similar
activity since the 1960s. However, the head of research stated that it
is too early to attribute the cause to global warming as there is the
possibility of a natural 50-60 year cycle being responsible.
Lambert Glacier flows from Lambert Graben into the Amery Ice Shelf on the southwest side of Prydz Bay.
The Amery Basin (68°15′S 74°30′E) is an undersea basin north of the Amery Ice Shelf.
The Chinese Antarctic Zhongshan Station and Russian Progress Station are located near this ice shelf.
The Amery Ice Shelf is the third largest ice shelf in Antarctica, after the Ross Ice Shelf and the Filchner-Ronne Ice Shelf.
___________________________
The slow-growing tooth of the Amery Ice Shelf from 2004 to 2012
1 July 2013
The Loose Tooth rift system is an active rift system located at the front of the Amery Ice Shelf, Antarctica, which is expected to calve and produce a large iceberg in the near future. A time series of Envisat advanced synthetic aperture radar (ASAR) images from February 2004 to February 2012 has been used here to observe the system. The results show that both the west (T1) and east (T2) rifts propagated rapidly over 9 years at average rates of 4.49 and 2.53 m d –1 , respectively. The rift system will not break during 2012–15 as previously projected, unless unforeseen events occur. Additionally, it was found that the heading direction of T1 turned dramatically in 2009–10. However, most surprising is that the propagation rates of both rifts have shown a decreasing trend since 2005, which might be due to increasing thickness of melange ice filling in the rifts. Other environmental factors (e.g. wind forcing and air temperature) may influence the rift motion by changing the melange ice thickness and other properties.
___________________________
Mass budgets of the Lambert, Mellor and Fisher glaciers and basal fluxes beneath their flowbands on Amery Ice Shelf
2019
https://asf.alaska.edu/wp-content/uploads/2019/03/wen_amery_massbudget.pdf
___________________________
DYNAMICS OF SURFACE MELTING OVER AMERY AND ROSS ICE SHELF IN ANTARCTIC USING OSCAT DATA
2014
https://pdfs.semanticscholar.org/6c48/ea1efc6977dfdbcb6ddc556ecc0db18c60e7.pdf
___________________________
Robots roaming in Antarctic waters reveal why Ross Ice Shelf melts rapidly in summer
July 22, 2019
A new paper offers fresh insight into the forces causing the world's largest ice shelf to melt.
A study just published in the Journal of Geophysical Research: Oceans helps to reveal the local factors that influence the Ross Ice Shelf's stability, refining predictions of how it will change and influence sea rise in the future.
Prior studies on ice shelf melt have focused on warming global waters. Yet three years of Rosetta data show that the Ross Ice Shelf is melting due to local surface waters, and that the melt is happening on an unanticipated part of the shelf. These discoveries were released in a Rosetta paper published in May; the new study details the source of this strange activity.
The study comes out of the Rosetta-Ice project, a three-year-long collection of geologic, oceanographic, and glaciological data in Antarctica. The project is immense in scope, involving a multi-institutional, interdisciplinary team with specialized instrumentation to collect first-of-its kind Antarctic data.
Local effects
"In other places in Antarctica, the ice shelves are being melted by flows of global warm water from the deep ocean to the coast," explained Dave Porter, the Lamont-Doherty Earth Observatory scientist who led the new study. "But changing melt rates for the Ross are caused mainly by a local buildup of heat in the surface layer. The question is: What dictates how much heat we build up in the summer? And the answer is that it's mostly caused by local weather processes along the ice front."
The team found that the main source of ocean heat causing the ice shelf to melt was sunlight warming the upper ocean after the region's sea ice disappeared in summertime; sea ice normally reflects sunlight, whereas darker sea water absorbs it. The team also measured large amounts of fresh water coming into the Ross Sea from rapidly melting ice shelves in the Amundsen Sea to the east of the Ross Sea. Once this extra fresh water reaches the ice front, it changes how heat mixes down from the surface to the base of the ice shelf, where melting occurs, leading the team to conclude that future Ross Ice Shelf stability depends on changing coastal conditions in both the Amundsen Sea and close to the ice shelf front...
https://phys.org/news/2019-07-robots-roaming-antarctic-reveal-ross.html
___________________________
Late Quaternary dynamics of the Lambert Glacier-Amery Ice Shelf system, East Antarctica
2020
https://dspace.library.uu.nl/handle/1874/410725
___________________________
History of benthic colonisation beneath the Amery Ice Shelf, East Antarctica
2007
https://www.int-res.com/abstracts/meps/v344/p29-37/
___________________________
Modern sedimentation, circulation and life beneath the Amery Ice Shelf, East Antarctica
2014
https://eprints.soton.ac.uk/398664/
___________________________
The cavity under the Amery Ice Shelf, East Antarctica
31 December 2007
https://core.ac.uk/display/33313910
___________________________
Antarctic Avery Ice Shelf “Prograding Considerably In Last 2 Decades”, Team Of Scientists Find
6. May 2020
https://notrickszone.com/2020/05/06/antarctic-avery-ice-shelf-prograding-considerably-in-last-2-decades-team-of-scientists-find/
___________________________
Mass balance reassessment of glaciers draining into the Abbot and Getz Ice Shelves of West Antarctica
2017
https://dspace.library.uu.nl/handle/1874/353399
___________________________
Detailed Bathymetry of the Continental Shelf Beneath the Getz Ice Shelf, West Antarctica
2020
The Getz Ice Shelf (GIS) produces major
amounts of basal meltwater due to intrusions of warm modified
Circumpolar Deep Water (mCDW) beneath the ice shelf. However, multiple
cavity openings and complex geography mean that knowledge of bathymetry
beneath the GIS is required to understand ice/ocean interactions. We
invert NASA airborne gravity data to obtain bathymetry beneath the ice
shelf. Our gravity/geology‐constrained bathymetry is a significant
advance on Bedmap2 bathymetry. The sub‐ice shelf bathymetry consists of
three cavities separated by topographic ridges extending from the ice
shelf front to the grounding line. Passages allowing limited circulation
of shallow (≲400 meters below sea level [mbsl]) water between cavities
are present, but deeper water is confined to individual cavities. Within
each cavity, bathymetric troughs (>900 mbsl) extend from the ice
shelf front to subglacial valleys beneath the ice sheet. Our analysis of
the gravity data also allows us to infer the presence of thick (>500
m) sediments near the grounding line through much of the GIS, as well
as variations in the density and/or thickness of the crust underlying
the ice shelf.
https://academiccommons.columbia.edu/doi/10.7916/vsm2-sm46
___________________________
Getz Ice Shelf melt enhanced by freshwater discharge from beneath the West Antarctic Ice Sheet
27 Apr 2020
https://tc.copernicus.org/articles/14/1399/2020/
___________________________
Getz Ice Shelf, West Antarctica: Little glacier speed increase despite basal ice shelf melting
December 2013
https://ui.adsabs.harvard.edu/abs/2013AGUFM.C21E..05A/abstract
___________________________
Year by Year, Line by Line, We Build an Image of Getz Ice Shelf
November 6, 2016
https://news.climate.columbia.edu/2016/11/06/year-by-year-line-by-line-we-build-an-image-of-getz-ice-shelf/
___________________________
Widespread increase in dynamic imbalance in the Getz region of Antarctica from 1994 to 2018
23 February 2021
https://www.nature.com/articles/s41467-021-21321-1
___________________________
Ice front blocking of ocean heat transport to an Antarctic ice shelf
26 February 2020
https://www.nature.com/articles/s41586-020-2014-5/
___________________________
Antarctica has its own 'shield' against warm water—but this could now be under threat
May 23, 2025
A little-known ocean current surrounds Antarctica, shielding it from warm water farther north. But our new research published in Geophysical Research Letters shows Antarctica's melting ice is disrupting this current, putting the continent's last line of defense at risk.
We found meltwater from Antarctica is speeding up the current, known as the Antarctic Slope Current. And it's set to become even faster by mid-century.
A faster current could be more unstable. This means eddies of warm water could eat away at Antarctica's ice, posing a major concern for the stability of Earth's climate system.
Faster ice-melt means faster sea-level rise. Humanity must act now to preserve this natural phenomenon that helps Antarctica's ice shelves remain intact.
https://phys.org/news/2025-05-antarctica-shield-threat.html#google_vignette
___________________________
Ice shards in Antarctic clouds let more solar energy reach Earth's surface
April 13, 2022
https://phys.org/news/2022-04-ice-shards-antarctic-clouds-solar.html
___________________________
Loss of sea ice alters the colors of light in the ocean
May 2, 2025
The disappearance of sea ice in polar regions due to global warming not
only increases the amount of light entering the ocean, but also changes
its color. These changes have far-reaching consequences for
photosynthetic organisms such as ice algae and phytoplankton...
https://phys.org/news/2025-05-loss-sea-ice-ocean.html
___________________________
Ice Loss Is Transforming the Light-Absorption Properties of Seawater
May 23, 2025
This disappearing ice is narrowing the range of wavelengths available to
light-harvesting organisms in Earth’s polar regions, which has
implications for the sea life that feed in these icy regions of Earth.
https://physics.aps.org/articles/v18/109
___________________________
New Global Atlas: Bathed in a Sea of Artificial Light
___________________________
Intermittent reduction in ocean heat transport into the Getz Ice Shelf cavity during strong wind events
2021
https://presentations.copernicus.org/EGU21/EGU21-5948_presentation.pdf
___________________________
Seasonal variability of ocean circulation near the Dotson Ice Shelf, Antarctica
2022
https://www.researchsquare.com/article/rs-152149/v1
___________________________
One-third of Antarctic ice shelf area at risk of collapse as planet warms
Fractures from melting and run-off will indirectly lead to sea level rise
April 8, 2021
https://www.sciencedaily.com/releases/2021/04/210408112315.htm
___________________________
Sea ice can control Antarctic ice sheet stability, new research finds
May 12, 2022
Summary:
Despite the rapid melting of ice in many parts of Antarctica during the
second half of the 20th century, researchers have found that the
floating ice shelves which skirt the eastern Antarctic Peninsula have
undergone sustained advance over the past 20 years.
https://www.sciencedaily.com/releases/2022/05/220512210525.htm
__________________________
Antarctic ice cliffs may not contribute to sea-level rise as much as predicted
Study finds even the tallest ice cliffs should support their own weight rather than collapsing catastrophically
October 21, 2019
https://www.sciencedaily.com/releases/2019/10/191021135025.htm
___________________________
How hidden lakes threaten Antarctic ice sheet stability
April 3, 2025
https://phys.org/news/2025-04-hidden-lakes-threaten-antarctic-ice.html
___________________________
Strong tides, vanishing lakes may prove beneficial to Antarctic ice shelf
April 19, 2022
The lakes that form on Antarctica's ice shelves can drive vertical cracks deep within the ice, increasing the chance of ice shelf collapse and sea level rise. However, if meltwater accumulates in certain areas and drains fast enough, it may temporarily stabilize the ice shelf despite increased warming, according to researchers.
"Antarctica's ice is the largest potential source of sea level rise," said Luke Trusel, assistant professor of geography at Penn State. "A significant percentage of the global population lives along the coastline in many of the world's largest cities. We need to understand what is happening to ice shelves to make reliable sea level predictions. Water can destabilize ice shelves, so we need to know where the water is and what it's doing."
Trusel and his colleagues used satellite data to study a meltwater lake that forms annually at the grounding line of the Amery Ice Shelf in East Antarctica. The grounding line is a zone where land ice transitions to a floating ice shelf that prevents the land ice from flowing into the ocean and raising sea levels. The ice in this area tends to dip and form a basin that could collect water.
The researchers found that strong tidal activity may facilitate water-induced fracturing, or hydrofracturing, at the grounding line and cause the meltwater lake to drain quickly, often in as little as several days. The rapid draining prevents more water from accumulating and spreading onto the ice shelf, where hydrofracturing would raise the potential for collapse. The team reported their findings, which are the first observations of tides potentially forcing large-scale lake drainage, in Geophysical Research Letters.
The researchers used data from the Landsat 8 and Sentinel-1 satellites to measure and track changes to the lake during the austral summers—December through February—of 2014 to 2020. Whereas an ordinary camera captures three different wavelengths—red, green and blue—to create an image, the Landsat 8 instruments can capture up to 11 spectral bands, including infrared light. The data return as pixels that can be used to map ice, water, snow and cloud cover...
https://phys.org/news/2022-04-strong-tides-lakes-beneficial-antarctic.html
___________________________
NASA's ICESat-2 satellite reveals shape, depth of Antarctic ice shelf fractures
March 4, 2021
https://www.sciencedaily.com/releases/2021/03/210304125333.htm
___________________________
Korff Ice Rise
https://en.wikipedia.org/wiki/Korff_Ice_Rise
Korff
Ice Rise is an ice rise, 80 nautical miles (150 km) long and 20
nautical miles (40 km) wide, lying 50 nautical miles (90 km)
east-northeast of Skytrain Ice Rise in the southwestern part of the
Ronne Ice Shelf, Antarctica. It was discovered by the US–IGY Ellsworth
Traverse Party, 1957–58, and named by the party for Professor Serge A.
Korff,[1] vice chairman of the cosmic ray technical panel, U.S. National
Committee for the International Geophysical Year, 1957–59.[2] Radar
surveying in 2013-2015 by a team from the British Antarctic Survey found
the ice to be up to around 600 metres (2,000 ft) thick and found
evidence that the Raymond Effect was operating beneath the ice divide.
___________________________
Pan–ice-sheet glacier terminus change in East Antarctica reveals sensitivity of Wilkes Land to sea-ice changes
Abstract
https://www.science.org/doi/10.1126/sciadv.1501350
___________________________
The glacial geomorphology of the Antarctic ice sheet bed
2014
https://www.cambridge.org/core/services/aop-cambridge-core/content/view/S0954102014000212
___________________________
Biodiversity, distribution and community structure of benthic hydroids from Point Géologie Archipelago (Dumont d’Urville Sea, Adélie Land, Antarctica)
03 February 2021
https://link.springer.com/article/10.1007/s00300-021-02802-x
___________________________
Scientists Just Made A Terrifying Discovery In The Mariana Trench After A Deep Sea Probe Found This
Jul 26, 2022
https://www.youtube.com/watch?v=0Kt-kDxWMyI
___________________________
Ice wedge
An ice wedge is a crack in the ground formed by a narrow or thin piece of ice that measures up to 3–4 meters in length at ground level and extends downwards into the ground up to several meters. During the winter months, the water in the ground freezes and expands.

Ice wedges in Sprengisandur, Iceland

Lakes in the Mackenzie delta. In the foreground, a drained lake shows large, low-centered ice-wedge polygons

Peninsula at the coast of the Arctic Ocean in the Mackenzie Delta area showing well developed ice-wedge polygons. A Caribou herd is grazing on it.

A melting pingo with surrounding ice wedge polygons near Tuktoyaktuk, Canada

Ice wedge exposed by erosion along the Beaufort Sea coast, Canada. The wedge formed by thermal contraction of the ground which opened a crack in winter. The crack filled with meltwater in the spring which then froze in the permafrost, causing the thin vertical lines of ice and sediment that form the wedge itself.
https://en.wikipedia.org/wiki/Ice_wedge
___________________________
Warm ocean water attacking edges of Antarctica's ice shelves
October 9, 2019
https://phys.org/news/2019-10-ocean-edges-antarctica-ice-shelves.html
___________________________
In the dark, freezing ocean under Antarctica's largest ice shelf, we discovered a thriving microbial jungle
March 11, 2022
https://phys.org/news/2022-03-dark-ocean-antarctica-largest-ice.html
___________________________
The real ice sheets of Antarctica
February 8, 2016
https://climate.nasa.gov/ask-nasa-climate/2396/the-real-ice-sheets-of-antarctica/
___________________________
Antarctica's Pine Island Glacier Just Lost Enough Ice to Cover Manhattan 5 Times Over
October 30, 2018
At 115 square miles (300 square kilometers), the enormous amount of ice that calved off the glacier's ice shelf is even larger than the mass that broke off last year, Lhermitte said.
However, the newborn iceberg didn't stay in one piece for long. Within a day, it had splintered into smaller pieces, with the largest piece measuring a substantial 87 square miles (226 square km) before it later broke apart even more, Lhermitte said.
The biggest iceberg was large enough to receive a name, but it's not yet clear whether this will happen, given that it existed for such a short time. But, if it does get a moniker, it will likely be called B-46 by the U.S. National Ice Center, Lhermitte said.
Lhermitte first noticed the crack that led to this giant calving event while looking at an Oct. 3 satellite image. Lhermitte said he gets a satellite image of the Pine Island Glacier in his inbox every day, "and all of a sudden I saw something I didn't see the day before," he told Live Science at the time.
But, after going back and looking at images from Sentinel-1, a satellite run by the European Space Agency, Lhermitte found that the crack actually appeared the last week of September, between Sept. 25 and 30. By compiling satellite images together, Lhermitte made a GIF showing how rapidly the iceberg cracked off from the ice shelf.

The newest iceberg to break off of Pine Island Glacier is large enough to cover Manhattan with ice five times over
Even more dramatic is a time-lapse from 1972 to 2018, showing how the ice shelf has retreated over the years. It's natural for ice sheets to grow and shrink over time, as this time-lapse shows. But in 2015, the ice sheet dramatically retreated, and then continued to retreat until present day without showing any growth, Lhermitte said.
For years, the ice sheet was hitting a shallow point on the ocean floor, called a pinning point, which might have kept it from regressing too far back, Lhermitte said. "After 2015, it lost the connection with this pinning point, which could explain the retreat in 2015 and 2017," Lhermitte said. "And now this [ice shelf break] is about 5 kilometers [3.1 miles] farther inland."
Moreover, Pine Island Glacier appears to be calving icebergs more frequently than it used to. In early 2000, the glacier birthed icebergs about once every six years, with calving events happening in 2001, 2007 and 2013. But since 2013, there were four of them: in 2013, 2015, 2017 and 2018, Lhermitte said.
"The retreat we see now is outside of what we have observed [in modern times]," Lhermitte said. And that's concerning because ice shelves are key structural elements for glaciers; they slow the flow of ice into the ocean, much like dirt in a clogged drain impedes the flow of water, he said.
https://www.livescience.com/63974-pine-island-iceberg-calves-2018.html
___________________________
Early to middle Miocene ice sheet dynamics in the westernmost Ross Sea (Antarctica): Regional correlations
2022
https://www.sciencedirect.com/science/article/abs/pii/S0921818122001588
___________________________
The Dynamics of the Late Neogene Antarctic Ice Sheets in the Central Ross Sea using a Multianalytical Approach
2022
https://scholarworks.iupui.edu/handle/1805/29480?locale-attribute=en
___________________________
List of Antarctic ice shelves
https://wiki2.org/en/List_of_Antarctic_ice_shelves
___________________________
List of Antarctic ice streams
https://wiki2.org/en/List_of_Antarctic_ice_streams
___________________________
List of glaciers in the Antarctic
https://wiki2.org/en/List_of_glaciers_in_the_Antarctic
___________________________
Retreat of glaciers since 1850
https://wiki2.org/en/Retreat_of_glaciers_since_1850
___________________________
Retreat of the East Antarctic ice sheet during the last glacial termination
16 January 2011
Abstract
The retreat of the East Antarctic ice sheet at the end of the last glacial period has been attributed to both sea-level rise and warming of the ocean at the margin of the ice sheet, but it has been challenging to test these hypotheses. Given the lack of constraints on the timing of retreat, it has been difficult to evaluate whether the East Antarctic ice sheet contributed to meltwater pulse 1a, an abrupt sea-level rise of approximately 20 m that occurred about 14,700 years ago. Here we use terrestrial exposure ages and marine sedimentological analyses to show that ice retreat in Mac. Robertson Land, East Antarctica, initiated about 14,000 years ago, became widespread about 12,000 years ago, and was completed by about 7,000 years ago. We use two models of different complexities to assess the forcing of the retreat. Our simulations suggest that, although the initial stage of retreat may have been forced by sea-level rise, the majority of the ice loss resulted from ocean warming at the onset of the Holocene epoch. In light of our age model we conclude that the East Antarctic ice sheet is unlikely to have been the source of meltwater pulse 1a, and, on the basis of our simulations, suggest that Antarctic ice sheets made an insignificant contribution to eustatic sea-level rise at this time.
https://www.nature.com/articles/ngeo1061
___________________________
Ice front blocking of ocean heat transport to an Antarctic ice shelf
2020
Abstract
Mass loss from the Antarctic Ice Sheet to the ocean has increased in recent decades, largely because the thinning of its floating ice shelves has allowed the outflow of grounded ice to accelerate1,2. Enhanced basal melting of the ice shelves is thought to be the ultimate driver of change2,3, motivating a recent focus on the processes that control ocean heat transport onto and across the seabed of the Antarctic continental shelf towards the ice4–6. However, the shoreward heat flux typically far exceeds that required to match observed melt rates2,7,8, suggesting that other critical controls exist. Here we show that the depth-independent (barotropic) component of the heat flow towards an ice shelf is blocked by the marked step shape of the ice front, and that only the depth-varying (baroclinic) component, which is typically much smaller, can enter the sub-ice cavity. Our results arise from direct observations of the Getz Ice Shelf system and laboratory experiments on a rotating platform. A similar blocking of the barotropic component may occur in other areas with comparable ice–bathymetry configurations, which may explain why changes in the density structure of the water column have been found to be a better indicator of basal melt rate variability than the heat transported onto the continental shelf9. Representing the step topography of the ice front accurately in models is thus important for simulating ocean heat fluxes and induced melt rates.
___________________________
Antarctic ice walls protect glaciers from warm ocean water
27 Feb 2020
The planet’s oceans are capable of storing a lot more heat than Earth’s atmosphere. But while Antarctica’s coastal glaciers have experienced accelerating melt rates over the last few decades, the continent’s interior ice remains relatively stable.
This stability isn’t well understood, nor are the threats to this stability.
Using data collected by an array of instruments deployed along the coast of the Getz glacier in West Antarctica, scientists at the University of Gothenburg, in Sweden, were able to gain new insights into the influence of warm ocean currents on the continent’s ice shelves.
The data confirmed what previous studies have shown, that Antarctica’s ice shelves are thinning as a result of global warming.
“What we found here is a crucial feedback process: the ice shelves are their own best protection against warm water intrusions,” Céline Heuzé, Gothenburg climate researcher, said in a news release. “If the ice thins, more oceanic heat comes in and melts the ice shelf, which becomes even thinner etc. It is worrying, as the ice shelves are already thinning because of global air and ocean warming.”
But the research also showed the walls at the edge of ice shelves are surprisingly effective at protecting inland ice from warm water.
The Getz glacier has a floating section measuring several hundred feet thick. Beneath this section lies saltwater. The end of this floating section features a vertical edge that plunges roughly 1,000 to 1,300 feet beneath the ocean surface.
“Warm seawater flows beneath this edge, towards the continent and the deeper ice further south,” said Anna Wåhlin, lead author of the study and professor of oceanography at Gothenburg.
But the new data showed most of the warm ocean currents are blocked by the vertical edge.
“This limits the extent to which the warm water can reach the continent,” Wåhlin said. “We have long been stumped in our attempts to establish a clear link between the transport of warm water up on the continental shelf and melting glaciers.”
The new research, published this week in the journal Nature, highlights the importance of monitoring the nexus between ice and ocean at the ends of the floating portions of coastal glaciers.
The findings suggest the threats to coastal glaciers and the inland ice they guard are different than researchers previously estimated.
“We no longer expect to see a direct link between increasing westerly winds and growing levels of melting ice,” Wåhlin said. “Instead, the increased water levels can be caused by the processes that pump up warmer, heavier water to the continental shelf, for example as low-pressure systems move closer to the continent.”
https://www.breitbart.com/news/antarctic-ice-walls-protect-glaciers-from-warm-ocean-water/
___________________________
Satellites offer new view of Chesapeake Bay's marine heat waves
May 22, 2025
https://phys.org/news/2025-05-satellites-view-chesapeake-bay-marine.html
___________________________
Both of the planet's poles experience extreme heat, and Antarctica breaks records
March 19, 2022
https://www.npr.org/2022/03/19/1087752486/antarctica-record-heat-arctic
___________________________
Atmospheric blocking and temperatures in the Antarctic Peninsula
2024
https://www.sciencedirect.com/science/article/abs/pii/S0048969724029991
___________________________
Heat-transfer analysis of the basal melting of antarctic ice shelves
1993
https://www.academia.edu/14021224/Heat_transfer_analysis_of_the_basal_melting_of_antarctic_ice_shelves
___________________________
Ice shelf basal melting in a global finite-element sea ice/ice shelf/ocean model
2012
https://epic.awi.de/id/eprint/24946/
___________________________
Late
Quaternary ice sheet dynamics and deglaciation history of the West
Antarctic Ice Sheet in the Amundsen Sea Embayment: Preliminary results
from recent research cruises
2007
https://pubs.usgs.gov/of/2007/1047/ea/of2007-1047ea127.pdf
___________________________
Morphometry
of bedrock meltwater channels on Antarctic inner continental shelves:
Implications for channel development and subglacial hydrology
2020
https://www.sciencedirect.com/science/article/pii/S0169555X20303421
___________________________
Antarctic meltwater streams shed light on longstanding hydrological mystery
February 1, 2019
https://phys.org/news/2019-02-antarctic-meltwater-streams-longstanding-hydrological.html
___________________________
Freshening by glacial meltwater enhances melting of ice shelves and reduces formation of Antarctic Bottom Water
2018 Apr
https://pubmed.ncbi.nlm.nih.gov/29675467/
___________________________
Is Antarctica losing or gaining ice?
https://skepticalscience.com/antarctica-gaining-ice.htm
___________________________
The "Unstable" West Antarctic Ice Sheet: A Primer
May 12, 2014
https://www.nasa.gov/jpl/news/antarctic-ice-sheet-20140512/
___________________________
Complete List of Ice Shelves in Antarctica
https://sciencestruck.com/complete-list-of-ice-shelves-in-antarctica
___________________________
Interannual variations in meltwater input to the Southern Ocean from Antarctic ice shelves
2020 Aug 10
https://www.ncbi.nlm.nih.gov/pmc/articles/PMC7500482/
___________________________
An ice shelf is cracking in Antarctica, but not for the reason you think
January 16, 2017
A group of scientists is gathering this week in the U.K. to discuss a slab of ice that's cracking in Antarctica. The crack could soon split off a frozen chunk the size of Delaware.
One glacier scientist, Heidi Sevestre, spent six weeks last year living on that giant slab of ice off the Antarctic Peninsula.
"It's like being on a different planet," says Sevestre, a glaciologist with the University of St Andrews in Scotland. She and her colleagues would get really excited whenever they saw a bird pass overhead because it was the only other sign of life around.
"Everything is gigantic, everything is white," she says. And everything seemed so frozen and still. But it wasn't.
"When you're camping on the ice shelf, you have no idea that you're on something that is floating and moving," she says.
The ice shelf is in constant motion: rising with the tides, splitting off icebergs at its edges, and growing again as inland glaciers feed it.
The ice shelf Sevestre was studying is called Larsen C, and it now has a massive 90-mile crack running through it.
"The big rift is slicing the ice shelf from top to bottom," Sevestre says. It's now a third of a mile deep, and as wide across as 25 highway lanes.
But this is not just another sad climate change story. It's more complicated.
"A lot of things are going on deep inside the ice," says Adrian Luckman, a glaciologist at Swansea University in the U.K. He's also leading a project to track changes in the ice shelf.
Luckman says climate change is certainly influencing this region. Larsen C used to have two neighbors to the north, Larsen A and Larsen B. As the air and water warmed, those ice shelves started melting and then splintered into shards in 1995 and 2002.
But the crack in Larsen C seems to have happened on its own, for different reasons.
"This is probably not directly attributable to any warming in the region, although of course the warming won't have helped," says Luckman. "It's probably just simply a natural event that's just been waiting around to happen."
Larsen C has a bunch of cracks. All ice shelves do. This particular crack has been around since at least the 1960s. The unusual part is that in 2014, this crack — and only this crack — started growing in spurts. Why?
"Well, that is a little bit of a mystery and that's why it drew itself to our attention," says Luckman.
It left other cracks in the dust about 50 miles ago. Now, scientists are crunching satellite and radar data to figure out how.
"And that knowledge will be useful in helping us to understand other ice shelves and how they might respond to rifts coming into them," says Luckman.
One puzzling aspect is how it managed to plow through areas of softer ice, called suture zones, that bind the ice from neighboring glaciers into one giant sheet.
"There's something different about that ice that slows it down or causes it to hang up for some period of time," says Dan McGrath, a glaciologist at Colorado State University. But, starting in 2014, that soft ice did very little to slow down this rift.
"We need to get to the bottom of understanding what changed that allowed this rift to progress as it has, and will other rifts follow suit," says McGrath, who spent four field seasons camped out on the Larsen C ice shelf. (At one point, bad storms kept him inside his tent for more than a week. "Yeah, you're peeing in a bottle," he says. "There were moments during those seven days that I questioned whether I should have studied tropical reef ecology.")
Scientists are split on how important this crack is for the stability of the whole ice shelf.
"Just because this iceberg calves off, the ice shelf isn't just going to collapse and disappear overnight," says McGrath.
Some say if this giant section breaks off, it won't make a difference. Others think it could eventually cause the whole shelf to fall apart.
"I am cautiously worried," says Ala Khazendar, a geophysicist at NASA's Jet Propulsion Laboratory. "Ice shelves are very important. They are the gates of Antarctica in a way, and the gatekeepers of Antarctica."
The ice shelves are already floating, so if they fall apart it does not immediately affect sea levels. It's what they hold back — water from all the inland glaciers — that could be problematic.
Khazendar says there are two possible scenarios. One, the iceberg will break off, he says, "and nothing spectacular will happen for many, many years." The glaciers will bulk it up with ice until it's back to its former look. Or, two, this iceberg is just the first of many irreversible losses for Larsen C, which, in combination with enough warm summers, will be weakened and shatter like the previous Larsens.
"We shall see if that big calving leads to a collapse of the ice shelf. At the moment, this is still a big question mark," says Heidi Sevestre.
According to pessimistic estimates, if the ice shelf completely disintegrated and if all the water packed in those glaciers made their way to the sea, it could significantly raise global sea levels.
"It is quite a large impact, indeed," says Sevestre.
The 30-or-so ice shelf experts gathered in the U.K. this week aren't sure whether this more serious chain reaction will happen, but they are confident, at least, that the Delaware-sized chunk will come off. The crack only has about 10 miles left to go.
___________________________
Strong El Niño Events Cause Large Changes In Antarctic Ice Shelves
January 9, 2018
https://www.eurasiareview.com/09012018-strong-el-nino-events-cause-large-changes-in-antarctic-ice-shelves/
A
new study published Jan. 8 in the journal Nature Geoscience reveals
that strong El Nino events can cause significant ice loss in some
Antarctic ice shelves while the opposite may occur during strong La Nina
events.
El Niño and La Niña are two distinct phases of the El
Niño/Southern Oscillation (ENSO), a naturally occurring phenomenon
characterized by how water temperatures in the tropical Pacific
periodically oscillate between warmer than average during El Niños and
cooler during La Niñas.
The research, funded by NASA and the NASA
Earth and Space Science Fellowship, provides new insights into how
Antarctic ice shelves respond to variability in global ocean and
atmospheric conditions.
The study was led by Fernando Paolo while
a PhD graduate student and postdoc at Scripps Institution of
Oceanography at the University of California San Diego. Paolo is now a
postdoctoral scholar at NASA’s Jet Propulsion Laboratory. Paolo and his
colleagues, including Scripps glaciologist Helen Fricker, discovered
that a strong El Niño event causes ice shelves in the Amundsen Sea
sector of West Antarctica to gain mass at the surface and melt from
below at the same time, losing up to five times more ice from basal
melting than they gain from increased snowfall. The study used satellite
observations of the height of the ice shelves from 1994 to 2017.
“We’ve
described for the first time the effect of El Niño/Southern Oscillation
on the West Antarctic ice shelves,” Paolo said. “There have been some
idealized studies using models, and even some indirect observations off
the ice shelves, suggesting that El Niño might significantly affect some
of these shelves, but we had no actual ice-shelf observations. Now we
have presented a record of 23 years of satellite data on the West
Antarctic ice shelves, confirming not only that ENSO affects them at a
yearly basis, but also showing how.”
The opposing effects of El
Niño on ice shelves – adding mass from snowfall but taking it away
through basal melt – were at first difficult to untangle from the
satellite data. “The satellites measure the height of the ice shelves,
not the mass, and what we saw at first is that during strong El Niños
the height of the ice shelves actually increased,” Paolo said. “I was
expecting to see an overall reduction in height as a consequence of mass
loss, but it turns out that height increases.”
After further
analysis of the data, the scientists found that although a strong El
Niño changes wind patterns in West Antarctica in a way that promotes
flow of warm ocean waters towards the ice shelves to increase melting
from below, it also increases snowfall particularly along the Amundsen
Sea sector. The team then needed to determine the contribution of the
two effects. Is the atmosphere adding more mass than the ocean is taking
away or is it the other way around?
“We found out that the ocean
ends up winning in terms of mass. Changes in mass, rather than height,
control how the ice shelves and associated glaciers flow into the
ocean,” Paolo said. While mass loss by basal melting exceeds mass gain
from snowfall during strong El Niño events, the opposite appears to be
true during La Niña events.
Over the entire 23-year observation
period, the ice shelves in the Amundsen Sea sector of Antarctica had
their height reduced by 20 centimeters (8 inches) a year, for a total of
5 meters (16 feet), mostly due to ocean melting. The intense 1997-98 El
Nino increased the height of these ice shelves by more than 25
centimeters (10 inches). However, the much lighter snow contains far
less water than solid ice does. When the researchers took density of
snow into account, they found that ice shelves lost about five times
more ice by submarine melting than they gained from new surface
snowpack.
“Many people look at this ice-shelf data and will fit a
straight line to the data, but we’re looking at all the wiggles that go
into that linear fit, and trying to understand the processes causing
them,” said Fricker, who was Paolo’s PhD adviser at the time the study
was conceived. “These longer satellite records are allowing us to study
processes that are driving changes in the ice shelves, improving our
understanding on how the grounded ice will change,” Fricker said.
“The
ice shelf response to ENSO climate variability can be used as a guide
to how longer-term changes in global climate might affect ice shelves
around Antarctica,” said co-author Laurie Padman, an oceanographer with
Earth & Space Research, a nonprofit research company based in
Seattle. “The new data set will allow us to check if our ocean models
can correctly represent changes in the flow of warm water under ice
shelves,” he added.
Melting of the ice shelves doesn’t directly
affect sea level rise, because they’re already floating. What matters
for sea-level rise is the addition of ice from land into the ocean,
however it’s the ice shelves that hold off the flow of grounded ice
toward the ocean.
Understanding what’s causing the changes in the
ice shelves “puts us a little bit closer to knowing what’s going to
happen to the grounded ice, which is what will ultimately affect
sea-level rise,” Fricker said. “The holy grail of all of this work is
improving sea-level rise projections,” she added.
___________________________
Troughs developed in ice-stream shear margins precondition ice shelves for ocean-driven breakup
9 Oct 2019
https://www.science.org/doi/10.1126/sciadv.aax2215
___________________________
Antarctic
ice-shelf thickness changes from CryoSat-2 SARIn mode measurements:
Assessment and comparison with IceBridge and ICESat
25 May 2020
https://link.springer.com/article/10.1007/s12040-020-01392-2
___________________________
'Upside-Down Rivers' of Warm Water Are Carving Antarctica to Pieces
October 10, 2019

https://www.livescience.com/antarctica-ice-shelf-upside-down-rivers.html
___________________________
Ocean-Ice Shelf Interaction in East Antarctica
2016
https://www.jstor.org/stable/24862288
___________________________
Warm surface waters increase Antarctic ice shelf melt and delay dense water formation
June 2022
https://www.researchgate.net/publication/361479637_Warm_surface_waters_increase_Antarctic_ice_shelf_melt_and_delay_dense_water_formation
___________________________
Explosive cyclones off Antarctica contribute to ice shelf calving
11 May 2021

https://www.antarctica.gov.au/news/2021/explosive-cyclones-off-antarctica-contribute-to-ice-shelf-calving/
___________________________
High-pressure area
https://en.wikipedia.org/wiki/High-pressure_area
A
high-pressure area, high, or anticyclone, is an area near the surface
of a planet where the atmospheric pressure is greater than the pressure
in the surrounding regions. Highs are middle-scale meteorological
features that result from interplays between the relatively larger-scale
dynamics of an entire planet's atmospheric circulation.
The
strongest high-pressure areas result from masses of cold air which
spread out from polar regions into cool neighboring regions. These highs
weaken once they extend out over warmer bodies of water.
Weaker—but
more frequently occurring—are high-pressure areas caused by atmospheric
subsidence: Air becomes cool enough to precipitate out its water vapor,
and large masses of cooler, drier air descend from above.
Within
high-pressure areas, winds flow from where the pressure is highest, at
the center of the area, towards the periphery where the pressure is
lower. However, the direction is not straight from the center outwards,
but curved due to the Coriolis effect from Earth's rotation. Viewed from
above, the wind direction is bent in the direction opposite to the
planet's rotation; this causes the characteristic spiral shape of the
tropical cyclones otherwise known as hurricanes and typhoons.
On
English-language weather maps, high-pressure centers are identified by
the letter H. Weather maps in other languages may use different letters
or symbols.
Wind circulation in the northern and southern hemispheres
The
direction of wind flow around an atmospheric high-pressure area and a
low-pressure area, as seen from above, depends on the hemisphere.
High-pressure systems rotate clockwise in the northern Hemisphere;
low-pressure systems rotate clockwise in the southern hemisphere.[2]
High
pressure systems in the temperate latitudes generally bring warm
weather in summer, when the amount of heat received from the Sun during
daytime exceeds what is lost at night, and cold weather in winter when
the amount of heat lost at night exceeds what is gained during
daytime.[3]
In the Southern Hemisphere the result is similar.
Australia and the southern cone of South America get hot, dry summer
weather from the subtropical ridge and cooler wetter winter weather as
cold fronts from the southern oceans take over.[4]
The term
cyclone was coined by Henry Piddington of the British East India Company
to describe the devastating storm of December 1789 in Coringa,
India.[5] A cyclone forms around a low-pressure area. Anticyclone, the
term for the kind of weather around a high-pressure area, was coined in
1877 by Francis Galton.[6]
A simple rule is that for
high-pressure areas, where generally air flows from the center outward,
the coriolis force given by the earth's rotation to the air circulation
is in the opposite direction of earth's apparent rotation if viewed from
above the hemisphere's pole. So, both the earth and winds around a
low-pressure area rotate counter-clockwise in the northern hemisphere,
and clockwise in the southern. The opposite to these two cases occurs in
the case of a high. These results derive from the Coriolis effect.
___________________________
-
What Is an Anticyclone?
Description
An
anticyclone is a large scale circulation of winds around an a center
point of high atmospheric pressure. This type of weather phenomenon is
the opposite of a cyclone, which rotates around a central region of low
pressure. According to the United States National Weather Service (NWS),
the winds of an anticyclone rotate clockwise in the Northern Hemisphere
and counterclockwise in the Southern Hemisphere. There are three types
of anticyclones: surface-based systems, mid-tropospheric systems, and
upper tropospheric systems. Anticyclones can also occur on other
planets, such as Jupiter, where there are two types, namely the Oval BA
and Great Red Spot anticyclones.

A diagram showing the difference between a cyclone and an anticyclone.
https://www.worldatlas.com/articles/what-is-an-anticyclone.html
___________________________
Cyclones And Anticyclones: What Is The Difference?
Cyclone vs Anticyclone: The Key Differences
The following table highlights the key differences between a cyclone and an anticyclone.

https://ownyourweather.com/cyclones-and-anticyclones/
___________________________
Antarctic Anticyclone Sending Two NASA Scientific Balloons Flying in Circles
Dec 11, 2015
https://www.nasa.gov/centers-and-facilities/wallops/antarctic-anticyclone-sending-two-nasa-scientific-balloons-flying-in-circles/
___________________________
Cyclonic and anticyclonic contributions to atmospheric energetics
24 June 2021
Abstract
Migratory cyclones and anticyclones account for most of the day-to-day weather variability in the extratropics. These transient eddies act to maintain the midlatitude jet streams by systematically transporting westerly momentum and heat. Yet, little is known about the separate contributions of cyclones and anticyclones to their interaction with the westerlies. Here, using a novel methodology for identifying cyclonic and anticyclonic vortices based on curvature, we quantify their separate contributions to atmospheric energetics and their feedback on the westerly jet streams as represented in Eulerian statistics. We show that climatological westerly acceleration by cyclonic vortices acts to dominantly reinforce the wintertime eddy-driven near-surface westerlies and associated cyclonic shear. Though less baroclinic and energetic, anticyclones still play an important role in transporting westerly momentum toward midlatitudes from the upper-tropospheric thermally driven jet core and carrying eddy energy downstream. These new findings have uncovered essential characteristics of atmospheric energetics, storm track dynamics and eddy-mean flow interaction.
https://www.nature.com/articles/s41598-021-92548-7
___________________________
The Polar Vortex, Bomb Cyclones, and Climate
April 26, 2018
https://oceanbites.org/bomb-cyclones-climate/
___________________________
Arctic Cyclones and Their Interactions With the Declining Sea Ice: A Recent Climatology
06 June 2021
https://agupubs.onlinelibrary.wiley.com/doi/full/10.1029/2020JD034366
___________________________
Impacts of synoptic-scale cyclones on Arctic sea-ice concentration: a systematic analysis
13 May 2020
https://www.cambridge.org/core/journals/annals-of-glaciology/article/impacts-of-synopticscale-cyclones-on-arctic-seaice-concentration-a-systematic-analysis/356E0EAF03A017578A8679FED26D86A4
___________________________
12.1: Anticyclones or Highs
https://geo.libretexts.org/Bookshelves/Meteorology_and_Climate_Science/Practical_Meteorology_(Stull)/12%3A_Fronts_and_Airmasses/12.00%3A_Section_1-
___________________________
Cyclones in the Arctic are becoming more intense and frequent
January 17, 2023
The storms not only threaten people, but also sea ice, which influences the global climate
https://www.sciencenews.org/article/cyclones-arctic-intense-frequent-climate
___________________________
Anthropogenic intensification of Arctic anticyclonic circulation
26 Feb 2025
Abstract
The
past four decades have witnessed a strengthening of the winter
anticyclonic circulation over the Barents-Kara Sea (BKS), a change that
has contributed substantially to amplified local warming and sea ice
loss, as well as to Eurasian cooling. However, the cause of this trend
in the BKS atmospheric circulation remains unknown. Here we show that
anthropogenic greenhouse gases are the primary driver of the
strengthening of the BKS anticyclonic circulation, with anthropogenic
aerosols playing a secondary role, both together accounting for about
86% of the observed circulation trend. Both forcings induce an amplified
BKS low-tropospheric warming through coupling with strong sea ice loss.
This amplified warming raises geopotential height aloft through thermal
expansion, causing an anomalous anticyclonic anomaly, which in turn
enhances warming and sea ice loss, forming a positive feedback loop. Our
work provides a theoretical framework for understanding Arctic
atmospheric circulation responses to anthropogenic warming and may have
implications for climate and environment in the Arctic and beyond.
https://www.science.org/doi/10.1126/sciadv.ads4508
___________________________
Association Between Extreme Atmospheric Anomalies Over Antarctic Sea Ice, Southern Ocean Polar Cyclones and Atmospheric Rivers
16 March 2022
Abstract
This
study analyses the association of Southern Ocean extratropical cyclones
and atmospheric rivers (ARs) with extreme temperature and/or moisture
atmospheric anomalies over Antarctic sea ice. The hypothesis we test is
whether the circulations associated with cyclones and ARs may routinely
lead to the presence of unusually warm, moist air masses over
ice-covered regions. The analysis is conducted over the extended Austral
winter seasons (May-September) between May 1979 and September 2012,
based on the European Centre for Medium-Range Weather Forecasts Interim
reanalysis data. Approximately 27% of intense Southern Ocean cyclones
and 20% of ARs occur in the vicinity of extreme temperature anomalies,
while 12% of intense cyclones and 46% of ARs occur in the vicinity of
extreme moisture anomalies. We summarize our results as follows: (a)
extreme atmospheric anomalies over sea ice often occur in the absence of
cyclones or ARs; (b) intense cyclones have a stronger association with
extreme temperature anomalies than ARs; (c) approximately half of the
ARs are in the vicinity of extreme moisture anomalies, while the
latter's link with cyclones is weak; and (d) if an AR is in the vicinity
of an extreme temperature anomaly, there will likely be a concurrent
extreme moisture anomaly. This points to a strong association between
ARs and moisture extremes, and a nuanced link between Southern Ocean
polar cyclones and atmospheric anomalies over Antarctic sea ice.
https://agupubs.onlinelibrary.wiley.com/doi/full/10.1029/2021JD036121
___________________________
Role of polar anticyclones and mid-latitude cyclones for Arctic summertime sea-ice melting
15 January 2018
https://www.nature.com/articles/s41561-017-0041-0
___________________________
Close interactions between the Antarctic cyclone budget and large-scale atmospheric circulation
16 May 2013
https://agupubs.onlinelibrary.wiley.com/doi/10.1002/grl.50560
___________________________
The Role of Synoptic Cyclones for the Formation of Arctic Summer Circulation Patterns as Clustered by Self-Organizing Maps
19 August 2019
https://www.mdpi.com/2073-4433/10/8/474
___________________________
Axisymmetric structure of the long lasting summer Arctic cyclones
2016
https://www.sciencedirect.com/science/article/pii/S1873965216300056
___________________________
Extratropical cyclone
Extratropical
cyclones, sometimes called mid-latitude cyclones or wave cyclones, are
low-pressure areas which, along with the anticyclones of high-pressure
areas, drive the weather over much of the Earth. Extratropical cyclones
are capable of producing anything from cloudiness and mild showers to
severe hail, thunderstorms, blizzards, and tornadoes. These types of
cyclones are defined as large scale (synoptic) low pressure weather
systems that occur in the middle latitudes of the Earth. In contrast
with tropical cyclones, extratropical cyclones produce rapid changes in
temperature and dew point along broad lines, called weather fronts,
about the center of the cyclone.
https://en.wikipedia.org/wiki/Extratropical_cyclone
___________________________
October 2022 Southern Ocean cyclone
The
October 2022 Southern Ocean cyclone, also referred to as the Peter I
storm[1] or EC2022[2] was the most intense extratropical cyclone on
record. Forming as a weak depression near Tonga late on 9 October, the
extratropical cyclone tracked slowly southeastward across the South
Pacific, remaining weak. Starting on 14 October, the cyclone began rapid
deepening as it moved towards Antarctica. Deepening rates peaked on 16
October, where the pressure fell as rapidly as 19 mbar (0.56 inHg) over a
six-hour period. The storm peaked early on 17 October in the
Bellingshausen Sea, with a minimum pressure of around 900 mbar (26.58
inHg). The cyclone moved slowly in a loop, rising in pressure over the
next few days before dissipating on 20 October.
The cyclone's
pressure has been estimated by the European Centre for Medium-Range
Weather Forecasts (ECMWF) as 900.7 mbar (26.60 inHg) at 06:00 UTC on 17
October. An analysis paper published in Geophysical Research Letters in
July 2023 got a minimum pressure of 899.91 mbar (26.574 inHg) at 03:00
UTC the same day. These pressures would make the extratropical cyclone
the most intense since at least the start of the satellite era; for
comparison, the most intense extratropical cyclone known over the North
Atlantic was the Braer Storm in 1993, with a pressure of 914 mbar (27.0
inHg).
https://en.wikipedia.org/wiki/October_2022_Southern_Ocean_cyclone
___________________________
Natural Sciences: Earth Sciences, Meteorology, Atmosphere & Troposphere
Troposphere
The
troposphere is the lowest layer of Earth's atmosphere, and is also
where nearly all weather conditions take place. It contains 75% of the
atmosphere's mass and 99% of the total mass is water vapour and
aerosols. The average height of the troposphere is 18 km (11 mi; 59,000
ft) in the tropics, 17 km (11 mi; 56,000 ft) in the middle latitudes,
and 6 km (3.7 mi; 20,000 ft) in the polar regions in winter. The total
average height of the troposphere is 13 km (8.1 mi; 43,000 ft).
The
lowest part of the troposphere, where friction with the Earth's surface
influences airflow, is the planetary boundary layer. This layer is
typically a few hundred meters to 2 km (1.2 mi; 6,600 ft) deep depending
on the landform and time of day. Atop the troposphere is the
tropopause, which is the border between the troposphere and
stratosphere. The tropopause is an inversion layer, where the air
temperature ceases to decrease with height and remains constant through
its thickness.
The word troposphere is derived from the Greek
tropos (meaning "turn, turn toward, change") and sphere (as in the
Earth), reflecting the fact that rotational turbulent mixing plays an
important role in the troposphere's structure and behaviour. Most of the
phenomena associated with day-to-day weather occur in the troposphere.
Atmospheric flow
The
flow of the atmosphere generally moves in a west to east direction.
This, however, can often become interrupted, creating a more north to
south or south to north flow. These scenarios are often described in
meteorology as zonal or meridional. These terms, however, tend to be
used about localized areas of the atmosphere (at a synoptic scale). A
fuller explanation of the flow of atmosphere around the Earth as a whole
can be found in the three-cell model.
Zonal flow
A zonal
flow regime is the meteorological term meaning that the general flow
pattern is west to east along the Earth's latitude lines, with weak
shortwaves embedded in the flow. The use of the word "zone" refers to
the flow being along the Earth's latitudinal "zones". This pattern can
buckle and thus become a meridional flow.

A zonal flow regime.
Note the dominant west-to-east flow as shown in
the 500 hPa height pattern.
Meridional flow
When
the zonal flow buckles, the atmosphere can flow in a more longitudinal
(or meridional) direction, and thus the term "meridional flow" arises.
Meridional flow patterns feature strong, amplified troughs of low
pressure and ridges of high pressure, with more north–south flow in the
general pattern than west-to-east flow.
https://funeasyenglish.com/new-home-learning-program-natural-sciences-earth-sciences-meteorology-atmosphere-troposphere.htm
___________________________
Anticyclonic storm
An
anticyclonic storm is a storm with a high-pressure center, in which
winds flow in the direction opposite to that of the flow above a region
of low pressure. Unlike a cyclonic storm, anticyclonic storms are
typically associated with fair weather and stable atmospheric
conditions. On other planets or in rare cases on Earth, anticyclones can
contribute to inclement weather. Examples include Hartmut, which
brought a blizzard to the British Isles in 2018, as well as persistent
anticyclonic storms on Jupiter and Neptune.
DescriptionSynoptic-scale anticyclones
Anticyclonic
storms at the synoptic scale usually form around high-pressure systems
where air moves apart and sinks. Air at the center of these storms is
forced away from the high pressure zones and replaced by a downdraft of
air from higher altitudes. Anticyclonic storms have fewer clouds than
cyclonic storms, due to a lower humidity. This lower humidity is caused
by the air compressing and heating up as it moves downward.
Anticyclonic
storms, as high-pressure systems, usually bring warm, clear conditions
in the summer. Occasionally, this can result in heat wave conditions and
droughts if the anticyclone remains stationary over a certain region of
land. During the winter time, the clear, settled conditions of the
anticyclone can lead to frost and fog. This is because the clear skies
created by the sinking air of the high-pressure system allow heat to be
lost from Earth's surface overnight, leading to rapid air temperature
drops that condense into frost or fog.
Due to the Coriolis
effect, anticyclonic storms involve clockwise flow in the Northern
Hemisphere and counterclockwise flow in the Southern Hemisphere.
https://en.wikipedia.org/wiki/Anticyclonic_storm
___________________________
Great Arctic Cyclone of 2012
The
Great Arctic Cyclone, or "Great Arctic Cyclone of 2012", was a powerful
extratropical cyclone that was centered on the Arctic Ocean in early
August 2012. Cyclones of this magnitude are rare in the Arctic summer,
although common in the winter. The Great Arctic Cyclone was the
strongest summer storm in the Arctic and the 13th-strongest storm
observed at any time in the Arctic, since satellite observations began
in 1979.
Although the Great Arctic Cyclone did not cause the
record melting of sea ice which occurred in 2012, turbulence from the
storm is believed to have contributed to melting of sea ice, due to
mechanical ice breakup and the rise of warmer saltier water from below;
however the main oceanic heat source, associated with inflowing Atlantic
water, remained isolated from the turbulence.
Records
The
Great Arctic Cyclone of 2012 became the strongest Arctic storm in the
summer on record, since records began in 1979. At its peak intensity of
962 mbar (28.4 inHg), the Great Arctic Cyclone was also the
13th-strongest Arctic storm overall, since reliable records began.
https://en.wikipedia.org/wiki/Great_Arctic_Cyclone_of_2012
___________________________
2018 British Isles cold wave
Anticyclone
Hartmut (dubbed the Beast from the East) was a storm that began on 22
February 2018, and brought a cold wave to Great Britain and Ireland.
Anticyclone Hartmut also brought widespread unusually low temperatures
and heavy snowfall to large areas. The cold wave combined with Storm
Emma, part of the 2017–18 European windstorm season, which made landfall
in southwest England and the south of Ireland on 2 March.
In
contrast to usual winter storms, Hartmut was not formed as a normal low
pressure area along the jetstream. The initial event was an Arctic
outbreak (caused by a disordered polar vortex) into Central Europe,
transporting not only cold air from Siberia to Europe but also – due to
the lake effect – sending heavy snowfall into Great Britain and Ireland.
This
weather situation repeated itself on the weekend of 17 and 18 March,
but was less severe than on the previous occasion, due to the onset of
spring. This briefer cold snap was given the name "Mini Beast from the
East".
https://en.wikipedia.org/wiki/2018_British_Isles_cold_wave
___________________________
Great Smog of London
https://en.wikipedia.org/wiki/Great_Smog_of_London
The
Great Smog of London, or Great Smog of 1952, was a severe air pollution
event that affected London, England, in December 1952. A period of
unusually cold weather, combined with an anticyclone and windless
conditions, collected airborne pollutants—mostly arising from the use of
coal—to form a thick layer of smog over the city. It lasted from Friday
5 December to Tuesday 9 December 1952, then dispersed quickly when the
weather changed.
The smog caused major disruption by reducing
visibility and even penetrating indoor areas, far more severely than
previous smog events, called "pea-soupers". Government medical reports
in the weeks following the event estimated that up to 4,000 people had
died as a direct result of the smog and 100,000 more were made ill by
the smog's effects on the human respiratory tract. More recent research
suggests that the total number of fatalities was considerably greater,
with estimates of between 10,000 and 12,000 deaths.
London's poor
air quality had been a problem since at least the 13th century. The
diarist John Evelyn had written about "the inconveniencie of the aer and
smoak of London [sic]" in Fumifugium, the first book written about air
pollution, in 1661. However, the Great Smog was many times worse than
anything the city had ever experienced before: it is thought to be the
worst air pollution event in the history of the United Kingdom,[9] and
the most significant for its effects on environmental research,
government regulation, and public awareness of the relationship between
air quality and health. It led to several changes in practices and
regulations, including the Clean Air Act 1956.
A period of
unusually cold weather preceding and during the Great Smog led Londoners
to burn much more coal than usual to keep themselves warm. While
better-quality "hard" coals (such as anthracite) tended to be exported
to pay off World War II debts, post-war domestic coal tended to be of a
relatively low-grade, sulphurous variety called "nutty slack" (similar
to lignite) which increased the amount of sulphur dioxide in the smoke.
There were also numerous coal-fired electric power stations in the
Greater London area, including Fulham, Battersea, Bankside, Greenwich,
West Ham and Kingston upon Thames, all of which added to the pollution.
According to the UK's Met Office, the following pollutants were emitted
each day during the smoggy period: 1,000 tonnes of smoke particles, 140
tonnes of hydrochloric acid, 14 tonnes of fluorine compounds and 370
tonnes of sulphur dioxide which may have been converted to 800 tonnes of
sulphuric acid. The relatively large size of the water droplets in the
London fog allowed for the production of sulphates without the acidity
of the liquid rising high enough to stop the reaction, and for the
resultant dilute acid to become concentrated when the fog was burned
away by the sun.
Research suggested that additional
pollution-prevention systems fitted at Battersea worsened the air
quality. Flue gas washing reduced the temperature of the flue gases so
they did not rise, but instead slumped to ground level, causing a local
nuisance.
Additionally, there was pollution and smoke from
vehicle exhaust, particularly from steam locomotives and diesel-fuelled
buses which had replaced the recently abandoned electric tram system.
Other industrial and commercial sources also contributed to the air
pollution.
Weather
On 4 December 1952, an
anticyclone settled over a windless London, causing a temperature
inversion with relatively cool, stagnant air trapped under a layer of
warmer air. The resultant fog, mixed with smoke from home and industrial
chimneys, particulates such as those from motor vehicle exhausts, and
other pollutants such as sulphur dioxide, formed a persistent smog,
which blanketed the capital the following day. The presence of tarry
particles of soot gave the smog its greenish-yellow colour, hence the
nickname "pea-souper". The absence of significant wind prevented its
dispersal and allowed an unprecedented accumulation of pollutants.
Although
the event is now widely described as the "London" smog, air pollution,
in fact, extended far beyond the capital. According to E.T. Wilkins (of
the Department of Scientific and Industrial Research, whose measurements
would make clear the connection between smoke, sulphur dioxide, and
rising deaths), fog, white mist, or grimy smog covered "many parts of
the British Isles", while "In London and the Thames Valley, fog or smog
covered upwards of 1000 square miles". However, it was in London that
the smog's effects were the greatest.
___________________________
The role of Amundsen–Bellingshausen Sea anticyclonic circulation in forcing marine air intrusions into West Antarctica
30 January 2018
https://link.springer.com/article/10.1007/s00382-018-4097-3
___________________________
Relationships
between Antarctic cyclones and surface conditions as derived from
high-resolution numerical weather prediction data
14 April 2011
https://agupubs.onlinelibrary.wiley.com/doi/full/10.1029/2010JD015358
___________________________
Record-Breaking Warm Late-Winter Over Antarctica in 2024: The Role of Western Pacific Warm Pool and Pacific Decadal Oscillation
15 April 2025
https://agupubs.onlinelibrary.wiley.com/doi/10.1029/2024GL114528
___________________________
Decadal
Variability of Winter Warm Arctic-Cold Eurasia Dipole Patterns
Modulated by Pacific Decadal Oscillation and Atlantic Multidecadal
Oscillation
24 December 2021
https://agupubs.onlinelibrary.wiley.com/doi/full/10.1029/2021EF002351
___________________________
How Does El Niño Affect Precipitation over Antarctic Peninsula and West Antarctica?
Aug 02, 2023
https://english.cas.cn/newsroom/research_news/earth/202308/t20230802_334217.shtml
___________________________
Record
warming in the South Pacific and western Antarctica associated with the
2009-10 El Niño: atmospheric and oceanic processes and coupling
Dec 2010
https://www.researchgate.net/publication/252228671_Record_warming_in_the_South_Pacific_and_western_Antarctica_associated_with_the_2009-10_El_Nino_atmospheric_and_oceanic_processes_and_coupling
___________________________
Record warming in the South Pacific and western Antarctica associated with the strong central‐Pacific El Niño in 2009–10
2010
http://agupubs.onlinelibrary.wiley.com/doi/pdfdirect/10.1029/2010GL044865?download=true
___________________________
Role of Antarctic ozone in shaping East Asian summer precipitation variability
20 June 2025
https://www.nature.com/articles/s41612-025-01116-7
___________________________
Autumn Cooling of Western East Antarctica Linked to the Tropical Pacific
18 December 2017
Abstract
Over
the past 60 years, the climate of East Antarctica cooled while portions
of West Antarctica were among the most rapidly warming regions on the
planet. The East Antarctic cooling is attributed to a positive trend in
the Southern Annular Mode (SAM) and a strengthening of the westerlies,
while West Antarctic warming is tied to zonally asymmetric circulation
changes forced by the tropics. This study finds recent (post-1979)
surface cooling of East Antarctica during austral autumn to also be tied
to tropical forcing, namely, an increase in La Niña events. The recent
increase in La Niña conditions forces a Rossby wave into the Southern
Hemisphere that increases anticyclonic circulation over the South
Atlantic. The South Atlantic anticyclone is associated with cold air
advection, weakened northerlies, and increased sea ice concentrations
across the western East Antarctic coast, which has increased the rate of
cooling at Novolazarevskaya and Syowa stations after 1979. This
enhanced cooling over western East Antarctica is tied more broadly to a
zonally asymmetric temperature trend pattern across East Antarctica
during autumn that is consistent with a tropically forced Rossby wave
rather than a SAM pattern; the positive SAM pattern is associated with
ubiquitous cooling across East Antarctica, which is not seen in
temperature observations after 1979. We conclude that El Niño–Southern
Oscillation-related circulation anomalies, particularly zonal
asymmetries that locally enhance meridional wind, are an important
component of East Antarctic climate variability during autumn, and
future changes in tropical Pacific climate will likely have implications
for East Antarctica.
https://agupubs.onlinelibrary.wiley.com/doi/10.1002/2017JD027435
___________________________
The response of atmospheric blocking and East Asian cold extremes to future Arctic Sea ice loss
2024
Highlights
• The cold extremes over East Asia (EA) may show positive response to the accelerated Arctic amplification
• The westward retreating of anticyclone over eastern Siberia plays a crucial role in regulating the cold extremes in EA.
• Weakened meridional potential vorticity gradient over East Siberia promotes the westward retreat of the local anticyclone.
https://www.sciencedirect.com/science/article/abs/pii/S0169809524001376
___________________________
What will happen if cyclone and anti-cyclone meet?
12/23/2022
If
a cyclone, which is a low pressure system, were to meet an anticylone,
which is a high pressure system a steep pressure gradient will form
between them, resulting in strong winds flowing between the systems.
This can be dangerous, especially at sea.
In the northern
hemisphere cyclones rotate counterclockwise and anticyclones rotate
clockwise. This is reversed in the southern hemisphere. As a result,
when a mid-latitude cyclone pulls up on the west side of an anticyclone,
the two can essentially work together to pull in tropical air, bringing
warm temperatures. If the cyclone is to the east of the anticyclone
they can pull in arctic or antarctic air, producing low temperatures.
Finally,
a very large anticyclone has the potential to produce a blocking
pattern, causing systems which normally move eastward to stop or even
move west. A cyclone that stalls behind such a system can produce rain,
snow, or severe weather in the same region for days. However in this
case a system does not have to directly interact with the blocking high
pressure system to be caught in the blocking pattern.
https://www.answers.com/natural-sciences/What_will_happen_if_cyclone_and_anti-cyclone_meet
___________________________
Tropical cyclone activity over western North Pacific favors Arctic sea ice increase
05 November 2024
Abstract
Teleconnections
between the tropics and the Arctic have attracted a lot of scientific
interest. However, the mechanisms by which tropical synoptic-scale
systems influence the variability of Arctic sea ice remain unknown. In
this study, we highlight the impacts of tropical cyclone (TC) activity
over the western North Pacific (WNP) on Arctic Sea Ice Concentration
(SIC) using observational evidence and climate model simulation
experiments. Our findings demonstrate significant positive correlations
between Accumulated Cyclone Energy (ACE) in the WNP and SIC in the
Arctic-Pacific Sector (APS), particularly when considering a 30-day lag.
The TC activity over the WNP induces Rossby wave train propagation
towards the Arctic, leading to anomalous cyclonic circulation over the
upper troposphere of the APS. The anomalous cyclone over the Arctic, on
one hand, signifies the deepening of the Arctic polar vortex and
diminishes adiabatic warming over the APS, subsequently inducing cooling
and drying of the lower Arctic air. This process reduces downward
longwave radiation, promoting an increase in September APS SIC. On the
other hand, the anomalous cyclone over the Arctic hinders the export of
sea ice and local melting processes throughout the Fram Strait. These
findings contribute to a deeper comprehension of tropics-Arctic
teleconnections.
https://www.nature.com/articles/s41467-024-53991-y
___________________________
Cyclone Impacts on Sea Ice Concentration in the Atlantic Arctic Ocean: Annual Cycle and Recent Changes
07 September 2023
Abstract
We
quantify sea ice concentration (SIC) changes related to synoptic
cyclones separately for each month of the year in the Greenland, Barents
and Kara Seas for 1979–2018. We find that these SIC changes can be
statistically significant throughout the year. However, their strength
varies from region to region and month to month, and their sign strongly
depends on the considered time scale (before/during vs. after cyclone
passages). Our results show that the annual cycle of cyclone impacts on
SIC is related to varying cyclone intensity and traversed sea ice
conditions. We further show that significant changes in these cyclone
impacts have manifested in the last 40 years, with the strongest changes
occurring in October and November. For these months, SIC decreases
before/during cyclones have more than doubled in magnitude in the
Barents and Kara Seas, while SIC increases following cyclones have
weakened (intensified) in the Barents Sea (Kara Sea).
https://agupubs.onlinelibrary.wiley.com/doi/full/10.1029/2023GL104657
___________________________
Researcher Examines Impact Of Melting Polar Ice On Hurricanes
April 30, 2019
___________________________
Melting sea ice in Antarctica causes ocean storms, say scientists
Dec 23, 2024
https://www.straitstimes.com/world/europe/melting-sea-ice-in-antarctica-causes-ocean-storms-scientists-say
___________________________
How a lake on an Antarctic ice shelf disappeared in three days
June 30, 2021

Landsat 8 images over the Southern
Amery Ice Shelf on the east coast of Antarctica show the ice-covered
lake before drainage and the resulting ice doline with summer meltwater
(Landsat 8/ UC San Diego, Scripps Institution of Oceanography)
https://www.ctvnews.ca/climate-and-environment/how-a-lake-on-an-antarctic-ice-shelf-disappeared-in-three-days-1.5492735
___________________________
Scientists Track the Sudden Disappearance of an Antarctic Ice-Shelf Lake
June 24, 2021
https://news.climate.columbia.edu/2021/06/24/scientists-track-sudden-disappearance-of-an-antarctic-ice-shelf-lake/
___________________________
First sessile deep-sea community found on a hard substrate below Antarctic ice shelf
March 2021
https://www.accessscience.com/content/first-sessile-deep-sea-community-found-on-a-hard-substrate-below-antarctic-ice-shelf/BR0315211
___________________________
Ocean-driven thinning enhances iceberg calving and retreat of Antarctic ice shelves
March 2, 2015
https://www.pnas.org/doi/10.1073/pnas.1415137112
___________________________
Scientists accidentally find life beneath ice shelves in the Antarctic
2021
https://news.sky.com/story/scientists-accidentally-find-life-beneath-ice-shelves-in-the-antarctic-12218906
___________________________
Clouds drive differences in future surface melt over the Antarctic ice shelves
07 Jul 2022
https://tc.copernicus.org/articles/16/2655/2022/
___________________________
Antarctica’s Conger Ice Shelf Suffers ‘Complete Collapse’
3/25/22
Satellite images show the collapse happening around March 15.
https://gizmodo.com/antarctica-s-conger-ice-shelf-suffers-complete-collaps-1848703451
___________________________
What to Know about Antarctica’s Conger Ice Shelf Collapse
March 29, 2022
https://www.scientificamerican.com/article/what-to-know-about-antarcticas-conger-ice-shelf-collapse/
___________________________
Satellite data shows entire Conger ice shelf has collapsed in Antarctica
March 2022
https://www.theguardian.com/world/2022/mar/25/satellite-data-shows-entire-conger-ice-shelf-has-collapsed-in-antarctica
___________________________
A-68s: Largest floating Iceberg
December 18, 2020
https://www.civilsdaily.com/news/a-68s-largest-floating-iceberg/
___________________________
Studies on the influence of sampling on the levels of dioxins and PCB in fish
2018 Sep 3
https://pubmed.ncbi.nlm.nih.gov/30286542/
___________________________
Studies on the influence of sampling on the levels of dioxins and PCB in fish
2018 Sep 3
https://pubmed.ncbi.nlm.nih.gov/30286542/
___________________________
Pollution Science 101 - Russia
December 2nd, 2015
Pollutionscience101Russia.blogspot.com
___________________________
Pollution Science 101 - The Arctic
June 17th, 2023
PollutionScience101Arctic.blogspot.com
___________________________
June 17th, 2023
PollutionScience101Antarctic.blogspot.com
___________________________
Pollution Science 101 - Egypt
6/1/2020
https://pollutionscience101egypt.blogspot.com
___________________________
Pollution Science 101 - China
October 6th, 2015
Pollutionscience101China.blogspot.com
___________________________
Pollution Science 101 - Israel (Fate of the Middle East)
8/9/2019
https://pollutionscience101israel.blogspot.com
___________________________
Pollution Science 101 - Cancer Investigated (California)
Jan/7/15
Pollutionscience101cancerinvestigated.blogspot.com
___________________________
Pollution Science 101 - Mexico - Faults of Mexico
5/1/2019
https://pollutionscience101mexico.blogspot.com/
___________________________
Pollution Science 101 - Texas Industry Pollution Investigated ( Texas vs BP Oil)
Feb/2/15
Pollutionscience101texasvsbpoil.blogspot.com/
___________________________
Energy Science 101 - ( Pollution Science 101 )
August 23rd, 2016
___________________________
Pollution Science 101 - Solutions
August 23rd, 2016
Pollutionscience101solutions.blogspot.com/
___________________________
Laguna
Beach Government corruption: Investigative report 1/16/2017. (Asbestos
contamination & our waterways in Orange County).
January 16th, 2017
Lagunabeachcorruption.blogspot.com
https://pollutionscience101.wordpress.com/2025/04/27/laguna-beach-ca-government-corruption-investigative-report/
___________________________
Pollution Science 101 - India - Ecological Collapse
10/9/2017
PollutionScience101india.Blogspot.com
___________________________
___________________________
Uranium Trade 101 - India & Pakistan ( Pollution Science 101- India )
10/9/2017
UraniumTrade101india.Blogspot.com
___________________________
___________________________
6/1/2020 - Pollution Science 101 - Egypt
https://pollutionscience101egypt.blogspot.com
___________________________
Pollution Science 101 - Cuba
May 7th, 2021
https://Pollutionscience101Cuba.blogspot.com
___________________________
___________________________
April 4th, 2024
PollutionScience101Florida.blogspot.com
___________________________
___________________________
___________________________
Pollution Science 101 - Brazil - Emergency Report
1/7/2020
https://pollutionscience101brazil.blogspot.com
___________________________
Race Dysgenics Brazil | Eugenics in Brazil
1/8/2020
https://eugenicsbrazil.blogspot.com
___________________________
https://pollutionscience101.wordpress.com/2023/02/16/coronavirus-investigation-news-race-virus-201/ (New Link)
https://archive.org/details/covid-news_202302 (Archive Link)
https://coronavirusinvestigation.blogspot.com (My banned Covid research link).
___________________________
The Cephalic Investigation - Race Eugenics & Dysgenics (Skull Evolution & The History of the Lineage of Man)
4/10/2020
https://skullevolution.blogspot.com
___________________________
Eugenics 101 (Dysgenics 101) - Genetics, Race, Science, Eugenics & Dysgenics
October 15th, 2020
https://eugenics101.blogspot.com
___________________________
Race Dysgenics: Evolution, Dysgenic De-evolution, Eugenics & Genetic Modification - The History of the Lineage of Man
3/5/2019
https://racedysgenics.blogspot.com
___________________________
The Dysgenics Investigation - Race, Science & the Human Genome Project - The Eugenics Investigation (Akoniti)
04/19/2018
DysgenicsInvestigation.blogspot.com
___________________________
Genetically Modified Vaccines Investigated - The Eugenics Investigation (MonsantoInvestigation.com)
8/15/2017
GMOvaccinesinvestigated.blogspot.com
___________________________
Genetically Modified Humans & Viruses - The Eugenics Investigation
July 7th, 2017
GMOhumansandviruses.blogspot.com
___________________________
The DuPont investigation
Feb/18/14
http://dupontinvestigation.blogspot.com
___________________________
King Solomon's Temple Investigation Marathon - Legend
7/21/2019
https://solomonstempleinvestigation.blogspot.com
___________________________
PollutionScience@Protonmail.com
TheInvestigations@Email.com
-
Comments
Post a Comment